2050
Sensitivity of Cardiac Diffusion Encoding Waveforms to Myocardial Extracellular Volume: A simulation study1Department of Radiological Sciences, Stanford University, Stanford, CA, United States, 2Université de Lyon, UJM-Saint-Etienne, INSA, CNRS UMR 5520, INSERM U1206, CREATIS, F-42023, Saint Etienne, France, 3Department of Radiological Sciences, University of California Los Angeles, Los Angeles, CA, United States, 4Physics and Biology in Medicine Interdepartmental Program, University of California Los Angeles, Los Angeles, CA, United States, 5Division of Radiology, Veteran Affairs Health Care System, Palo Alto, CA, United States, 6Cardiovascular Institute, Stanford University, Palo Alto, CA, United States
Synopsis
In vivo cardiac DWI is sensitive to cardiac bulk motion and requires second-order motion compensated gradient designs. Even for a fixed b-value, motion and non-motion compensated diffusion encoding gradient waveforms have different lobe durations, number of encoding lobes, and diffusion encoding times (Δ). It remains unclear if these gradient waveforms have the same sensitivity to intra- and extra-cellular diffusion and to ECV changes. The objective of this work was to analyze the sensitivity of various gradient waveforms (fixed b-value) to a change in ECV by simulating molecular displacements in a two-compartment model.
Background
Myocardial fibrosis underlies cardiac remodeling and can lead to cardiac impairment and eventual heart failure (1). In practice, fibrosis can be observed by estimating the extracellular volume (ECV) using contrast media and T1-mapping (2). Cardiac diffusion weighted imaging (cDWI) is a non-contrast technique to measure both the degree of fibrosis and microstructural remodeling of the extracellular matrix. However, in vivo cDWI is sensitive to cardiac bulk motion and requires a second-order motion compensated gradient design (M1=M2=0) (3). The addition of M1+M2 motion compensation extends the TE for an equivalent b-value. This TE penalty can be offset, in part, by using an asymmetric gradient waveform generated by numerical optimization such as convex optimization diffusion encoding (CODE) (4).Even for a fixed b-value, each symmetric or asymmetric diffusion gradient design has different lobe durations, number of encoding lobes, and diffusion encoding times Δ. It remains unclear if these gradients have the same sensitivity to intra- and extra-cellular diffusion and to ECV changes. In this work, molecular displacement was simulated for several cDWI encoding waveforms and under different ECV conditions. The objective of this work was to analyze the sensitivity of each gradient waveform to a change in ECV by simulating molecular displacements.
Methods
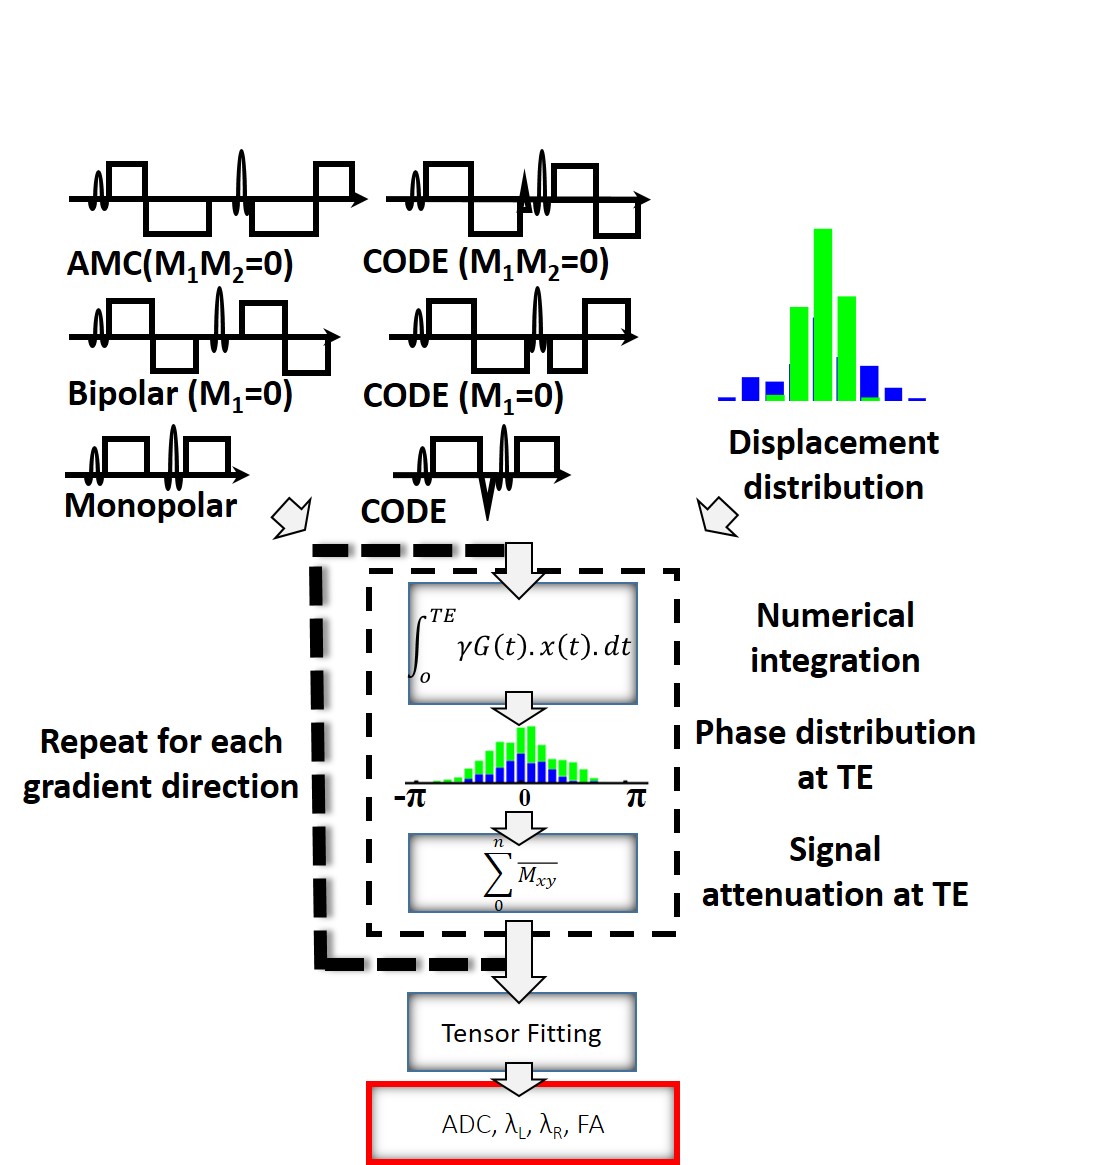
The framework used to simulate intra- and extra-cellular diffusion is shown in the animated Figure 1. Cardiomyocytes of diameter 18µm and length 100µm (connected along the axial direction) were generated to fill a 0.5x0.5x0.5 mm3 voxel. A range of ECV values from 10% to 100% were simulated by changing the density of the cells in the voxel (the cell to cell distance). The intra-cellular and extra-cellular compartments were kept impermeable in order to study them independently. The displacement history of one thousand water molecules was simulated using a random walk approach with a time step (dt) of 25µs interpolated linearly to 1µs. The native coefficient of diffusion D0 of the molecules was 2.2 x 10⁻³mm2/s and 1.5 x 10⁻³mm2/s in the extra- and intra-cellular compartments, respectively (5). The reference apparent diffusion coefficient (ADC), the longitudinal diffusivity λL, the radial diffusivities λR, and the fraction of anisotropy (FA) were then calculated directly from the displacement distribution at TE.Figure 2 presents the gradient encoding framework used to simulate the diffusion encoding. First, three symmetric diffusion encoding schemes, Monopolar, Bipolar (M1=0), Acceleration Motion Compensated (AMC, M1=M2=0) and their asymmetric counterparts, CODE, CODE-M1, and CODE-M2 were generated for a b-value of 350s/mm² resulting in a TE of 38, 54, 61, 30, 48, and 55ms respectively. Then, per waveform and for twelve encoding directions, the gradient encoding was applied to the displacement distribution of the water molecules by using numerical integration with dt=1µs. For a given ECV, the same distribution of molecular displacements was used for all waveforms, but integrated over the respective TE. Without considering relaxation effects, the diffusion encoding results in an intravoxel phase distribution. The final signal attenuation was obtained by a complex sum of this phase distribution. Measured ADC, FA, longitudinal diffusivity λL and the radial diffusivities λR were calculated from linear regression of the diffusion tensor model (6) using the twelve gradient directions.
Results
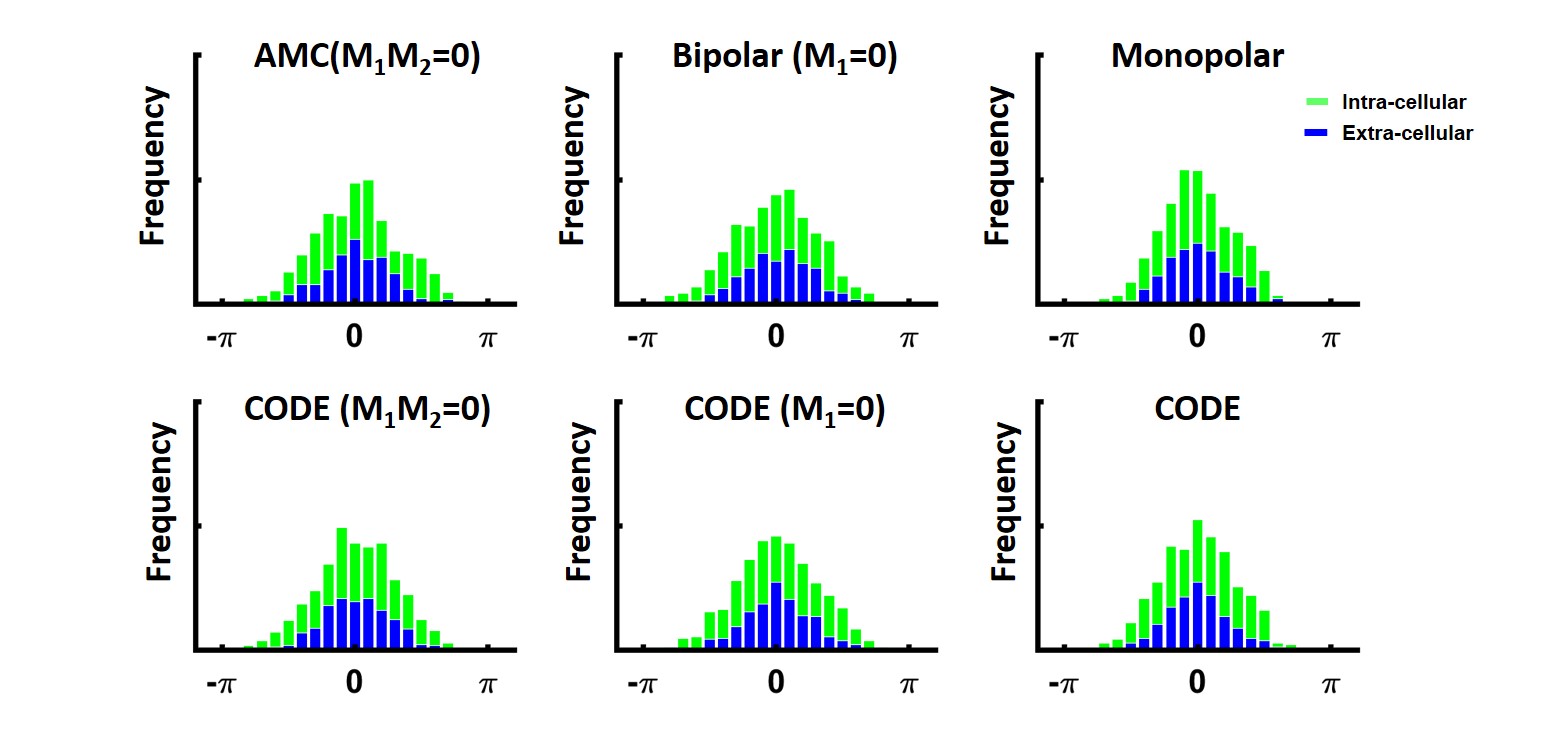
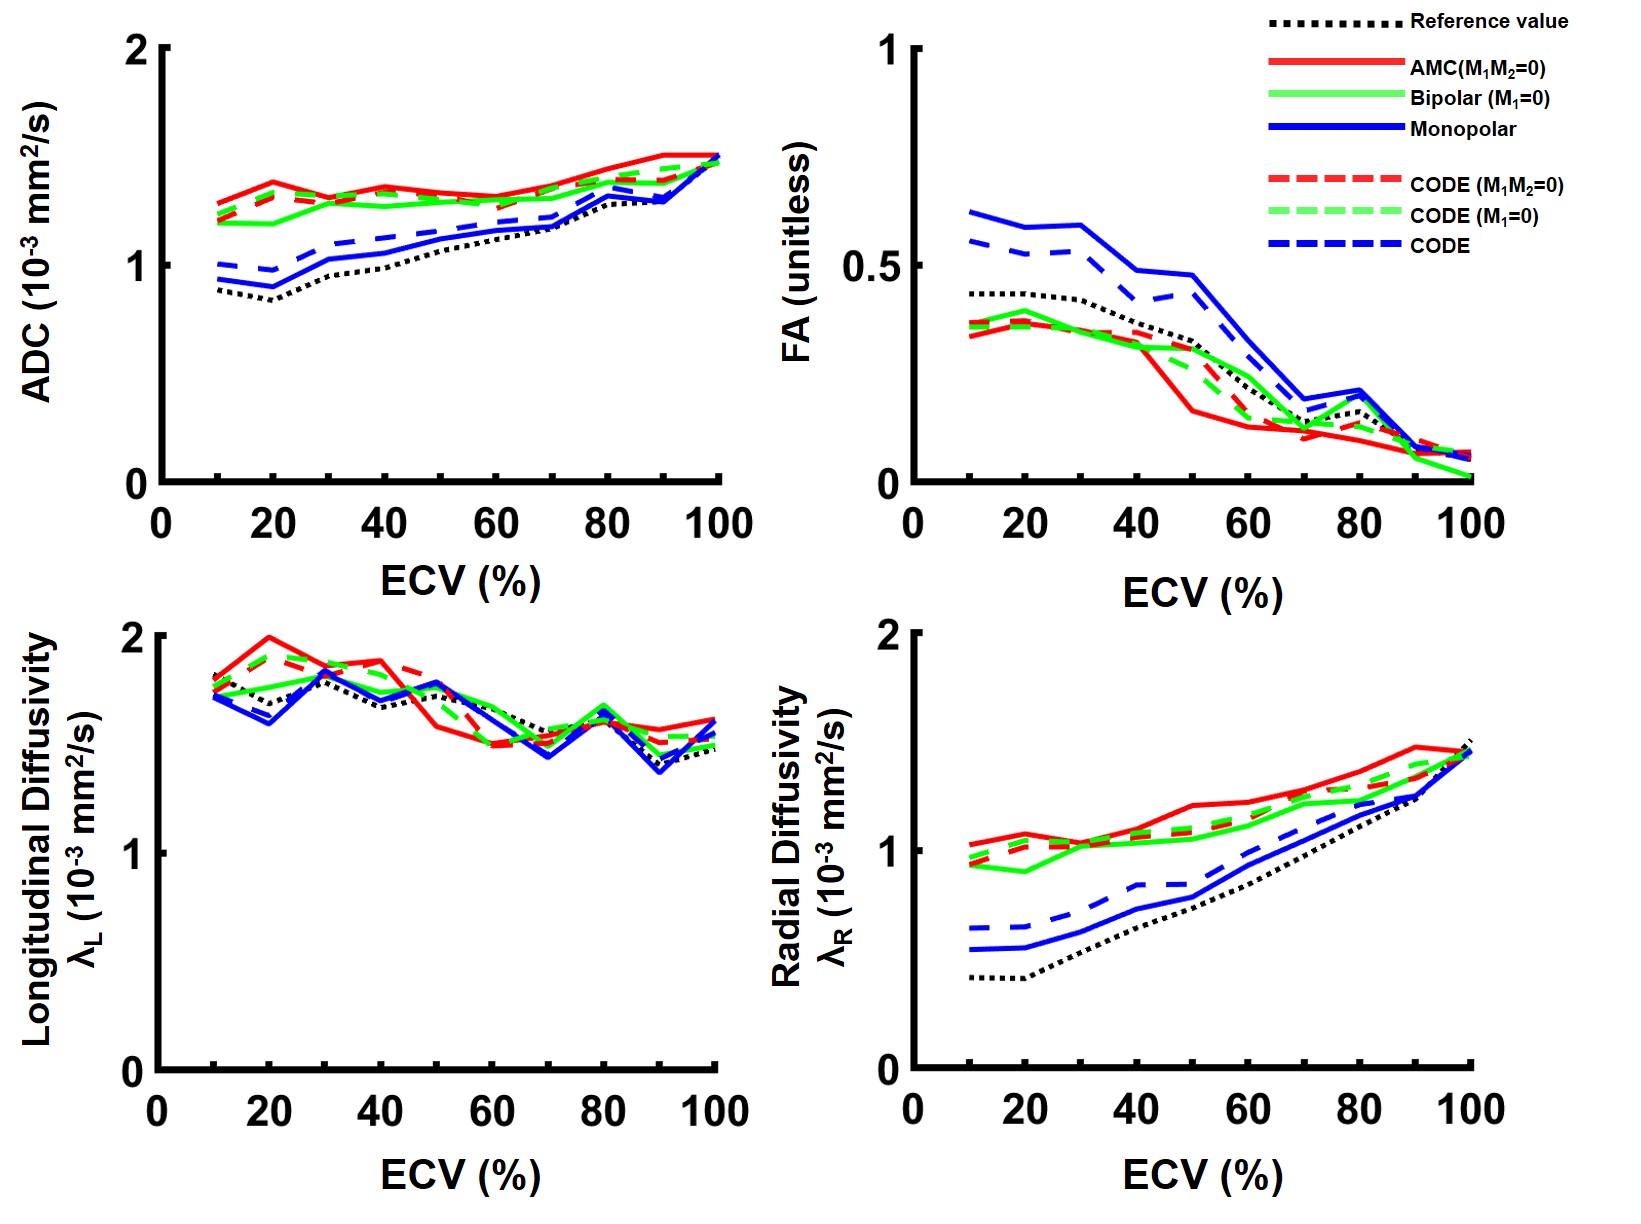
An example of the phase distribution obtained for the six waveforms is given in Figure 3 for an ECV of 30%. The same displacement distribution and same b-value were used, but different phase distributions were obtained, which demonstrates waveform dependence.Figure 4 shows the ADC, FA, λL, and, λR measured as a function of ECV. By increasing the ECV, the space between cells increases, leading to an overall ADC and λR increase. In contrast, the longitudinal diffusivity decreases slightly as the ECV increases. The FA decreases as the overall ratio of λL to λR decreases. For a typical ECV of 20%, across all diffusion encoding waveforms, ADC was 1.2 ± 0.2 x 10⁻³mm2/s, λL was 1.8 ± 0.02 x 10⁻³mm2/s and λR was 0.9 ± 0.2 x 10⁻³mm2/s. For a pathologic ECV of 50% that may be observed in acute or chronic myocardial infarction, ADC was 1.3 ± 0.1 x 10⁻³mm2/s, λL was 1.7 ± 0.01 x 10⁻³mm2/s and λR was 1.0 ± 0.01 x 10⁻³mm2/s. FA changed from 0.43±0.1 to 0.33±0.11 from normal to pathologic ECV. FA represents the most sensitive metric to ECV change with a rate of change of -0.05 point per 10% ∆ECV compared to 0.0023, -0.0021 and 0.0046 x 10⁻³mm2/s per 10% ∆ECV for ADC, λL and λR respectively.
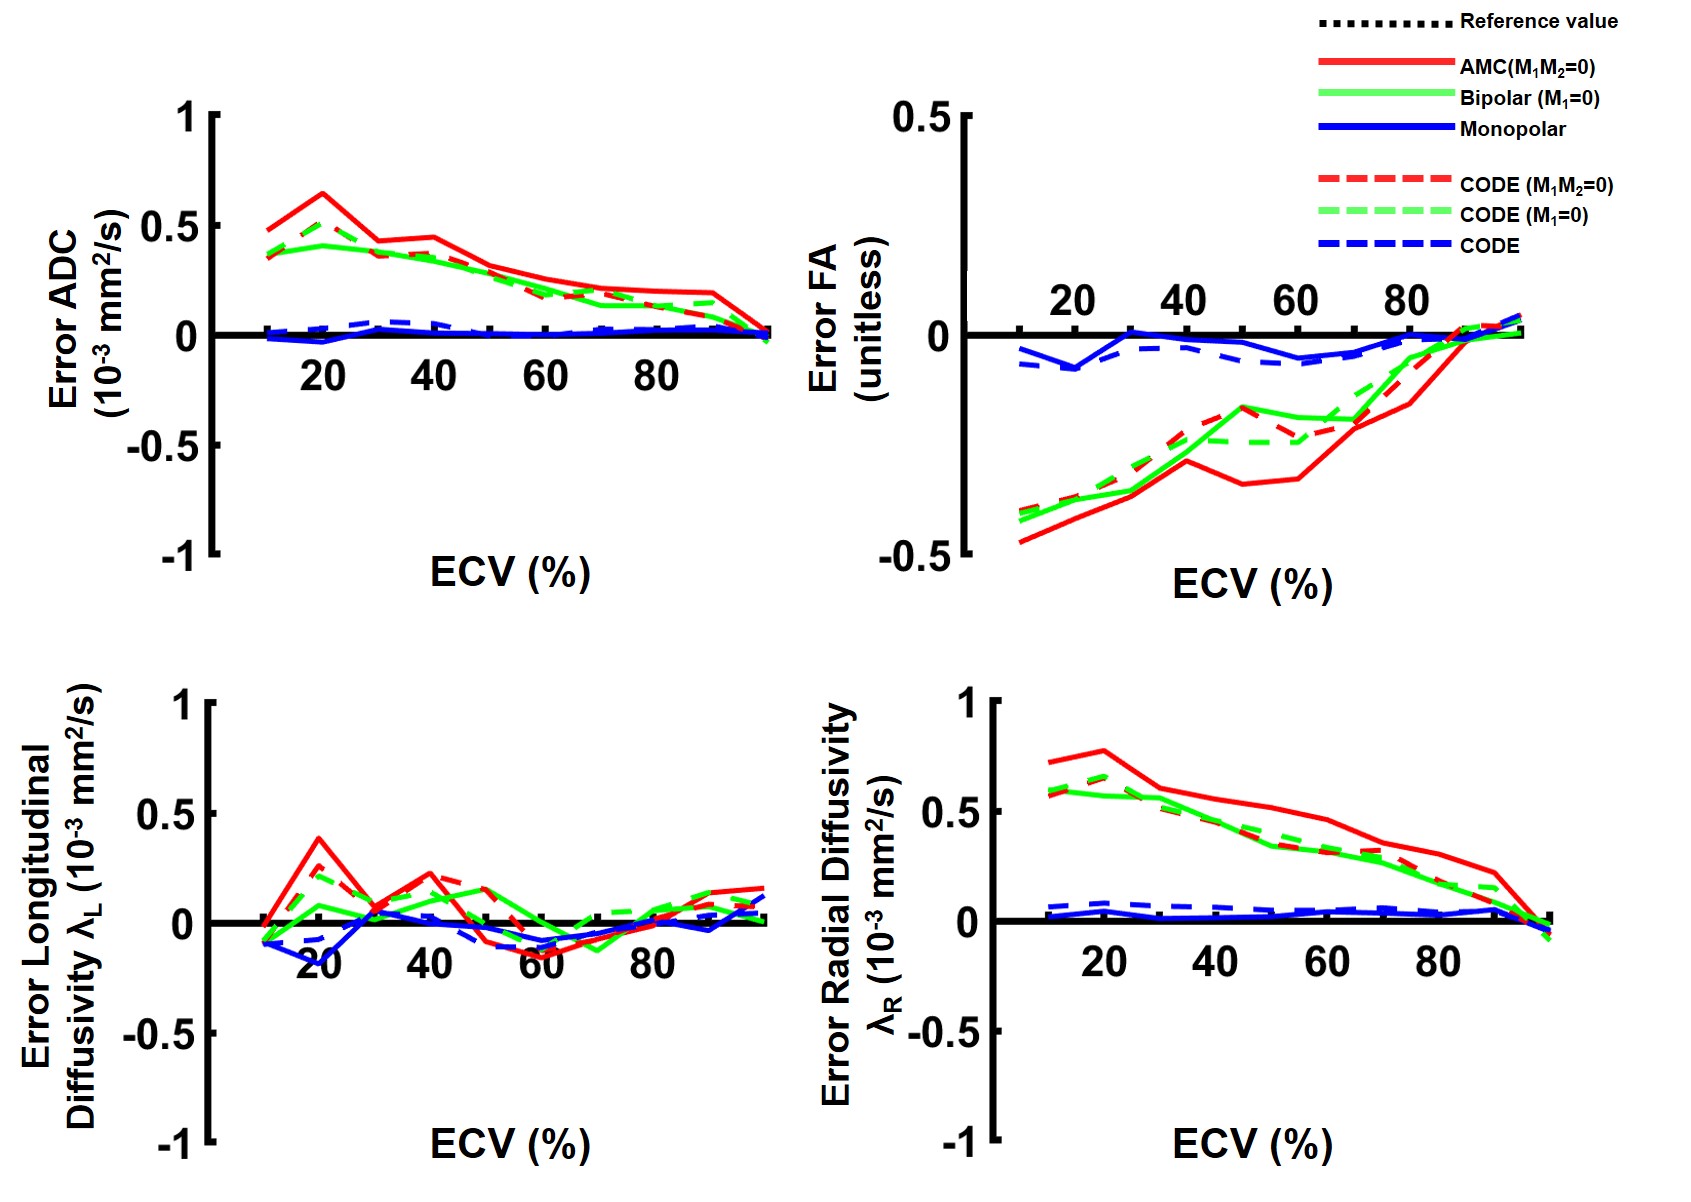
Finally, as shown in Figure 5, the motion compensated waveforms induce a bias in the diffusion measurement. M1 and M1+M2 motion compensated gradient waveforms overestimate ADC and radial diffusivity, which corresponds to an underestimation of the FA. Both Monopolar and CODE provided the best estimate of diffusivity and FA.
Discussion and conclusion
In this simplified simulation framework, we showed that motion compensation diffusion encoding gradient waveforms underestimate FA and overestimate diffusivity while non-compensated gradient waveforms provided the best estimate of diffusivity and FA. Furthermore, pathologic changes in ECV are expected to be reflected more strongly in estimates of FA than other parameters.Acknowledgements
This project was supported, in part, by NIH R01 HL131823 to DBE.References
(1) Hinderer et al. Advanced Drug Delivery Reviews 2019
(2) Haff et al. JCMR 2016
(3) Stoeck et al. MRM 2015
(4) Aliotta et al. MRM 2016
(5) Berry et al. MRM 2018
(6) Basser et al. Journal of Magnetic Resonance 1994
Figures