2047
AI-driven Multi-Feature based Blood Hematocrit Prediction for Myocardial Extracellular Volume Quantification1Department of Radiology and Research Institute of Radiological Science, Severance Hospital, Yonsei University College of Medicine, Seoul, Korea, Republic of, 2Department of Radiology and Research Institute of Radiological Science, Gangnam Severance Hospital, Yonsei University College of Medicine, Seoul, Korea, Republic of
Synopsis
Blood hematocrit is needed for myocardial ECV. To determine the hematocrit, blood sampling is the standard way, but it is invasive and time-consuming. To avoid the inconvenience of blood sampling, synthetic derivation of hematocrit was suggested in recent studies. In here, we derived the Hct using three prediction methods with multi-features of patient. Investigated methods include the linear regression and AI apporaches. We hypothesized that AI driven multi-feature based synthetic Hct would be more precise than the linear regression. The results of synthetic methods were compared with the laboratory Hct (Lab-Hct) and conventional ECV (Conv-ECV) as the reference.
Purpose
Myocardial extracellular volume (ECV) allows a quantitative analysis of diffuse myocardial fibrosis. For the myocardial ECV quantification, pre- and post-contrast T1 map and blood hematocrit (Hct) are needed. To determine the Hct, blood sampling is the standard way, but it is invasive and time-consuming process. To avoid the inconvenience of blood sampling, recent studies suggest the synthetic derivation of Hct using linear relationship with blood T1[1-3].In this study, we derived the blood Hct from three prediction methods and evaluated the synthetic ECV (Syn-ECV) which was generated from the predicted Hct. Investigated prediction methods include the linear regression, machine learning (ML) regression, and deep learning (DL) regression. We hypothesized that artificial intelligence (AI) driven multi-feature based synthetic Hct and ECV would be more precise than the linear regression method. The results of synthetic methods were compared with the laboratory Hct (Lab-Hct) and conventional ECV (Conv-ECV) as the reference.
Material and Method
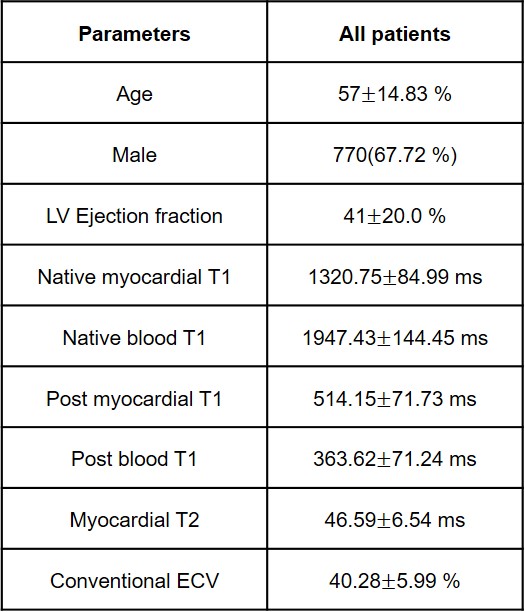
The CMR data of 1642 patients which collected between February 2014 and July 2019 was used retrospectively. The dataset was acquired from the 1642 patients at 3.0 T MRI system (TrioTim, Siemens) and includes pre- and post-contrast T1 map. Incomplete dataset which has abnormal ranged values were excluded from the list and final cohorts included 1137 subjects. For T1 mapping, a modified look-locker inversion recovery (MOLLI) 5(3)3 sequence was used. Lab-Hct was conventionally measured among the entire subjects. The characteristics and Lab-Hct are summarized in Table 1. Pre- and post-T1 of blood and myocardial tissue were manually measured in ROI. Conv-ECV was calculated using Lab-Hct and measured pre- and post-T1 as Eq. 1.ECV=(1-hematocrit)·[{(1/T1myo-post)-(1/T1myo-pre)}/{(1/T1blood-post)-(1/T1blood-pre)}] [Eq.1]
The cohort was randomly divided into two sub-groups for derivation (about 837 subjects) and validation (about 300 subjects). For linear regression estimation of our dataset, Equation 2 was newly derived from the derivation group because the proposed formula in [1] was set using blood T1 of 1.5 T system and needs a local calibration.
Linear Synthetic Hct=90.212×(1/T1blood-pre)-6.3558 [Eq.2]
Syn-Hct of the validation group was calculated only using the non-contrast blood pool T1 values as described previously.
For the AI-driven Syn-Hct, multivariate regression models were made by support vector machine (SVM) and convolution neural network (CNN). Both models used blood pool T1 and multi features (listed in Table 1 except post T1) of subject as well. SVM method was implemented in MATLAB 2018 environment. CNN code was written in python language using the PyCharm tool. Using Keras neural networks library, CNN model was designed to have 2 hidden layers. We adopted Relu/linear as activation kernels and mean squared error as a loss function. SVM and CNN models were built using the derivation group and the models predicts the Hct of the validation group in the same way as the linear prediction.
Syn-ECV was calculated using Syn-Hct and was compared with conventionally derived ECV. The R-square correlation and MSE were compared between laboratory and synthetic Hct. The R-square correlation and Bland-Altman analysis are performed for ECV derivation results.
Results
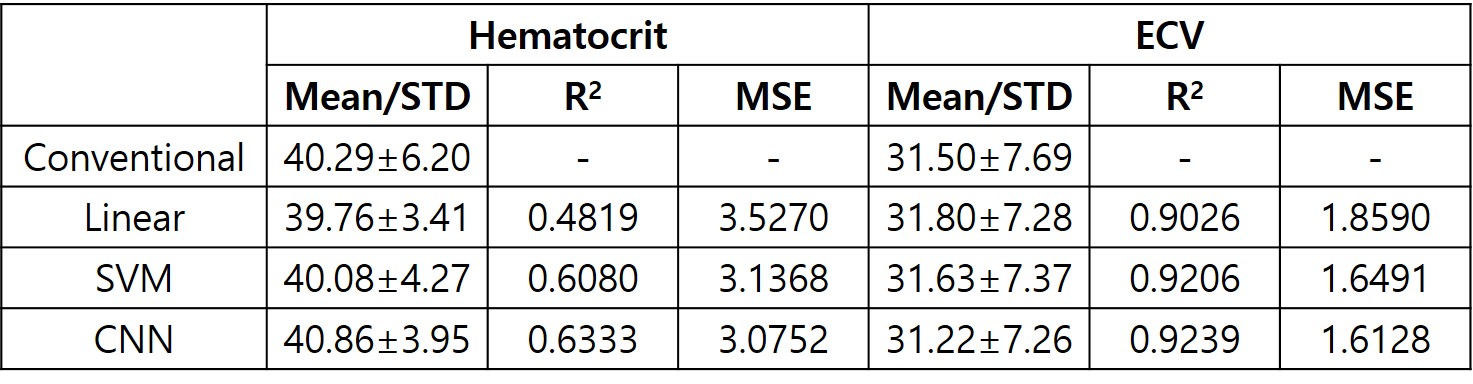
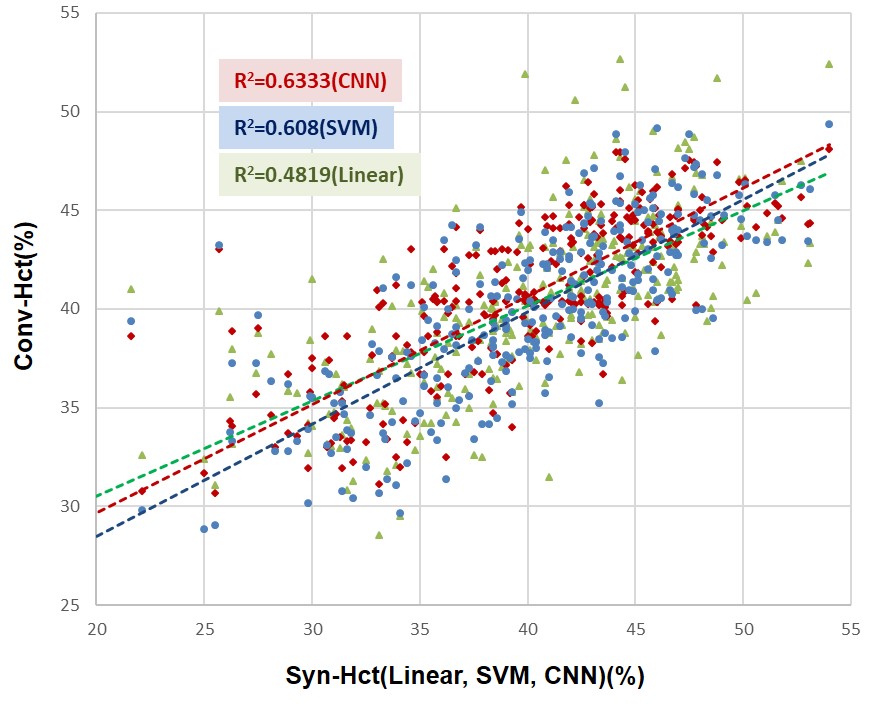
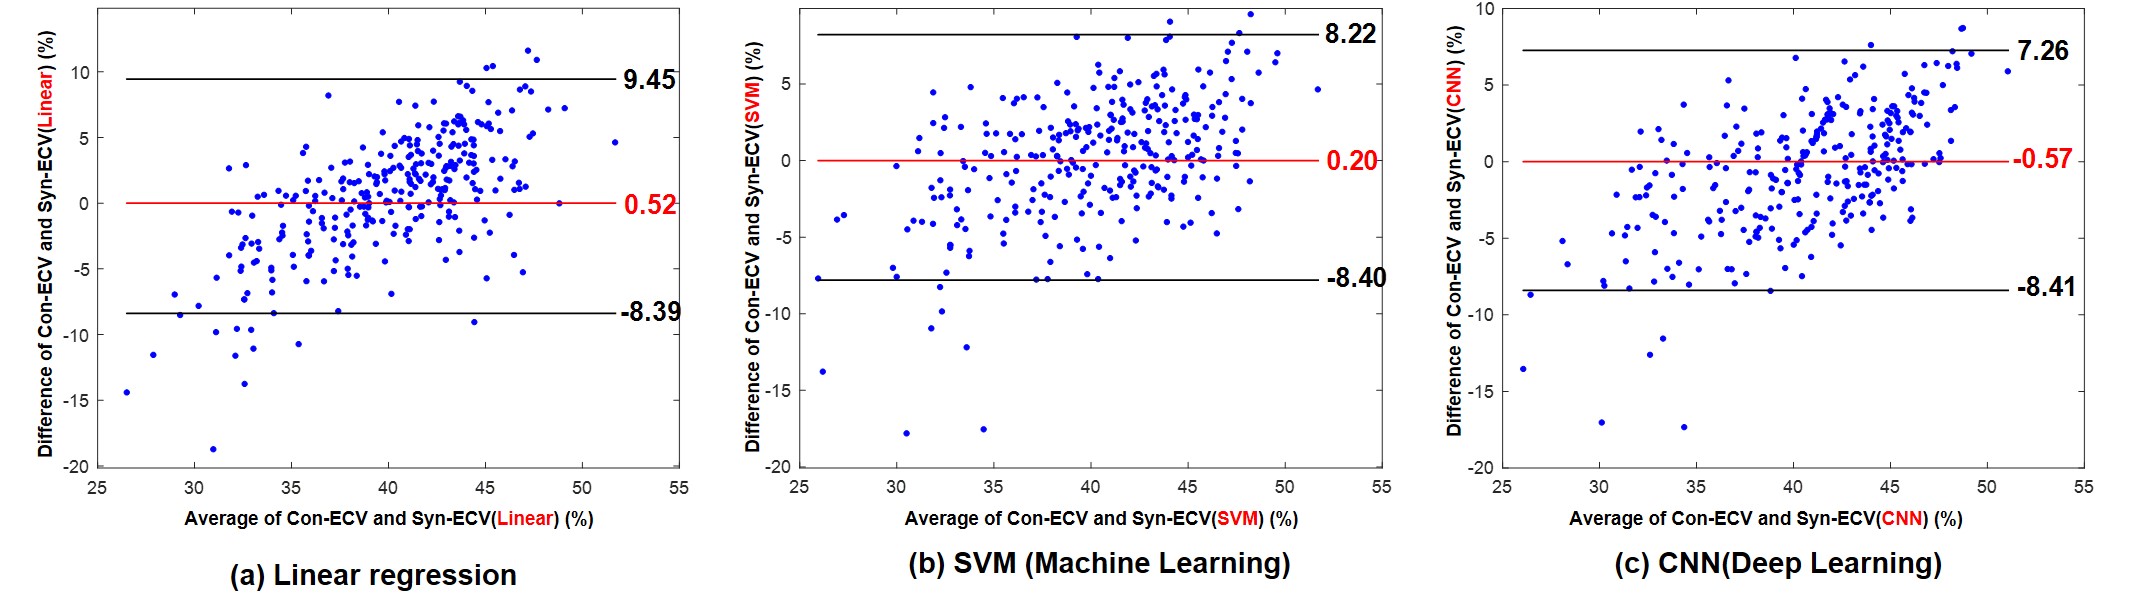
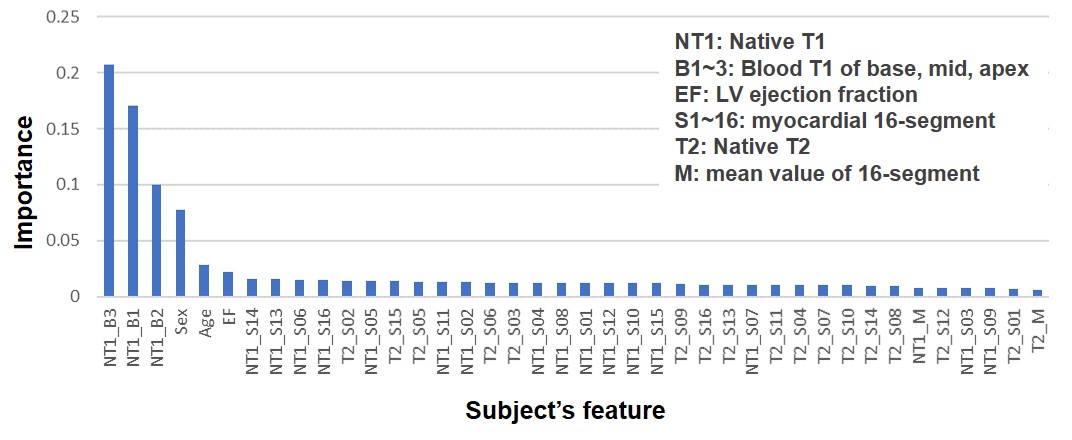
Syn-Hct was derived from blood pool T1 values and subject’s characteristics in the validation group. Scatter plot in Fig. 1 shows estimated Hct from three methods and their correlation to the laboratory Hct. The Syn-Hct was similar to the Lab-Hct. Statistical results including R2, MSE of Syn-Hct and Syn-ECV are summarized in Table 2. In comparison of correlation between regression methods, CNN showed highest correlation (R2=0.63). The correlation of SVM and linear method was R2=0.61 and R2=0.48, respectively. Bland-Altman plots are displayed in Fig. 1. Although, it is shown that mean differences between synthetic and Lab-ECV were slightly big, SVM showed the smallest bias among them. Additionally, importance of training features which were used for Hct prediction is shown in Fig. 3. As expected, native blood T1 was most influential feature. And age, sex and LV-EF were primary components.Discussion and Conclusion
We have demonstrated a feasibility of synthetic Hct using three prediction method and compared Syn-ECV with Conv-ECV. Even though a single center study, all of prediction methods have a high correlation with the result of conventional method. In the comparison of inter-methods, AI driven multi feature approach showed better prediction performance than linear regression. This research needs further investigation about more informative features for the prediction and expandability to the multi-center study.Acknowledgements
This work was supported by the National Research Foundation of Korea(NRF) grant funded by the Korea government(MSIT) (No. 2016R1C1B1013837).
References
1. Treibel, T.A., et al., Automatic measurement of the myocardial interstitium: synthetic extracellular volume quantification without hematocrit sampling. JACC: Cardiovascular Imaging, 2016. 9(1): p. 54-63.
2. Robison, S., et al., Noninvasive hematocrit assessment for cardiovascular magnetic resonance extracellular volume quantification using a point-of-care device and synthetic derivation. Journal of Cardiovascular Magnetic Resonance, 2018. 20(1): p. 19.
3. Kammerlander, A.A., et al., Extracellular volume quantification by cardiac magnetic resonance imaging without hematocrit sampling. Wiener klinische Wochenschrift, 2018. 130(5-6): p. 190-196.
Figures