2044
Early Brain Structural Development in Non-human Primate, Common Marmoset: A Longitudinal MRI study
Akiko Uematsu1,2, Junichi Hata2, Makoto Fukushima2, Noriyuki Kishi2, Ayako Murayama2, Shinsuke Koike3, and Hideyuki Okano2,4
1Graduate School of Arts and Sciences, University of Tokyo, Tokyo, Japan, 2RIKEN CBS, Wako, Japan, 3Center for Evolutionary Cognitive Science, University of Tokyo, Tokyo, Japan, 4Keio University School of Medicine, Tokyo, Japan
1Graduate School of Arts and Sciences, University of Tokyo, Tokyo, Japan, 2RIKEN CBS, Wako, Japan, 3Center for Evolutionary Cognitive Science, University of Tokyo, Tokyo, Japan, 4Keio University School of Medicine, Tokyo, Japan
Synopsis
We delineated gray and white matter growth pattern of non-human primate from infancy to childhood in comprehensive manner with longitudinal T1w. T2w, and DWI data. Integrating the analysis of these different contrast images provided a variety of information, showing robust but regionally heterogeneous growth pattern. Such information suggested the components that contribute to structural maturation might be different among regions.
INTRODUCTION
Proper brain development at early life stage is crucial for well-functioning in cognition and behavior of later life stages. As many of previous studies of brain development in both humans and animals demonstrated, the developmental trajectories are steep at very early postnatal period and draw a gentle curve or get stabilized as get older. Nevertheless, in actual fact the data of living brain at early life stage is quite limited due to technical and ethical issues. Thus, it has been still veiled what to happen in brain in this period, compared to other life stages. In our current study, benefitting from its early maturity and prolificacy, we examined the brain development of a non-human primate, common marmoset (Callithrix jacchus), by collecting longitudinal data from very early life stage. We acquired longitudinal multi-contrast structural MRI data during the first half year of life, which relative to human's first 2 years of life for the purpose of unveiling the brain developmental patterns at early life stage.METHODS
This study was approved by the Experimental Animal Committee of RIKEN and conducted in accordance with its guidelines.A total of 75 developmental time points (Figure 1) of normally developing 13 marmosets’ brain data were acquired on 9.4T Biospec 94/30 (Bruker BioSpin: Germany). The structural MRI data included T1-, T2-, and diffusion-weighted data, which acquired with the following parameters: T2-weighted (T2w); relaxation enhancement sequence with TR/TE = 4000 ms/11.0 ms, FOV= 48 mm × 48 mm, matrix =178 × 178, slice thickness = 0.54 mm, flip angle (FA) = 90°, number of average (NA) = 3. T1-weithed (T1w); TR/TE = 6000 ms/2.0 ms, FOV = 32 mm × 48 mm x 23 mm, matrix =142 × 178 × 42, slice thickness = 0.54 mm, flip angle = 12°, NA=3. Diffusion-weighted (DWI); a multi-shot (four shots) echo planar imaging sequence with the following parameters: TR/TE = 3000 ms/25.57 ms, FOV= 45 mm × 45 mm, matrix = 128 × 128, slice thickness = 0.7 mm, flip angle =90°, NA= 3, δ = 6 ms, Δ = 12 ms, 30 diffusion directions at b = 1000 s/mm2 with two b = 0 s/mm2 and two opposing phase encoding b = 0 s/mm2.
Applying a part of HCP pipeline1 for non-human primate, longitudinal cortical thickness pipeline2, and label fusion algorithm3, for T1w and T2w and MRtrix3 pipeline4 for DWI as (pre)process, we delineated both gray and white matter developmental changes by estimating regional volumes5, cortical surface, cortical thickness, T1w/T2w ratio map, diffusion tensor image (DTI) metrics, and fixel-based analysis6.
RESULTS AND DISCUSSION
Figure 2 shows the age-related contrast changes of T1w, T2w, and DTI metrics contrast in one sample. Robust morphometry and contrast changes during first half year of life in common marmosets although 6-month-old brain is not yet reached to the adult brain. The contrast of figures also depicted the sequence of maturation process. Like human beings and other primates, it first develops from center to posterior and then anterior regions of brain.The age-specific averaged surface-mapped cortical thickness, T1w/T2w ratio map, and regional parcellation maps, which are some of the derivatives from image processing, also supported this process (Figure 3). As is shown, cortical thickness got thinner expandedly across regions from central to caudal/temporal, and then to rostral regions by ages. Especially the period between 1 and 2 months old was the most robust. Whereas, T1w/T2w ratio map, which might not purely represent cortical myelin as human adult data, depicted that the growth starts from caudal regions to dorsal-rostral and temporal regions. Although it could be technical issue, unlike cortical thickness, the developmental changes of the T1w/T2w ratio map showed dynamic across regions rather than constant. Thus, cortical thinning or thickening is not necessarily result from axonal, dendric, synaptic development.
Cortical thinning might get occurred partially due to adjacent white matter fiber increment as evidence of findings in Fixed-based analysis (Figure 4). When comparing Fiber cross-section at the age of 1 month and 6 months, multiple regions were significantly increased as developed, suggesting the increasing diameter of bundle or/and the number of axons, especially in fiber bundles passing through brain stem, cerebellum, and caudate. On the other hand, fiber bundles passing through mediodorsal thalamus and frontal cortex has significantly higher value of apparent fiber density, suggesting increasing fiber density due to myelination, at the age of 6 months.
CONCLUSION
To summarize, our study delineated gray and white matter growth pattern of non-human primate from infancy to childhood in comprehensive manner with longitudinal T1w. T2w, and DWI data. Our data showed that the cortical regions grew first in motor-related regions, then moved onto caudal and temporal regions, and finally rostral regions. The difference of contributing factors on growth among regions may cause such heterogeneity of regional brain growth patterns.Acknowledgements
This research is partially supported by the program for Brain Mapping by Integrated Neurotechnologies for Disease Studies (Brain/MINDS) from Japan Agency for Medical Research and development, AMED.References
- Glasser MF, Van Essen DC. Mapping Human Cortical Areas In Vivo Based on Myelin Content as Revealed by T1- and T2-Weighted MRI. J Neurosci. 2011;31(32):11597-11616. doi:10.1523/JNEUROSCI.2180-11.2011.
- Tustison NJ, Holbrook AJ, Avants BB, et al. The ANTs Longitudinal Cortical Thickness Pipeline. bioRxiv. 2018:170209. doi:10.1101/17020.
- Wang, H., Suh, J. W., Das, S. R., Pluta, J. B., Craige, C., & Yushkevich, P. A. (2012). Multi-atlas segmentation with joint label fusion. IEEE transactions on pattern analysis and machine intelligence, 35(3), 611-623.
- Tournier, J. D., Smith, R., Raffelt, D., Tabbara, R., Dhollander, T., Pietsch, M., ... & Connelly, A. (2019). MRtrix3: A fast, flexible and open software framework for medical image processing and visualisation. NeuroImage, 116137.
- Hashikawa T, Nakatomi R, Iriki A. Current models of the marmoset brain. Neurosci Res. 2015;93:116-127. doi:10.1016/j.neures.2015.01.009.
- Raffelt DA, Tournier JD, Smith RE, et al. Investigating white matter fibre density and morphology using fixel-based analysis. Neuroimage. 2017;144:58-73. doi:10.1016/j.neuroimage.2016.09.029.
Figures
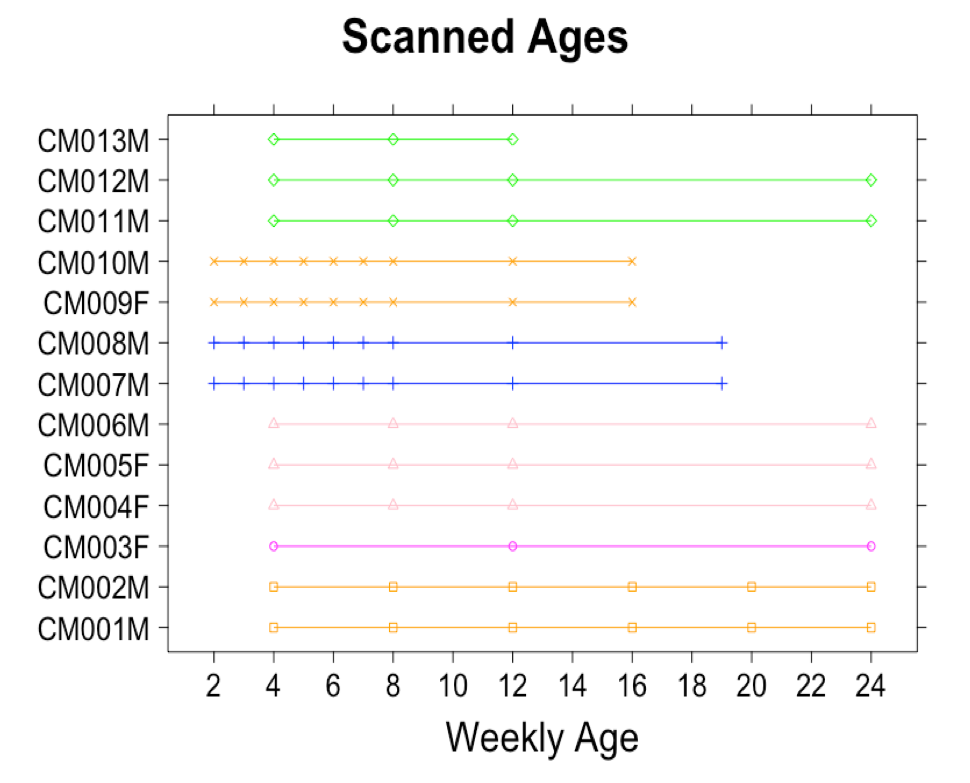
Figure 1. Plots of Scanned Ages
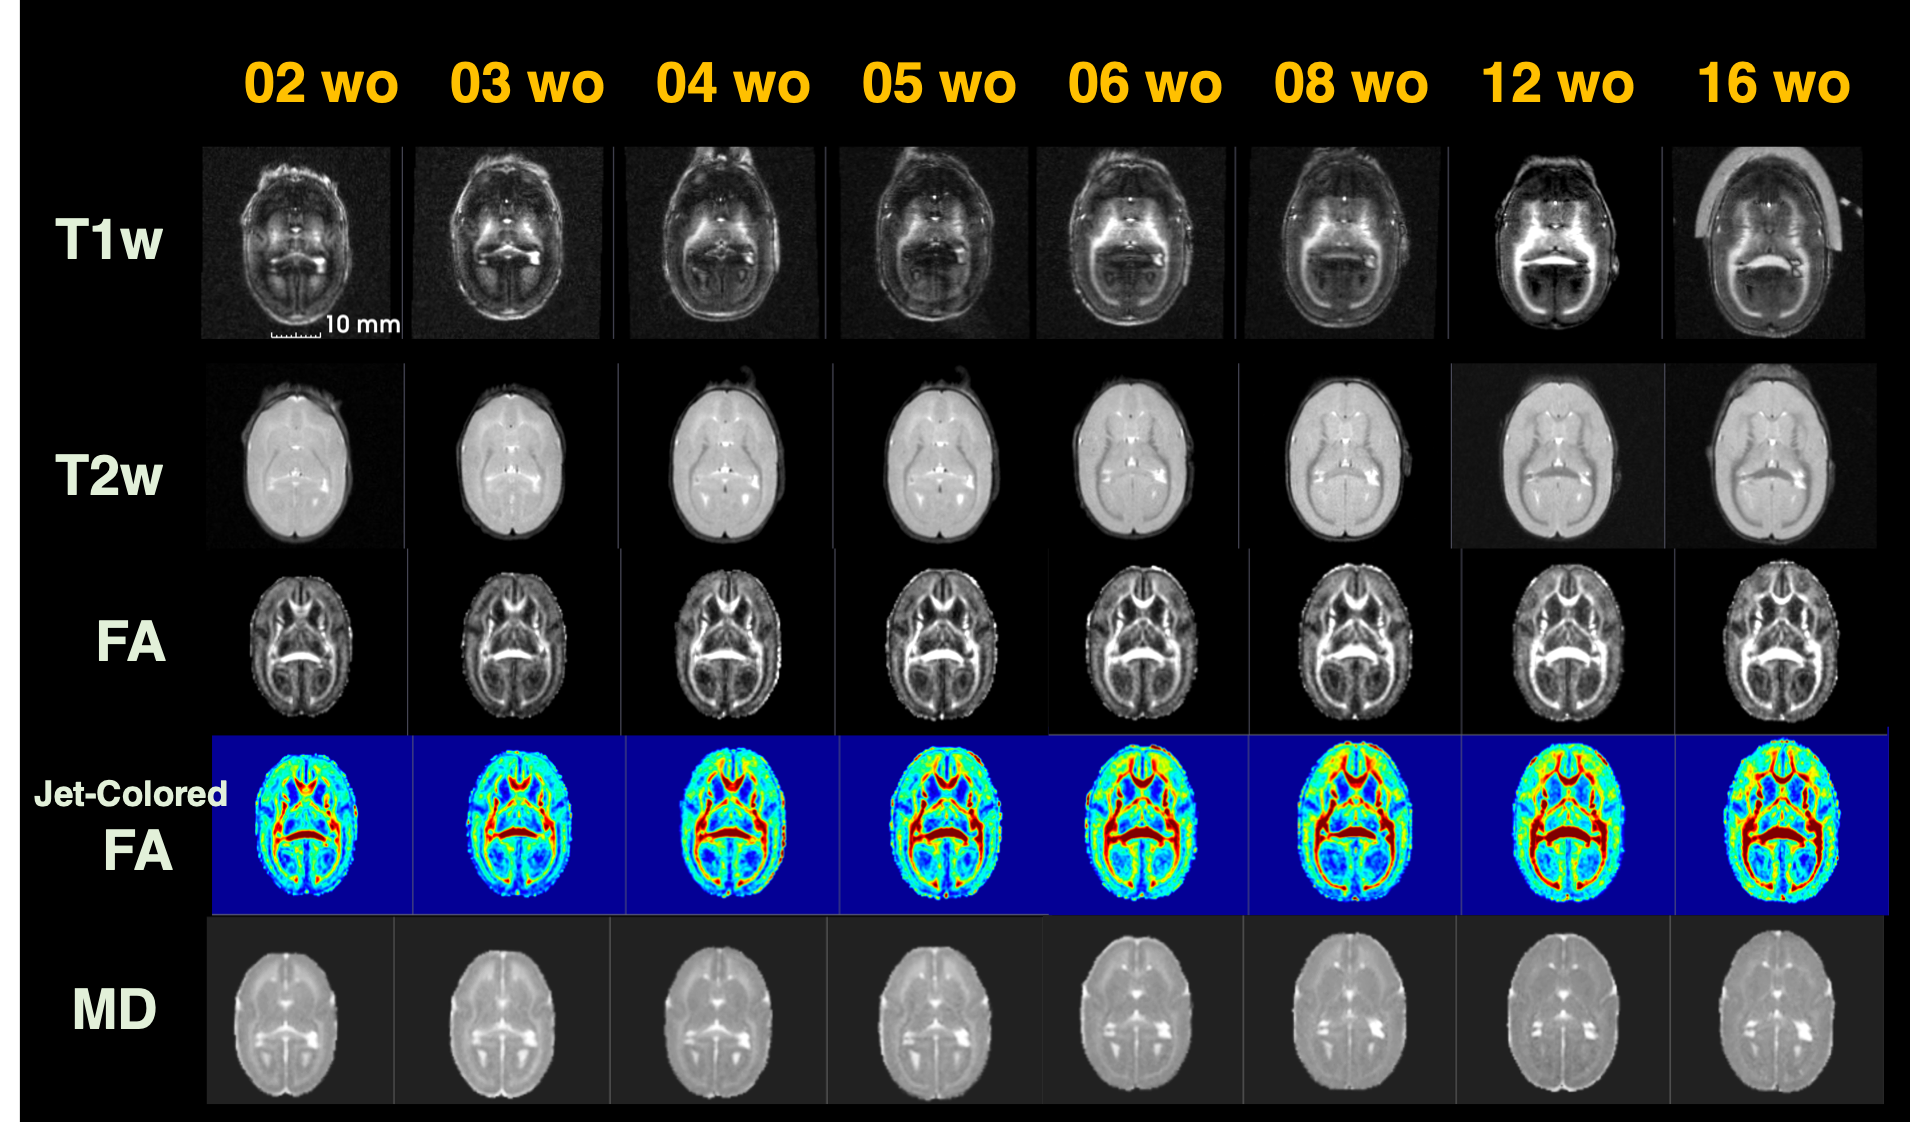
Figure 2: Developmental contrast changes of T1w, T2w, FA, and MD images of a sample
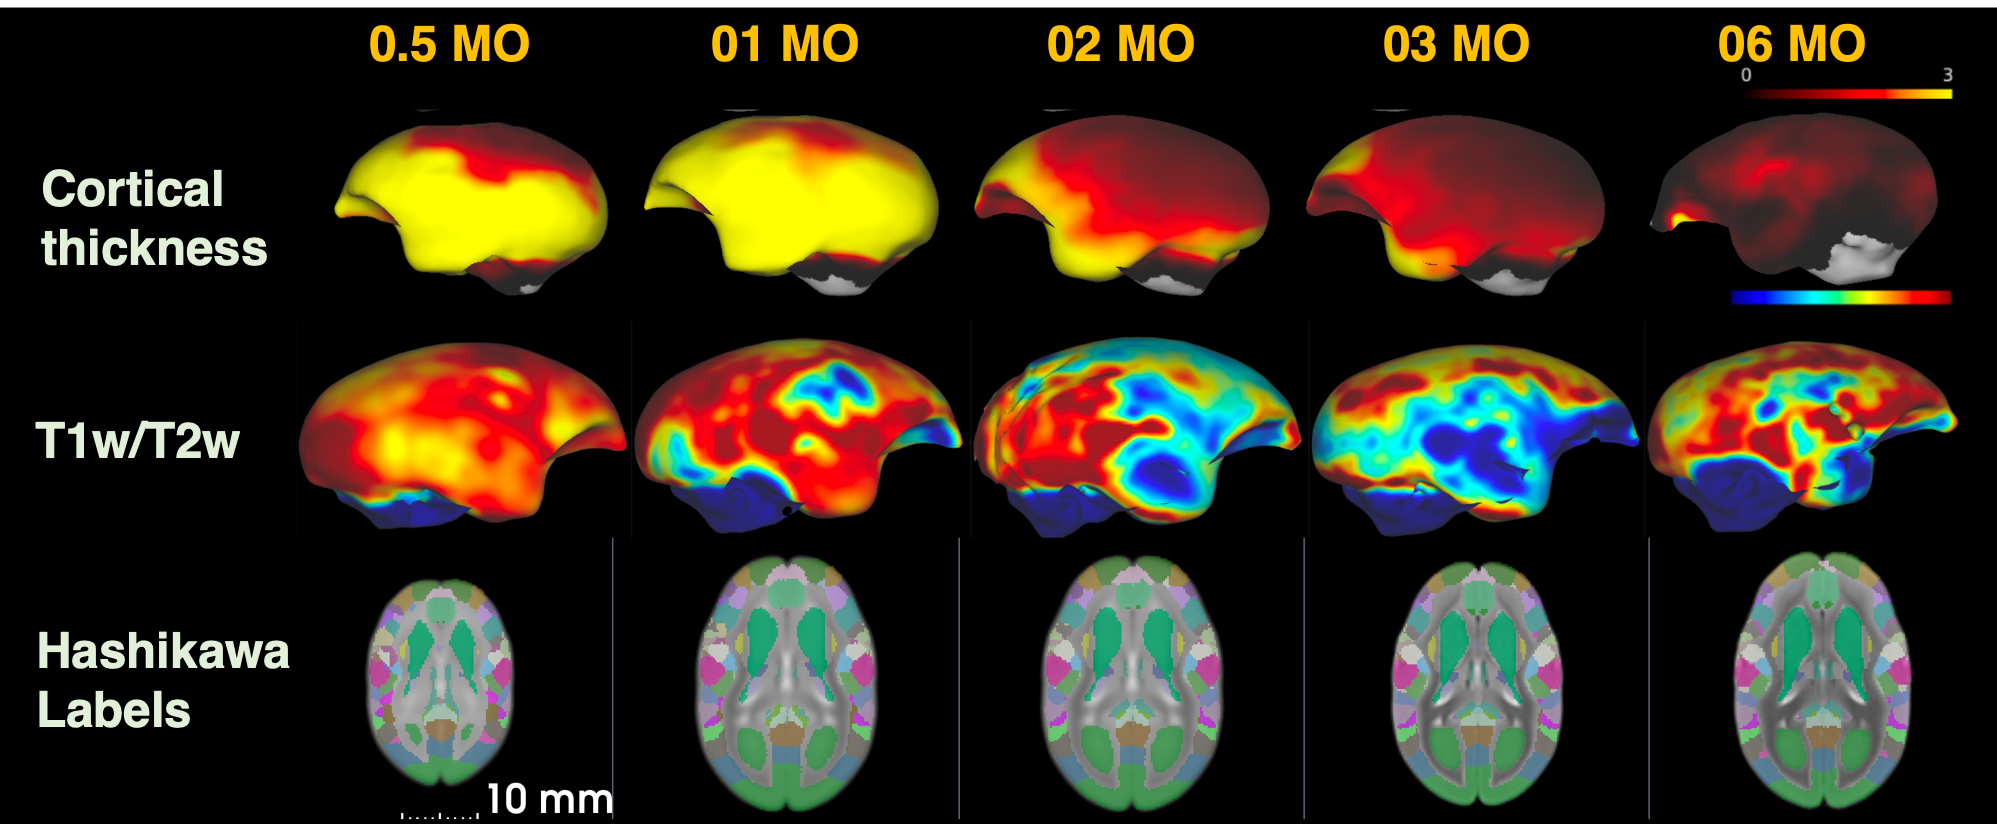
Figure 3. Age-specific averaged surface-mapped cortical thickness, T1w/T2w ratio map, and Hashikawa marmoset labels
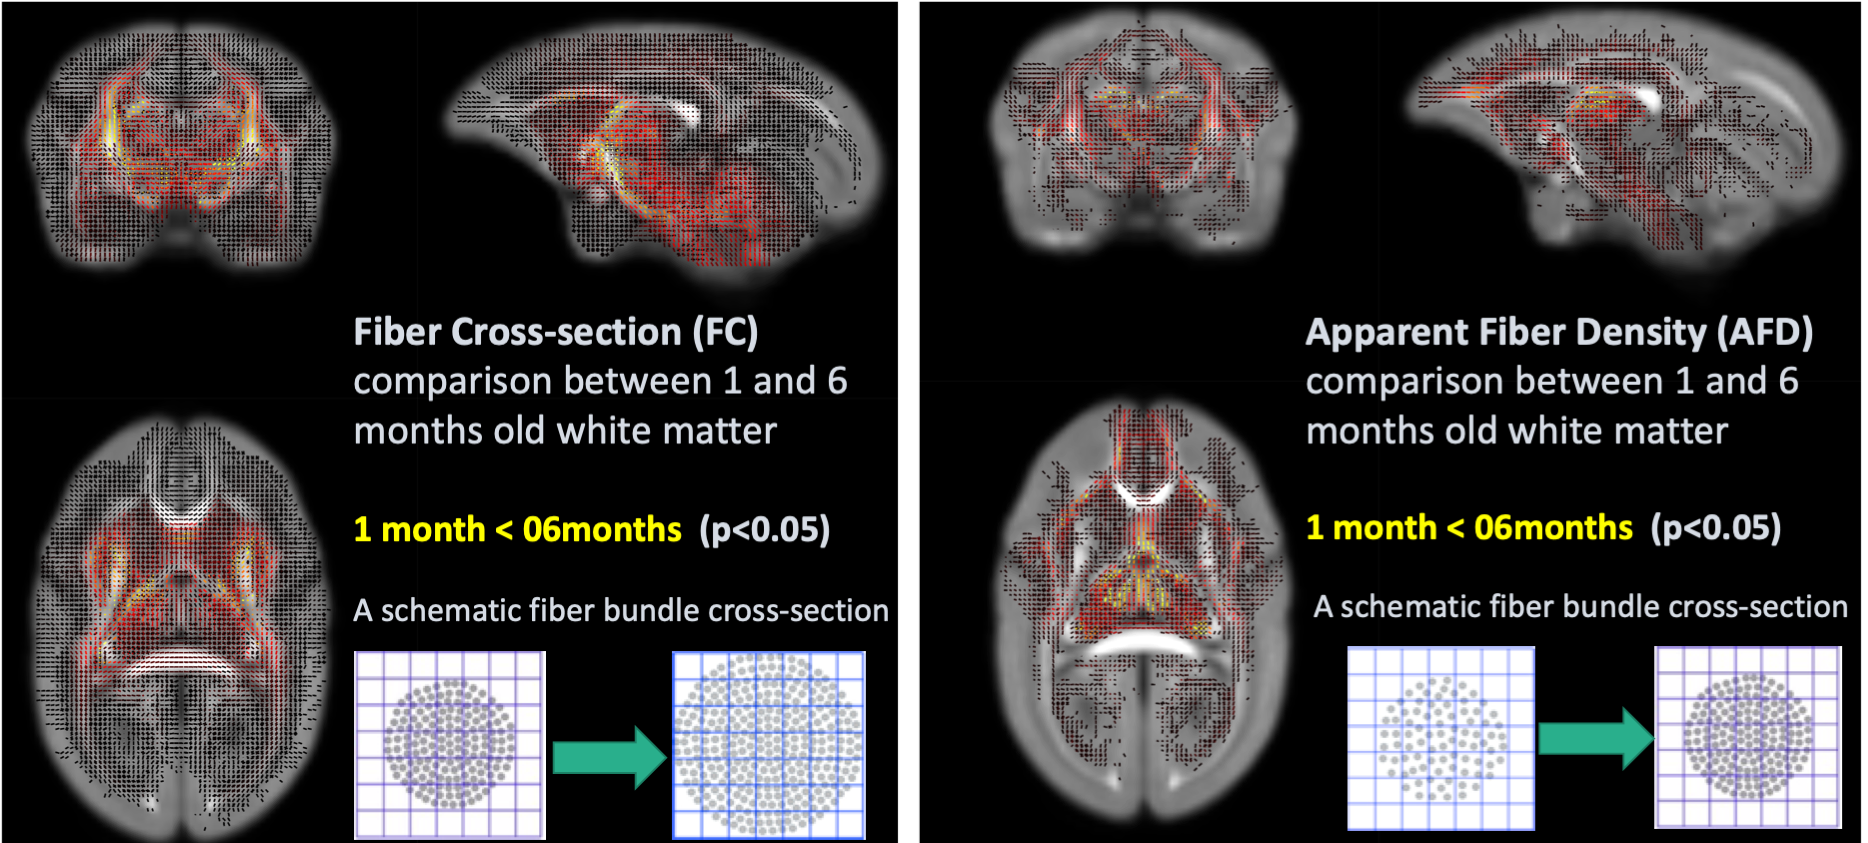
Figure 4. Fixel-Based Analysis between
infant ( 2 weeks old) and preadolescent ( 6 months old) marmoset brain.
The results suggested that weighted components ( e.g. increasing number
of fiber or progressing myelination) of white matter integrity differ among brain
regions