2043
NAD+/NADH dysregulation and brain homeostasis in the gclm-KO mouse: towards biomarker identification for schizophrenia.1Center for psychiatric neurosciences, Lausanne University Hospital (CHUV), Prilly-Lausanne, Switzerland, 2Center for Biomedical Imaging (CIBM), Ecole Polytechnique Fédérale de Lausanne (EPFL), Lausanne, Switzerland
Synopsis
Nicotinamide adenine dinucleotide is a key player of cell metabolism. Previously we demonstrated the feasibility of in vivo NAD measurement, by 31P-MRS, in mouse brain. Actually we established the profile of cerebral NAD+, NADH and NAD+/NADH in a mouse model relevant for schizophrenia and we followed the metabolites regulation during the development by a combination of 1H-31P-MRS. We highlighted redox dysregulation associated with glutathione deficit, from 20 to 250 days old animals. This study provides prospective for understanding the molecular mechanism affecting brain development and regulation together with identification of potential therapeutic biomarker relevant for the pathophysiology of schizophrenia.
Introduction
Schizophrenia (SZ) is a neurodevelopmental syndrome involving both genetic and environmental factors. The reciprocal interaction between oxidative stress and NMDAR hypofunction leading to impairment of inhibitory interneurons and neural synchronization may represent one core pathophysiology.1Nicotinamide Adenine dinucleotide NADH (reduced) and NAD+ (oxidized) are cofactors of energy producing pathways. Their ratio RR (NAD+/NADH) reflects the cellular oxidoreductive state.2 Oxidative stress and redox dysregulation have been suggested in many neurological diseases including Schizophrenia, Parkinson’s and Alzheimer’s as well as aging.3,4 The in vivo measurement of redox state and NAD contents have been recently reported using 31P-MRS at high magnetic field in cat and human brains.5–8 We also demonstrated the feasibility of such measurement in mouse brain during development.9
To identify biomarkers for early detection of SZ, we investigated in vivo the redox and glutamate (Glu) systems during neurodevelopment in a chronic glutathione (GSH) deficient mouse model (gclm-KO) for schizophrenia.
Method
Animal preparationBoth wildtype and gclm-KO C57Bl6/j mice, 20-250 days old were anesthetized by a mixture of air:O2 and 0.9-1.2% isoflurane. All animal procedures were performed according to the federal guidelines and were approved by the local ethics committee.
MR-Spectroscopy
All 31P-MR experiments were performed on a 14.1T small animal scanner (Agilent Technologies) using a 1H quadrature surface coil and a linearly polarized 31P coil as a transceiver. 31P-MR spectra were acquired using a pulse-acquire sequence (adiabatic half passage, 500µs pulse width, 12kHz spectral width) in combination with 3D-ISIS localization. The following parameters were used: TR=5s, 1600 averages, transmitter offset was set on NAD+. Water suppressed 1H-MR spectra were acquired from a volume of 5.76µL centered in the anterior cingulate cortex using a SPECIAL sequence with echo time of 2.75ms , repetition time of 4s and 240 averages.10 VAPOR water suppression and outer volume suppression were applied prior to SPECIAL localization.11 Unsuppressed water spectra were acquired as an internal reference. Spectral quantification Both 1H and 31P spectra were analyzed using LCModel.12,13 [α-ATP] was used as an internal standard for 31P-MRS quantification. Data with CRLB < 30% were included in the data analysis.
Results
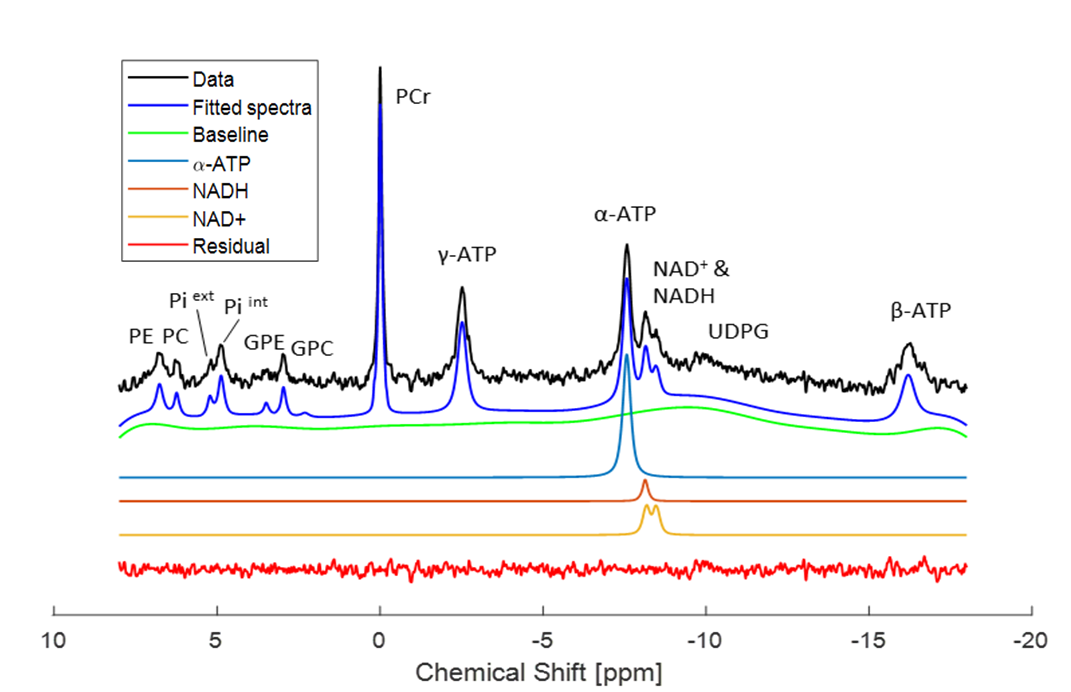
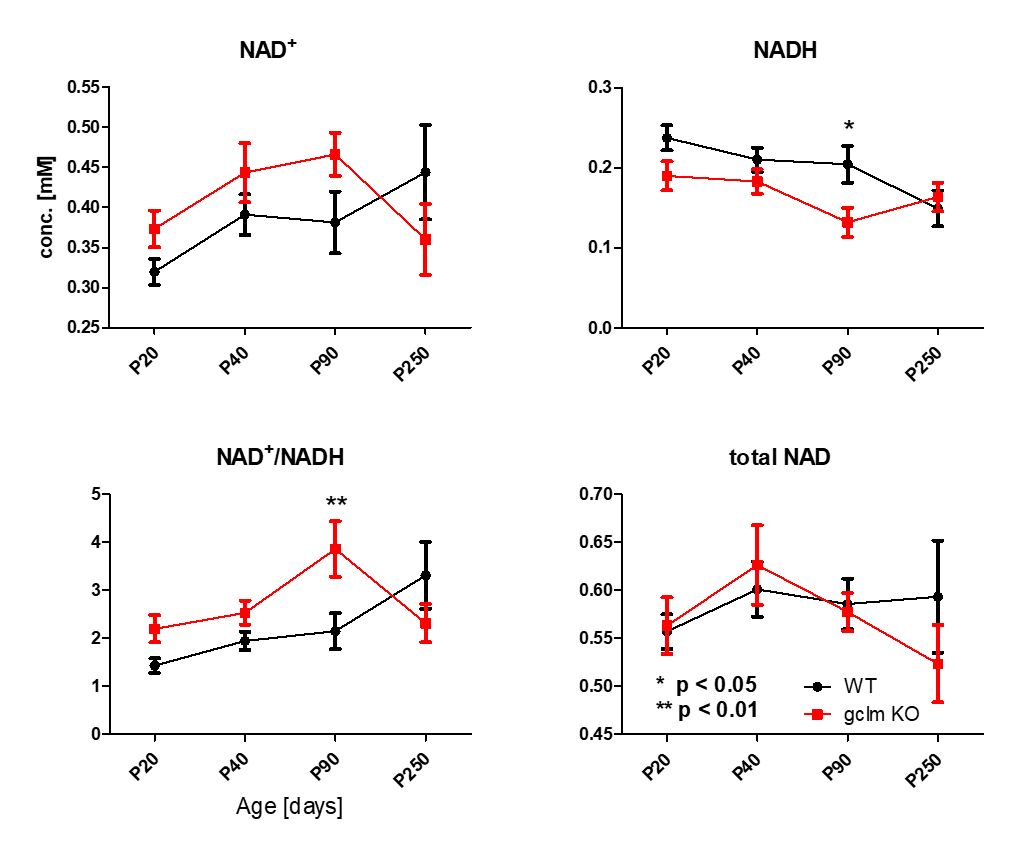
Figure 1 shows a typical in vivo 31P spectrum of the mouse brain. All spectra demonstrated excellent sensitivity and spectral separation at 14.1T, which ensured the reliable quantification of the NAD signals with small fit residuals.Figure 2 shows the difference in concentrations of NAD+, NADH, RR and total-NAD between WT and gclm-KO mouse from P20 to P250. At P90, a significant increase of RR (p<0.01) was observed together with a decrease of [NADH] (p<0.05) in the gclm-KO. An age effect was also seen from P20 to P90 with an increase of [NAD+] (p<0.01) and a decrease of [NADH] (p<0.05). The total amount of NAD remained unchanged.
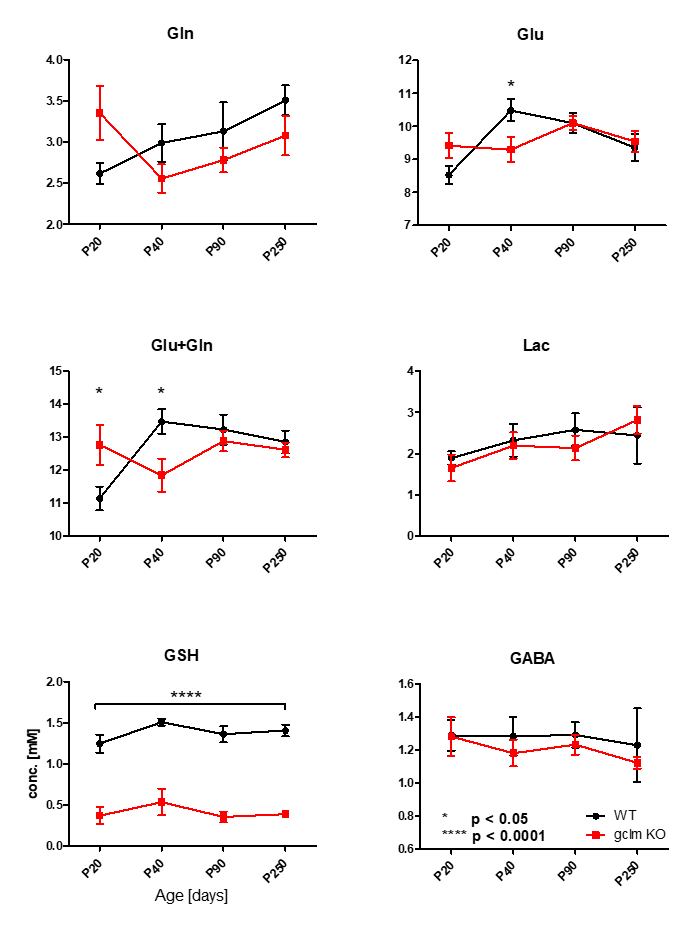
Figure 3 shows metabolite levels measured by 1H-MRS, highlighting the genetically induced decrease of [GSH] (p<0.0001) together with elevated glutamine and glutamate [Gln+Glu] at P20 (p<0.05) and reduced [Glu+Gln] at P40 (p<0.05) in gclm-KO mice. Lactate and GABA remaining stable along neurodevelopment and genotype.
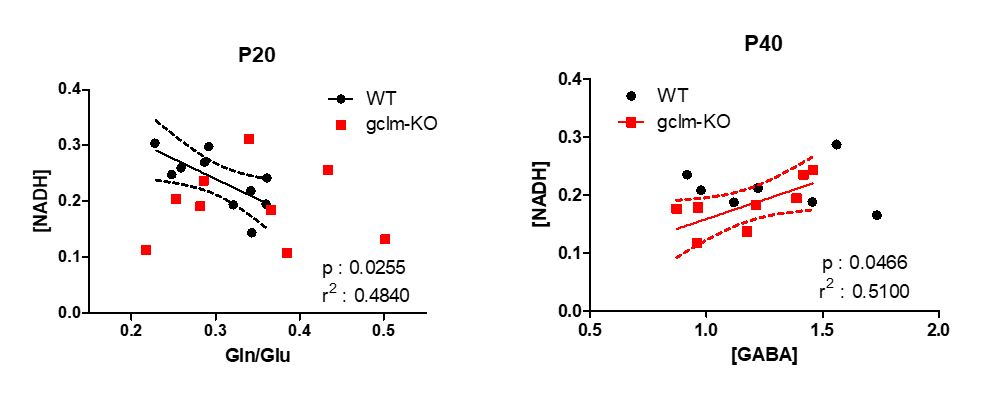
Figure 4 shows the correlation of [NADH] with Gln/Glu in WT at P20 (p=0.0255) which was disrupted in gclm-KO followed by [NADH]-[GABA] correlation at P40 (p=0.0466) which was only present in the gclm-KO.
Discussion and Conclusion
This is the first in vivo study in which NAD dysregulation in a transgenic mouse model could be highlighted together with a window on other metabolites regulation/compensation. The advanced 1H and 31P-MRS strategies with enhanced sensitivity and spectral resolution at 14T allow the investigation of interaction between redox imbalance, due to the lack of glutathione, and brain homeostasis responding to this stress during neurodevelopment.The balanced redox ratio is essential for cellular redox homeostasis and many biological events such as energy metabolism. Increased redox ratio from P20 to P90 in gclm-KO mice suggests a development towards a higher brain oxidative state from childhood to adulthood. This redox ratio shift in KO mice reaches a higher level relative to WT mice in adulthood, which is driven by the elevated NAD+ and the decreased NADH, suggesting a potential compensation to raise the redox ability in KO animals which are susceptible to oxidative stress due to its deficit in GSH. Interestingly, the redox ratio shows a trend to decrease at P250, which is similar as the observation in patients with schizophrenia and implies potential accumulation of deleterious oxidative stress effect at later age.5 Increase of Gln and Glu in young animals followed by a decrease, leading to later NAD dysregulation, together with the abnormal correlation of NADH with different neurotransmitters has been highlighted at different ages during neurodevelopment, suggesting a cascade of events leading to the altered phenotype.
In conclusion, we demonstrated the feasibility of longitudinal measurement of NAD+, NADH and RR in mice brains during development at 14.1T open widely the prospect of studying longitudinally the energy metabolism and redox dysfunction in mouse models of brain pathologies. In addition, for the first time, imbalanced redox state and its potential link with neurotransmitters were revealed in the neurodevelopment of the gclm-KO mice. This provides prospective for understanding the molecular mechanism affecting brain development and regulation which are relevant for the pathophysiology of schizophrenia and the identification of potential therapeutic biomarkers.
Acknowledgements
This study was supported by:
Centre d'Imagerie BioMédicale (CIBM) of the EPFL, UNIL, CHUV, UNIGE, HUG
Centre Hospitalier Universitaire Vaudois (CHUV),
Ecole Polytechnique Fédérale de Lausanne (EPFL),
Leenards and Jeantet Foundations,
Alamaya Foundation,
National Centre of Competence in Research (NCCR) Synapsy division from the Swiss National Science Fundation (SNF)
References
1. Steullet P, Cabungcal J-H, Coyle J, et al. Oxidative stress-driven parvalbumin interneuron impairment as a common mechanism in models of schizophrenia. Mol Psychiatry 2017;22:936–943
2. Ying W. NAD+ and NADH in brain functions, brain diseases and brain aging. Front. Biosci. 2007;12:1863–1888 doi: 10.2741/2194. 3. Kovacic P, Somanathan R. Redox Processes in Neurodegenerative Disease Involving Reactive Oxygen Species. Curr Neuropharmacol 2012;10:289–302
4. Tan BL, Norhaizan ME, Liew W-P-P, Sulaiman Rahman H. Antioxidant and Oxidative Stress: A Mutual Interplay in Age-Related Diseases. Front Pharmacol 2018;9
5. Kim S-Y, Cohen BM, Chen X, et al. Redox Dysregulation in Schizophrenia Revealed by in vivo NAD+/NADH Measurement. Schizophr Bull 2017;43:197–204
6. Zhu X-H, Lu M, Lee B-Y, Ugurbil K, Chen W. In vivo NAD assay reveals the intracellular NAD contents and redox state in healthy human brain and their age dependences. Proc. Natl. Acad. Sci. U.S.A. 2015;112:2876–2881
7. Lu M, Zhu X-H, Zhang Y, Chen W. Intracellular redox state revealed by in vivo (31) P MRS measurement of NAD(+) and NADH contents in brains. Magn Reson Med 2014;71:1959–1972
8. de Graaf RA, De Feyter HM, Brown PB, Nixon TW, Rothman DL, Behar KL. Detection of Cerebral NAD+ in Humans at 7 T. Magn Reson Med 2017;78:828–835
9. Skupienski, R.; Do, K. Q.; Marti, R.; Xin, L. In vivo study of cerebral NAD contents and Redox State during mouse brain development; in ISMRM Montréal, Canada, 2019; p.4208.
10. Mlynárik V, Gambarota G, Frenkel H, Gruetter R. Localized short-echo-time proton MR spectroscopy with full signal-intensity acquisition. Magn Reson Med 2006;56:965–970
11. Tkác I, Starcuk Z, Choi IY, Gruetter R. In vivo 1H NMR spectroscopy of rat brain at 1 ms echo time. Magn Reson Med 1999;41:649–656
12. Deelchand DK, Nguyen TM, Zhu X-H, Mochel F, Henry P-G. Quantification of in vivo 31P NMR Brain Spectra using LCModel. NMR Biomed 2015;28:633–641
13. Provencher SW. Estimation of metabolite concentrations from localized in vivo proton NMR spectra. Magn Reson Med 1993;30:672–679
Figures