2038
Association of decreased cerebral myelination with obesity1NIA, NIH, Baltimore, MD, United States
Synopsis
Diffusion
tensor imaging (DTI), relaxation time, and magnetization ratio (MTR)-based studies
have shown that obesity negatively impacts microstructural white matter (WM) integrity.
However, the specific impact of obesity on myelin content has not previously
been evaluated. Here, we examined the relationship between obesity status,
measured using body mass index (BMI), and myelin content, measured using myelin
water fraction (MWF) mapping, a surrogate of myelin content, in a large age
cohort of cognitively unimpaired lean, overweight, and obese subjects. Our
results indicate that BMI is negatively associated with MWF in several brain WM
regions.
PURPOSE
Growing epidemiological evidence establishes a link between obesity and central nervous system (CNS) degeneration. These observations have been corroborated by conventional quantitative MR parameter mapping, highlighting microstructural changes in white and gray matter that occur with obesity (1-4). However, to the best of our knowledge, the specific effect of obesity on myelination has not been investigated. In this study, we examined the potential association between myelin loss and obesity in a wide age-range cohort of cognitively unimpaired subjects. Our main goals were to characterize the regional association between myelination status, measured using an advanced method of myelin water fraction (MWF) mapping (5, 6), and obesity, measured using the body mass index (BMI), and to develop further insights into the specific effect of obesity on regional myelin integrity.METHODS
Subjects and MRIThe study cohort consisted of 115 cognitively unimpaired participants (55.5 ± 20.8years) of 55 women and 60 men spanning the age range between 22 and 94 years. The cohort consisted of 52 lean (BMI < 25) and 63 overweight (N = 48, 25 ≤ BMI < 30) and obese (N = 16, BMI ≥ 30) participants. Mean age did not differ between lean and overweight/obese participants. For each participant, ten 3D spoiled-gradient-recalled-echo (SPGR) images were acquired with flip angles (FAs) of [2 4 6 8 10 12 14 16 18 20]°, echo time of (TE) 1.37ms and repetition time (TR) of 5 ms, and ten 3D balanced steady-state free-precession images were acquired with FAs of [2 7 11 16 24 32 40 60]°, TE of 2.8ms, TR of 5.8ms, and radiofrequency excitation pulse phase increments of 0o or 180o to account for off-resonance effects (7). All images were acquired with a voxel size of 1.6mm×1.6mm×1.6mm. Further, we used the dual-angle method (DAM) to correct for B1 inhomogeneity (8). The DAM protocol consists of two fast spin-echo images acquired with FAs of 45° and 90°, TE of 102ms, TR of 3s, and acquisition voxel size of 2.6mm×2.6mm×4mm. All images were obtained with a field-of-view of 240mm×208mm×150mm and reconstructed on the scanner to a voxel size of 1mm×1mm×1mm.
Image processing and statistical analysis
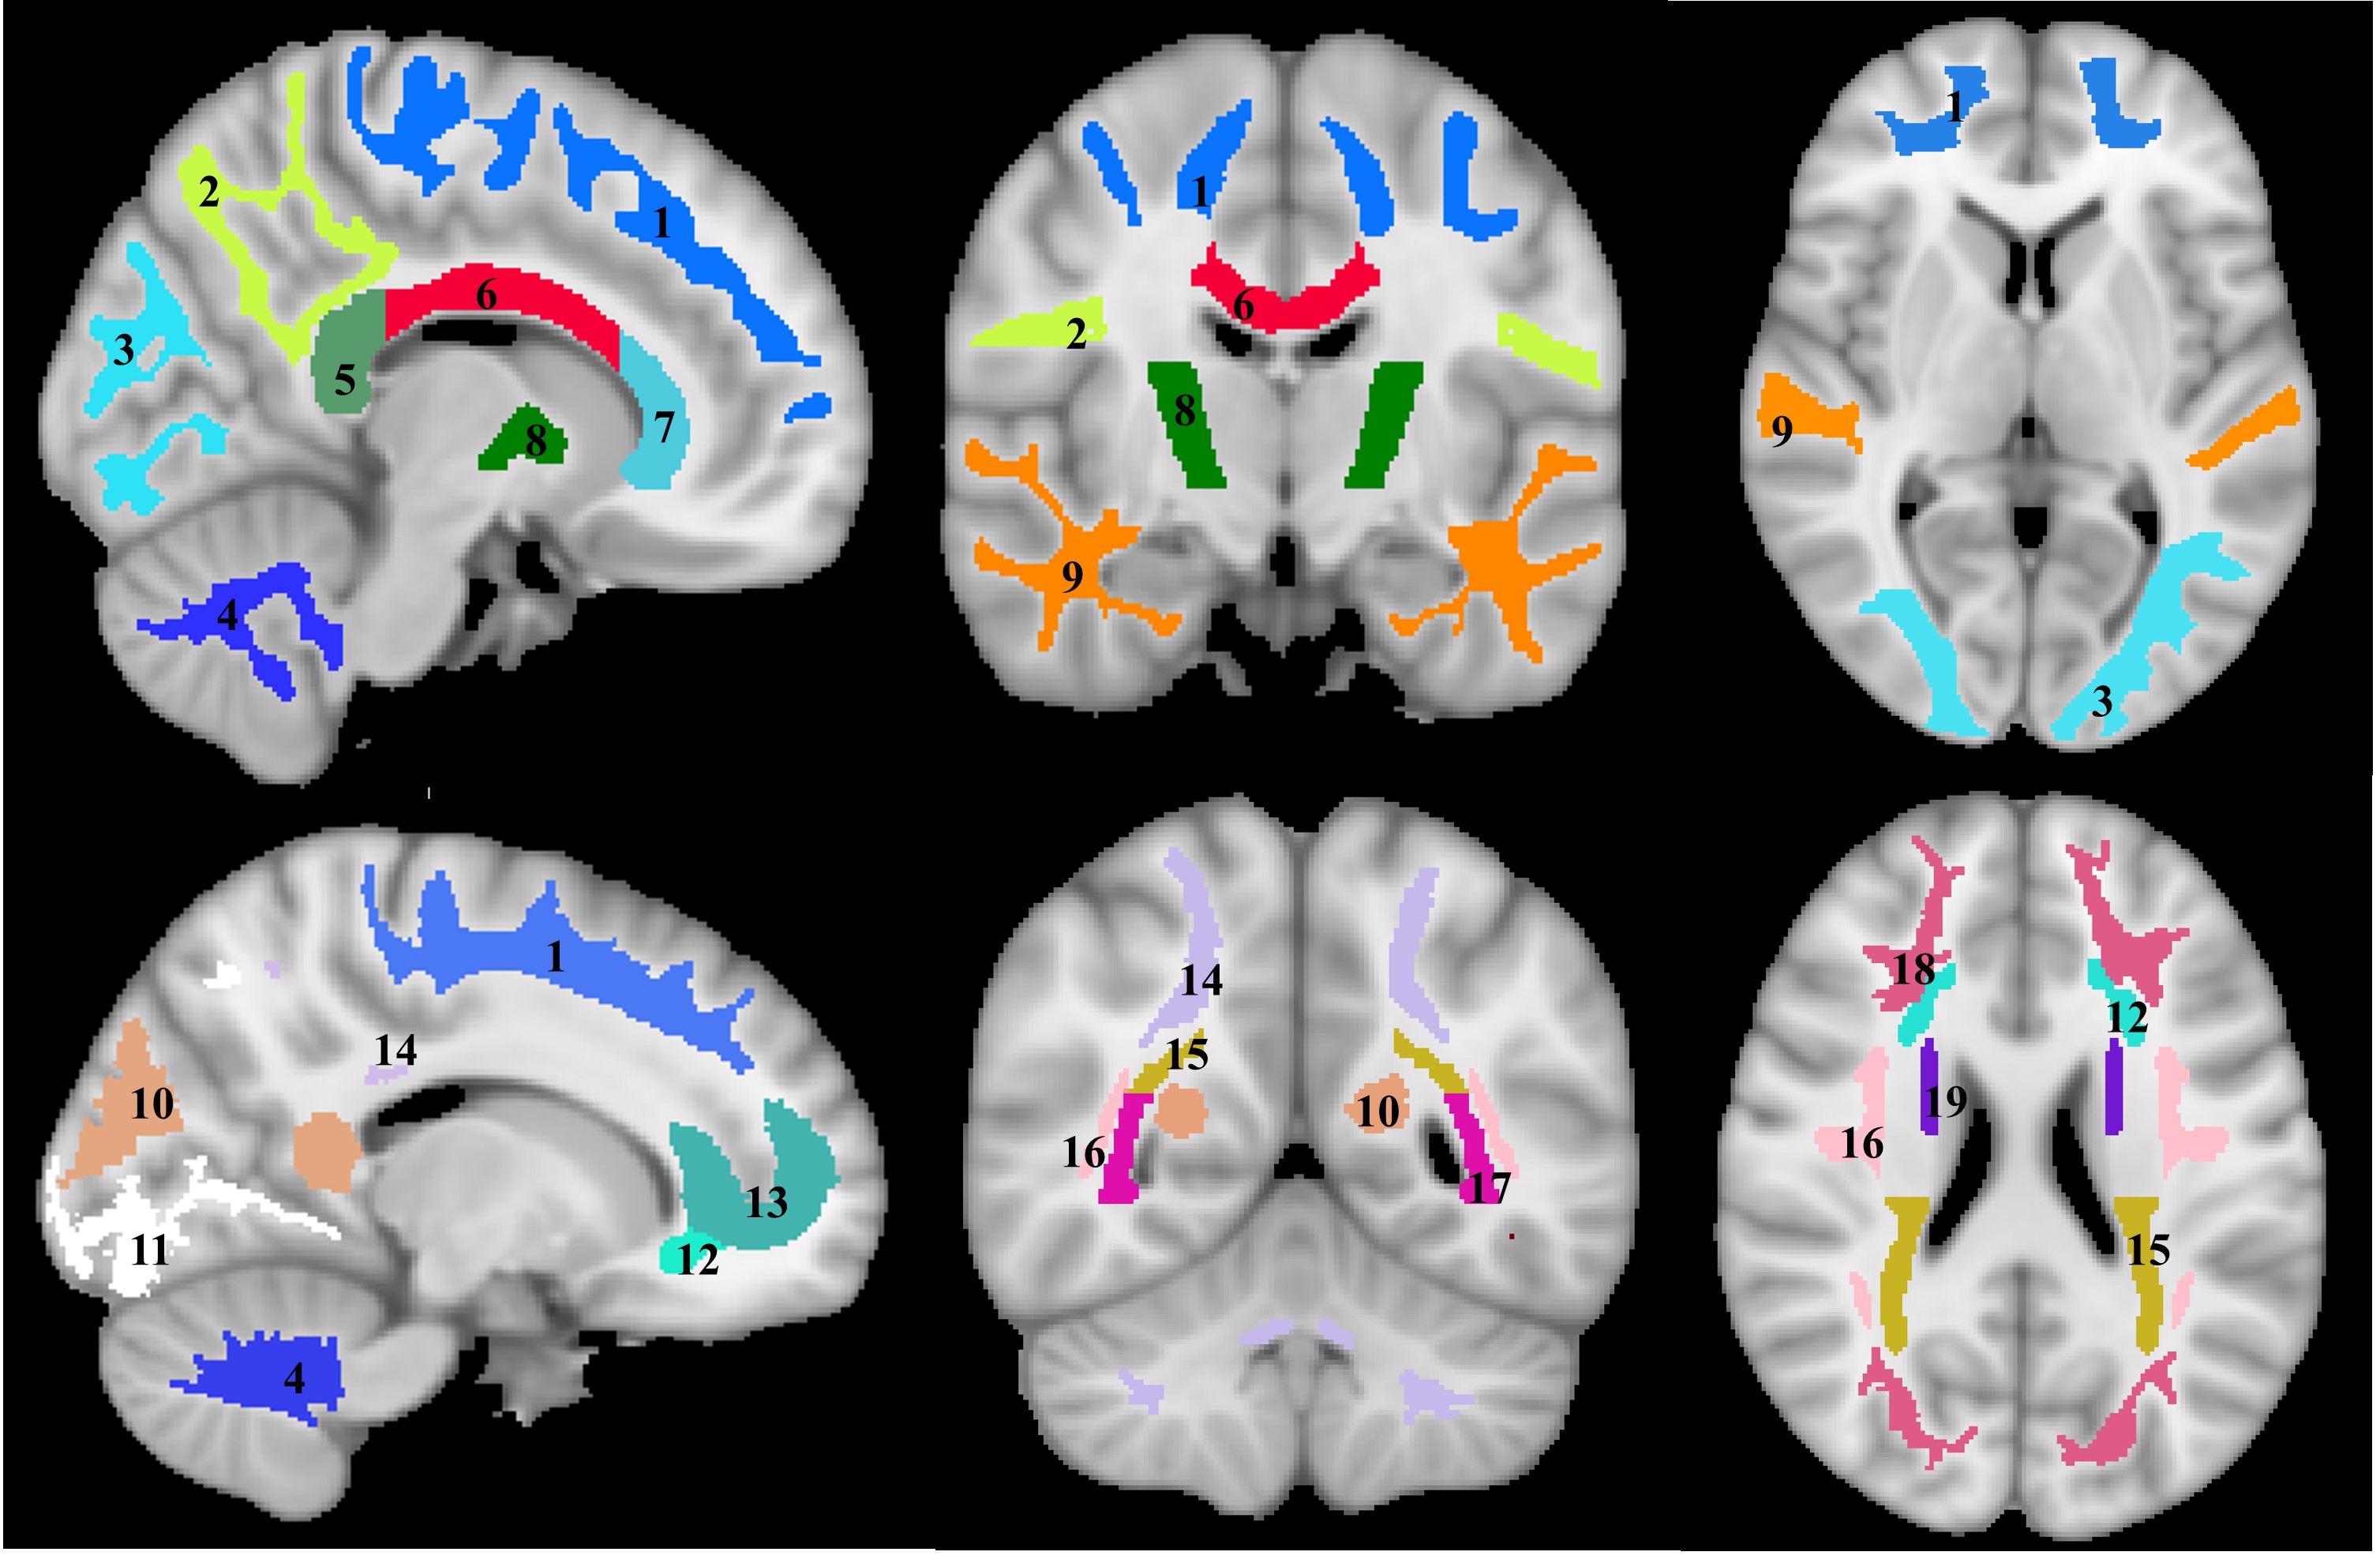
For each participant, a whole-brain MWF map was generated using the BMC-mcDESPOT analysis from the SPGR, bSSFP, and DAM images (5, 6, 9). Further, the SPGR image over FAs was nonlinearly registered to the MNI space, with the computed transformation matrix then applied to the corresponding MWF map; this analysis was performed using FSL software (10). Nineteen white matter (WM) regions of interest (ROIs) were defined from the MNI structural atlas (Fig. 1) (10). Finally, for each ROI, the effect of BMI on MWF was investigated using linear regression with mean MWF within the ROI as the dependent variable and BMI, sex, age, and age2 as independent variables. The inclusion of age2 as an independent variable is based on our and others’ recent observations that MWF follows a quadratic relationship with age (11, 12).
RESULTS & DISCUSSION
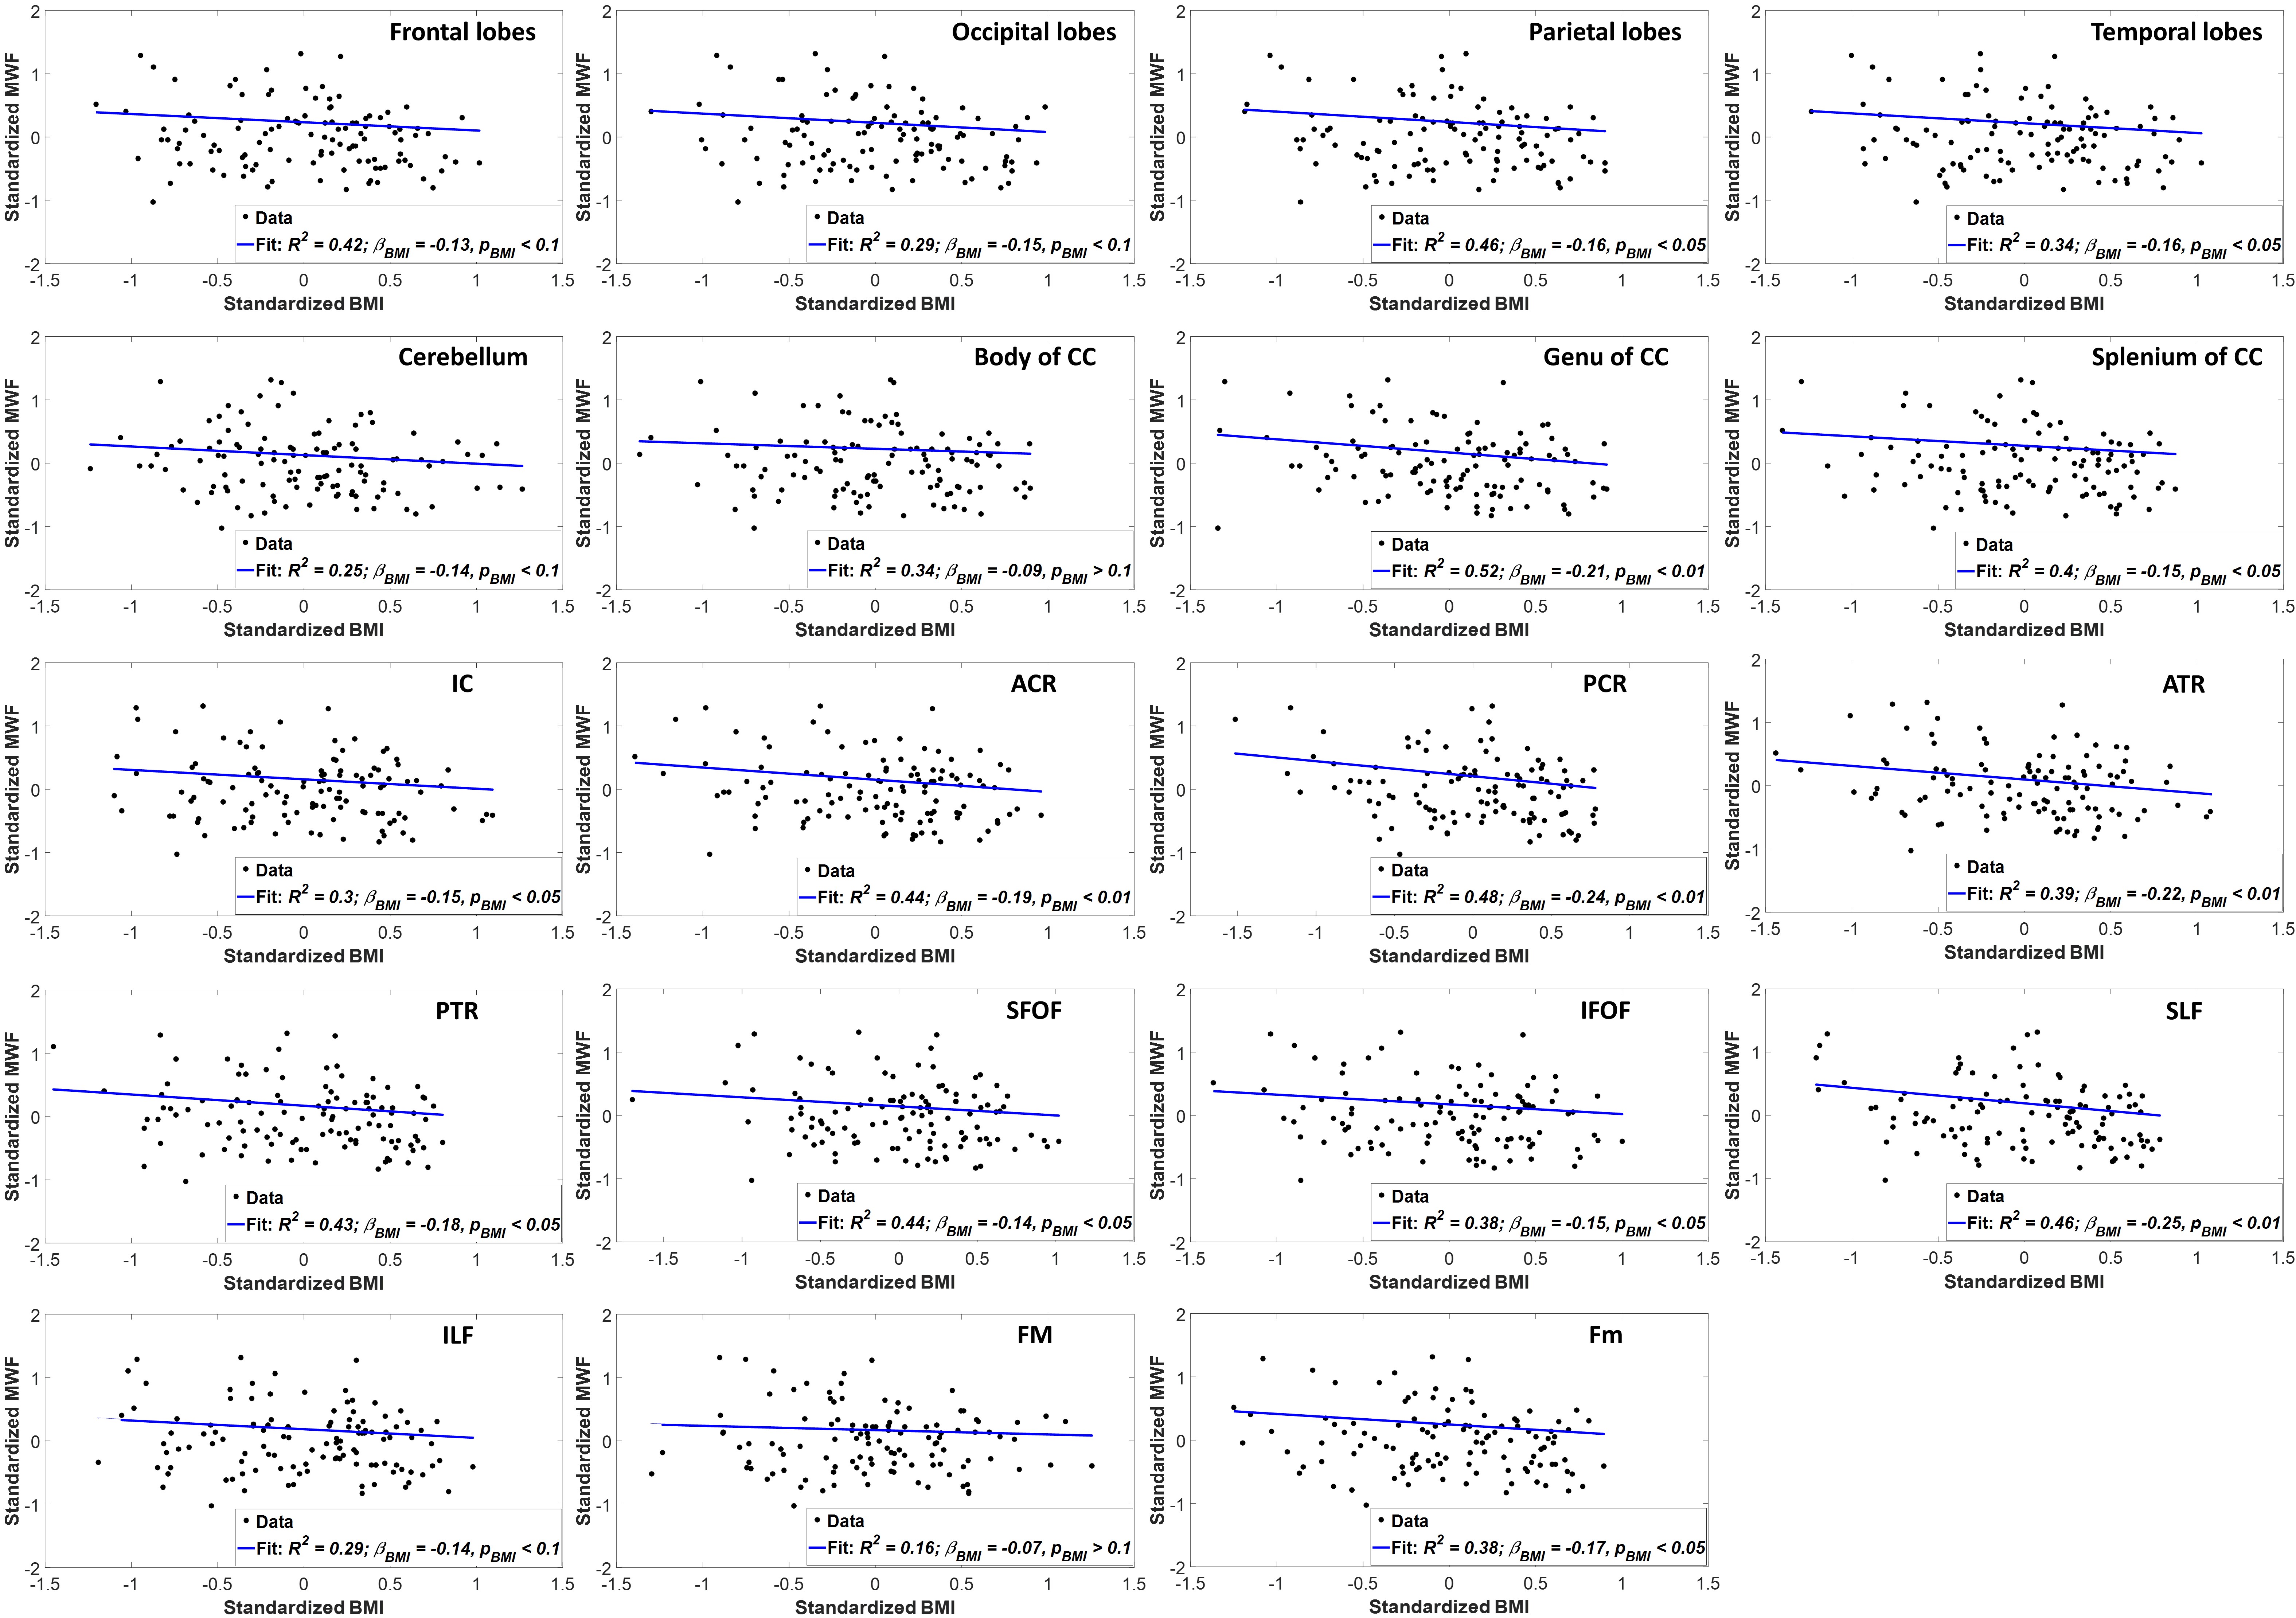
Figure 2 shows regression analysis of MWF and BMI, indicating a statistically significant (pBMI < 0.05) or close to significant (pBMI < 0.1) negative correlation in most WM brain regions evaluated after adjusting for age and sex. The plots indicate that increase in BMI correspond to a decrease in MWF. These results agree with, and are complementary to, previous DTI-, relaxation time-, and magnetization transfer ratio (MTR)-based investigations showing that obesity is associated with regional WM microstructural alterations in cognitively normal subjects (1-4). However, DTI-outcomes, including fractional anisotropy and mean diffusivity, while sensitive to WM microstructural changes, are not specific. Indeed, various factors such as axonal degeneration and demyelination can affect DTI-derived eigenvalues. Similarly, although most conventional quantitative MRI measures, including DTI, relaxation times, and MTR, are sensitive to myelin content changes, they cannot serve as specific markers of myelin; this is mainly due to their sensitivity to multiple other tissue properties such as hydration, macromolecular content, temperature, flow, and architecture, including fiber crossing and fanning. Therefore, in terms of these conventional measures, it remains unclear whether the consistently observed decline in MW integrity with obesity is a consequence of myelin loss, axonal damage, or other pathohistological changes. Thus, our work adds new insights highlighting the specific implications of obesity for demyelination.While the mechanism of myelin loss with obesity is not clear at present, it has been recently shown that chronic exposure to a high fat diet triggers myelin disruption (13). Furthermore, it has been shown that this dietary exposure is likely associated with CNS inflammation (14-16), potentiating loss of oligodendrocytes, the myelin-producing cells of the CNS (17). However, many of these studies were conducted on animal models. Further study of the effects of obesity on the CNS is imperative, given the increasing prevalence of obesity, including at advanced ages (18, 19).
CONCLUSIONS
As far as we know, this is the first study examining the association between regional brain myelin content and obesity. We found that myelin content declines with obesity in many brain regions in a population of cognitively normal participants. This decreased myelin could promote accelerated cognitive aging in obese individuals (20).Acknowledgements
This work was supported by the Intramural Research Program of the National Institute on Aging of the National Institutes of Health.References
1. Xu J, Li Y, Lin H, Sinha R, Potenza MN. Body mass index correlates negatively with white matter integrity in the fornix and corpus callosum: a diffusion tensor imaging study. Human brain mapping. 2013;34(5):1044-52.
2. Kullmann S, Callaghan MF, Heni M, Weiskopf N, Scheffler K, Häring H-U, et al. Specific white matter tissue microstructure changes associated with obesity. NeuroImage. 2016;125:36-44.
3. Mueller K, Anwander A, Möller HE, Horstmann A, Lepsien J, Busse F, et al. Sex-dependent influences of obesity on cerebral white matter investigated by diffusion-tensor imaging. PloS one. 2011;6(4):e18544-e.
4. Schall M, Iordanishvili E, Mauler J, Oros-Peusquens AM, Shah NJ. Increasing body mass index in an elderly cohort: Effects on the quantitative MR parameters of the brain. Journal of magnetic resonance imaging : JMRI. 2019.
5. Bouhrara M, Spencer RG. Improved determination of the myelin water fraction in human brain using magnetic resonance imaging through Bayesian analysis of mcDESPOT. NeuroImage. 2016;127:456-71.
6. Bouhrara M, Spencer RG. Rapid simultaneous high-resolution mapping of myelin water fraction and relaxation times in human brain using BMC-mcDESPOT. NeuroImage. 2017;147:800-11.
7. Deoni SC. Correction of main and transmit magnetic field (B0 and B1) inhomogeneity effects in multicomponent-driven equilibrium single-pulse observation of T1 and T2. Magnetic resonance in medicine. 2011;65(4):1021-35.
8. Stollberger R, Wach P. Imaging of the active B1 field in vivo. Magnetic resonance in medicine. 1996;35(2):246-51.
9. Bouhrara M, Spencer RG. Incorporation of nonzero echo times in the SPGR and bSSFP signal models used in mcDESPOT. Magnetic resonance in medicine. 2015;74(5):1227-35.
10. Jenkinson M, Beckmann CF, Behrens TE, Woolrich MW, Smith SM. FSL. NeuroImage. 2012;62(2):782-90.
11. Arshad M, Stanley JA, Raz N. Adult age differences in subcortical myelin content are consistent with protracted myelination and unrelated to diffusion tensor imaging indices. NeuroImage. 2016;143:26-39.
12. Bouhrara M, Rejimon AC, Cortina LE, Khattar N, Bergeron CM, Ferrucci L, et al. Adult brain aging investigated using BMC-mcDESPOT based myelin water fraction imaging. Neurobiology of aging. 2019.
13. Huang H-T, Tsai S-F, Wu H-T, Huang H-Y, Hsieh H-H, Kuo Y-M, et al. Chronic exposure to high fat diet triggers myelin disruption and interleukin-33 upregulation in hypothalamus. BMC neuroscience. 2019;20(1):33-.
14. Bruce-Keller AJ, Keller JN, Morrison CD. Obesity and vulnerability of the CNS. Biochimica et biophysica acta. 2009;1792(5):395-400.
15. Cazettes F, Cohen JI, Yau PL, Talbot H, Convit A. Obesity-mediated inflammation may damage the brain circuit that regulates food intake. Brain Res. 2011;1373:101-9.
16. Pistell PJ, Morrison CD, Gupta S, Knight AG, Keller JN, Ingram DK, et al. Cognitive impairment following high fat diet consumption is associated with brain inflammation. Journal of neuroimmunology. 2010;219(1-2):25-32.
17. Yoon H, Kleven A, Paulsen A, Kleppe L, Wu J, Ying Z, et al. Interplay between exercise and dietary fat modulates myelinogenesis in the central nervous system. Biochimica et biophysica acta. 2016;1862(4):545-55.
18. Samper-Ternent R, Al Snih S. Obesity in Older Adults: Epidemiology and Implications for Disability and Disease. Rev Clin Gerontol. 2012;22(1):10-34.
19. Peralta M, Ramos M, Lipert A, Martins J, Marques A. Prevalence and trends of overweight and obesity in older adults from 10 European countries from 2005 to 2013. Scandinavian journal of public health. 2018;46(5):522-9.
20. Nguyen JCD, Killcross AS, Jenkins TA. Obesity and cognitive decline: role of inflammation and vascular changes. Frontiers in neuroscience. 2014;8:375-.
Figures