2036
Quantitative Susceptibility Mapping in a Healthy Population of Cigarette Smokers1Department of Radiology, Perelman School of Medicine at the University of Pennsylvania, Philadelphia, PA, United States, 2Department of Psychiatry, Perelman School of Medicine at the University of Pennsylvania, Philadelphia, PA, United States, 3University of Clorado School of Medicine, Aurora, CO, United States
Synopsis
The purpose was to evaluate the differential degree of iron deposition in deep gray-matter regions in a healthy population of cigarette smokers (n=8) and non-smokers (n=7) using quantitative susceptibility mapping (QSM). All subjects underwent anatomical imaging and 3D-susceptibiluty weighted imaging on a 7T MR system. A trend towards higher QSM was observed in smokers than in non-smokers from globus pallidus region. All other DGM regions also had higher QSM values in smokers compared to those of non-smokers, however, no significant differences were observed. Future studies are warranted to validate our findings in a larger cohort.
Introduction
Iron plays an important role in normal brain metabolism1. However, iron overload is known to initiate and amplify a wave of oxidative injury eventually leading to neurodegeneration2. A strong body of evidence3,4 has suggested that increased iron deposition occurs within deep gray-matter (DGM) regions predominantly in basal ganglia and thalamus of patients with neurodegenerative diseases. Moreover, progressive iron accumulation in different structures of brain accompanies normal aging processes5. It is also known that chronic, and excessive alcohol consumption frequently leads to an abnormal buildup of iron in liver, and brain6. However, impairment in brain iron metabolism is poorly understood in a population of cigarette smokers. Ultra-high field strength quantitative susceptibility mapping (QSM) offers a highly sensitive tool for iron detection and quantification secondary to greater signal to noise ratio, spatial resolution and tissue contrast7-9. The purpose of the present study was to evaluate the differential degree of iron deposition in DGM nuclei in population of cigarette smokers and non-smokers.Methods
A cohort of 10 healthy self-reported non-smokers with expired breath carbon monoxide (CO) of below 8ppm and 10 smokers with intake of atleast 5 cigarettes per day for at least 2 years and expired breath CO level of >8ppm completed the MRI scans out of which two subjects, one each in smokers and non-smokers did not had 3D-SWI data acquired. All subjects underwent MR imaging on a whole body 7.0T scanner (MAGNETOM Terra, Siemens Healthcare, Erlangen, Germany) with a single volume coil transmit/32-channel receive proton head phased-array coil. The imaging protocol included sagittal T1-weighted 3D-MPRAGE and axial 3D-susceptibility weighted imaging (SWI) sequences. High-resolution, flow-compensated 3D-SWI images were acquired with the following parameters: TR/TE=27/18ms, flip-angle=18°, slice thickness=2mm, FOV=240×240mm2, base resolution=1024, voxel size=0.2×0.2×2mm3, bandwidth=110Hz/px, iPAT factor=2 and acquisition time=7min:49sec. To avoid, susceptibility artifacts from air-tissue interfaces, only supratentorial brain regions were covered while acquiring 3D-SWI. Susceptibility weighted imaging and mapping (SWIM) algorithm developed by Dr. Haacke’s group8 was used to reconstruct QSM maps from high resolution 3D-SWI data. The post-processing involved skull stripping to remove the artifacts caused by skull and brain tissue interface using the brain extraction tool, followed by phase unwrapping using a Laplacian operator. To remove background field in homogeneity, a variable high-pass filter of 32 pixels size was applied and, finally, inverse filtering was performed to generate QSM maps. The median QSM values (in ppb) were computed from DGM regions (thalamus, putamen, globus pallidus, and caudate nucleus) by manually drawing regions of interests (ROIs) on these regions bilaterally. The QSM values from both cerebral hemispheres were averaged and were compared between non-smokers and smokers using independent sample t-tests. A probability (p) value of less than 0.05 was considered significant.Results
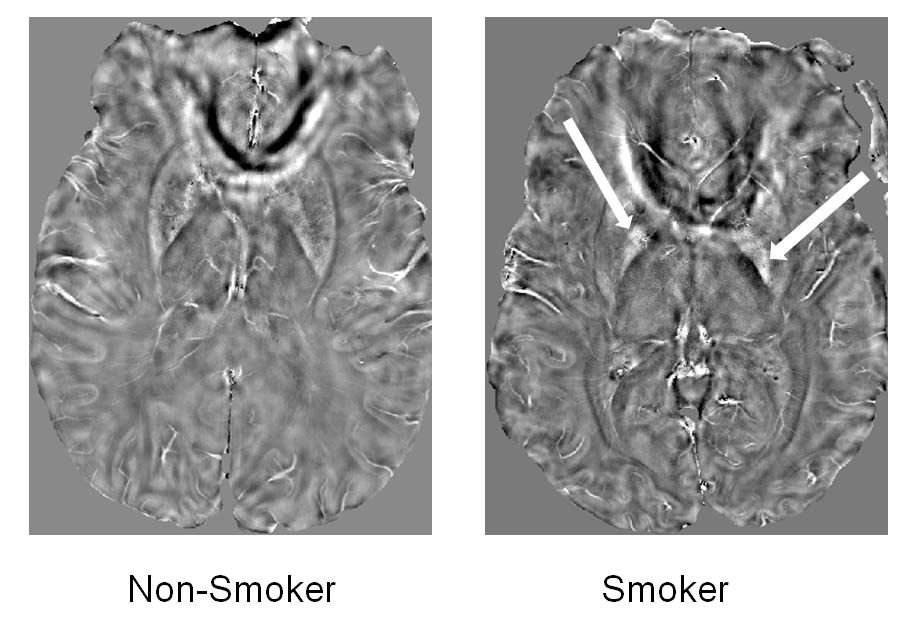
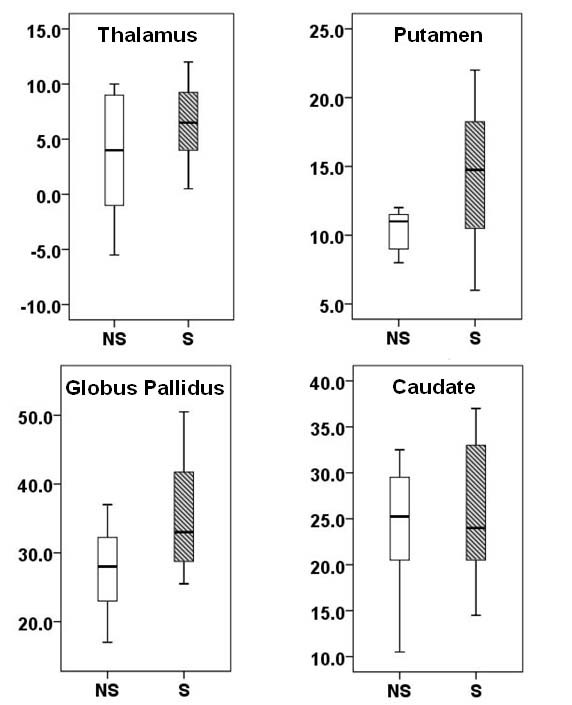
Representative QSM maps from non-smoker and smoker are shown in Figure 1. Distributions of QSM values between two groups of subjects are shown as box-whisker plots (Figure 2). Data presented here are from 15 subjects (7 non-smokers and 8 smokers) analyzed so far. A trend towards higher QSM was observed in smokers (35.4 ± 8.7ppb vs. 27.5 ± 7.2ppb, p=0.08) than in non-smokers from globus pallidus region. All other DGM regions also had higher QSM values in smokers compared to those of non-smokers, however, no significant differences were observed (p>0.10).Discussion
In this pilot study, we sought to determine the differential degree of iron deposition in DGM regions between smokers and non-smokers. Our initial findings suggest that smokers may accumulate increased iron contents in different DGM regions of brain. Several studies9,10 including from our group11,12 have reported that impaired iron metabolism is implicated in the pathogenesis of several neurodegenerative disorders, cardiovascular and hepatic diseases. However, data on the association between lifestyle factors, such as alcohol consumption, smoking, physical activity, and iron overload are still limited and inconsistent. There have been controversial findings on the association between smoking and iron status. One study reported no difference in plasma iron levels between non-smokers and smokers.13 But, another study examined that pregnant women who had smoked had higher ferritin levels in blood than those who had never smoked.14 While assessing serum transferrin saturation (TSAT) levels, one study15 found a positive relationship between heavy smoking > 10 cigarettes/day and iron overload. To the best of our knowledge, no study has examined the abnormal brain iron accumulation in a population of smokers. In the present study, we observed a trend towards increased iron deposition in DGM regions in smokers compared to those of non-smokers. Collectively, our findings and prior studies provide a notion that there might be a potential association between heavy smoking and iron overload. The molecular pathways for iron accumulation in brain regions still remain to be fully understood, however, it has been suggested that smoking may stimulate erythropoiesis in a dose-related manner due to hypoxia, which is induced by smoking.16Conclusion
Heavy smoking may increase the risk of iron deposition in brain regions. However, future studies are required to confirm our findings in a larger cohort.Acknowledgements
This project was supported by a pilot grant from The Thomas B. and Jeannette E. Laws McCabe Fund, National Institute of Biomedical Imaging and Bioengineering of the National Institute of Health through grant number p41-EB015893.References
1. Koeppen AH. A brief history of brain iron research. J Neurol Sci 2003;207:95-97.
2. Haider L. Inflammation, Iron, Energy Failure, and Oxidative Stress in the Pathogenesis of Multiple Sclerosis. Oxidative medicine and cellular longevity 2015;2015:725370.
3. Acevedo K, Masaldan S, Opazo CM, et al. Redox active metals in neurodegenerative diseases. J Biol Inorg Chem. 2019 Oct 24. doi: 10.1007/s00775-019-01731-9.
4. Levi S, Cozzi A, Santambrogio P. Iron Pathophysiology in Neurodegeneration with Brain Iron Accumulation. Adv Exp Med Biol. 2019;1173:153-77.
5. Ghadery C, Pirpamer L, Hofer E, et al. R2* mapping for brain iron: associations with cognition in normal aging. Neurobiol Aging. 2015;36:925-32.
6. Fletcher LM. Alcohol and iron: one glass of red or more? J Gastroenterol Hepatol. 1996 Nov;11(11):1039-41.
7. Eskreis-Winkler S, Deh K, Gupta A, et al. Multiple sclerosis lesion geometry in quantitative susceptibility mapping (QSM) and phase imaging. J Magn Reson Imaging. 2015;42(1):224-9.
8. Liu S, Neelavalli J, Cheng YC, Tang J, Mark Haacke E. Quantitative susceptibility mapping of small objects using volume constraints. Magn Reson Med. 2013;69:716–723.
9. Yan F, He N, Lin H, et al. Iron deposition quantification: Applications in the brain and liver. J Magn Reson Imaging. 2018 Aug;48(2):301-317.
10. Kaindlstorfer C, Jellinger KA, Eschlböck S, et al. The Relevance of Iron in the Pathogenesis of Multiple System Atrophy: A Viewpoint. J Alzheimers Dis. 2018;61(4):1253-1273.
11. Chawla S, Kister I, Wuerfel J, et al. Iron and Non-Iron-Related Characteristics of Multiple Sclerosis and Neuromyelitis Optica Lesions at 7T MRI. Am J Neuroradiol. 2016 Jul;37(7):1223-30.
12. Chawla S, Kister I, Sinnecker T, et al. Longitudinal study of multiple sclerosis lesions using ultra-high field (7T) multiparametric MR imaging. PLoS One. 2018 Sep 13;13(9):e0202918. doi: 10.1371/journal.pone.0202918. eCollection 2018.
13. Kocyigit A, Erel O, Gur S. Effects of tobacco smoking on plasma selenium, zinc, copper and iron concentrations and related antioxidative enzyme activities. Clin Biochem. 2001;34:629–633.
14. Chełchowska M, Ambroszkiewicz J, Gajewska J, et al. Hepcidin and iron metabolism in pregnancy: correlation with smoking and birth weight and length. Biol Trace Elem Res. 2016;173:14–20.
15. Kim H, Shin C, BaiK I .Association between lifestyle factors and iron overload in Korean adults. Clin Nutr Res. 2016 Oct;5(4):270-278.
16. Ghio AJ, Hilborn ED, Stonehuerner JG, et al. Particulate matter in cigarette smoke alters iron homeostasis to produce a biological effect. Am J Respir Crit Care Med. 2008;178:1130–1138.
Figures