2035
Chronic effects of smoking on the brain oxygenation and perfusion using ASL and quantitative BOLD MRI1Computer Assisted Clinical Medicine, Medical Faculty Mannheim, Heidelberg University, Mannheim, Germany, 2Department of Addictive Behavior and Addiction Medicine, Central Institute of Mental Health, Medical Faculty Mannheim, Heidelberg University, Mannheim, Germany
Synopsis
The effects of smoking on human brain hemodynamics have been investigated in PET studies, but no real consensus has been found. In this study, an MRI-based approach using arterial spin labelling and multi-parametric quantitative BOLD is implemented to measure the chronic effects of cigarette smoking on the cerebral blood flow, oxygen extraction fraction and cerebral metabolic rate of oxygen. Chronic effects between smokers and never-smokers were detected in three regions for CBF, three regions for OEF, and one region for CMRO2.
Introduction
Despite the fact that cigarette smoking is one of the most common addictions worldwide, there is still no consensus about the effects of smoking-induced nicotine administration on brain metabolism.1-3 Hemodynamic parameters, such as cerebral blood flow (CBF), oxygen extraction fraction (OEF) and cerebral metabolic rate of oxygen (CMRO2) have been examined in positron emission tomography (PET) studies with 15O tracer. In a previous work, we implemented an MRI based approach to measure the acute effects of smoking on the brain oxygenation and perfusion.4 Here, the chronic effects of smoking are investigated with an arterial spin labelling (ASL) and multi-parametric quantitative BOLD (qBOLD) approach.Methods
20 chronic smokers (29±9 (s.d.) years, 7 women) were recruited for this study, which was approved by the local ethics committee. All participants were asked to refrain from smoking at least 8 hours prior to the measurement and their abstinence was confirmed with a breath CO monitor. The measurements consisted of two sessions, each lasting approximately 30 minutes, and an intermediate break of 30 minutes during which the participants smoked one cigarette. Ten healthy never-smokers (21±4 (s.d.) years, 4 women) were also recruited for the study. They underwent the same procedure except for the smoking break and second session of MRI measurements.2D multi-gradient echo (mGRE), 2D multi-spin echo (mSE), 2D-EPI pseudo-continuous arterial spin labelling (pCASL) and T1-weighted MPRAGE data was acquired on a clinical 3T Magnetom TRIO scanner using a 32-channel head-coil (Siemens Healthineers, Erlangen, Germany). The parameters for mGRE were: TR/TE1/ΔTE = 2650/4.5/5.5 ms, 12 echoes, resolution = 1.7x1.7 mm² with 20% slice gap, slice thickness 1.5 mm, 66 slices, matrix size = 128x96, acquisition time = 5:18 min. The mSE parameters were: TR/TE1/ΔTE = 2650/13.1/13.1 ms, 12 echoes, resolution = 2x2 mm² with 20% slice gap, slice thickness 2 mm, 45 slices, matrix size = 128x96, acquisition time = 7:19 min. The pCASL parameters were: TR/TE = 5000/16 ms, resolution = 3x3 mm² with 20% slice gap, slice thickness 3 mm, 28 slices, matrix size = 80x80, 48 averages, acquisition time = 8:05 min, post-label delay (PLD) = 1500 ms, label duration (LD) = 1500 ms and the labelling plane was placed perpendicular to the internal carotid artery roughly 80 mm below the anterior-posterior-commissure line.
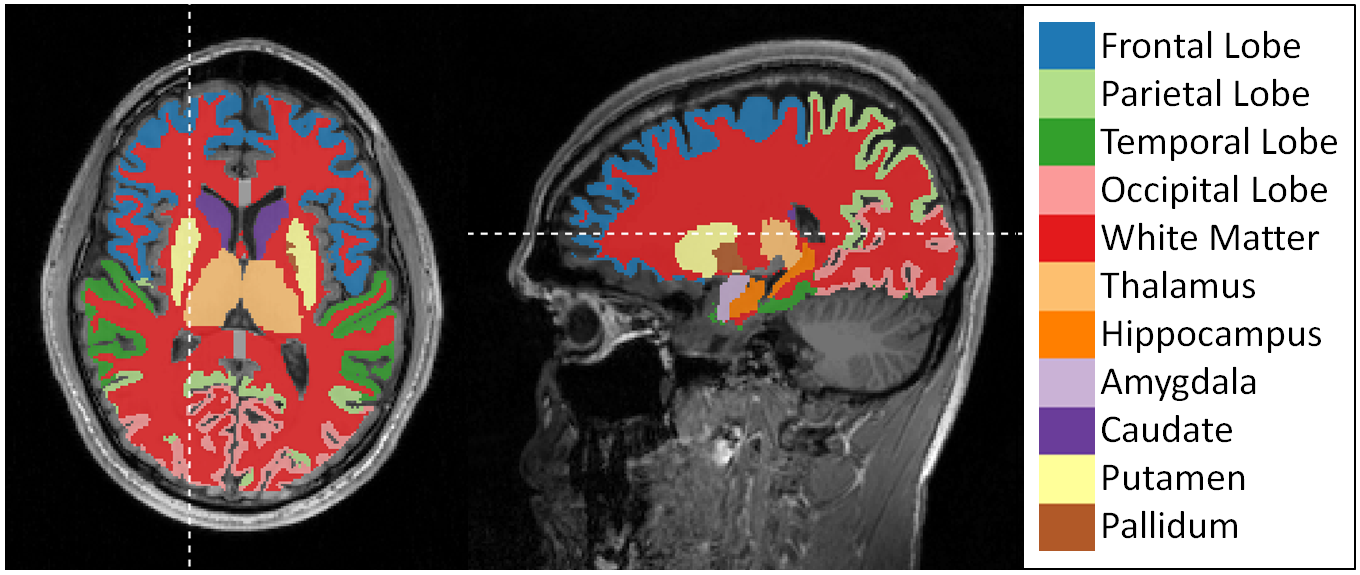
R2* and R2 values including a noise offset were fitted to the mGRE and mSE magnitude data respectively. CBF in ml/100g/min was estimated from the pCASL data according to the white paper5 with the deoxygenated blood volume DBV in ml/100g given by6,7 DBV=0.77*2.1*CBF0.32. The MPRAGE data sets were registered to the MNI305 standard brain8 and segmented into cortical and subcortical regions of interest (ROIs) using Freesurfer.9 OEF in % and CMRO2 in µmol/100g/min were calculated as
$$\mathrm{OEF}=\frac{3}{4 \pi \gamma \mathrm{B}_{0}} \cdot \frac{R_{2}^{*}-R_{2}}{\mathrm{DBV}} \cdot \frac{1}{\Delta x_{\mathrm{do}} \cdot \mathrm{Hct}}$$
$$\mathrm{CMRO}_{2}=\mathrm{OEF} \cdot \mathrm{CBF} \cdot[\mathrm{H}]_{\mathrm{a}}$$
with the haematocrit Hct = 0.357, susceptibility difference between fully oxy- and deoxygenated blood10 Δχdo = 0.27 ppm and the heme molar concentration [H]a = 7.377 μmol/ml for an arterial oxygen saturation11 of Ya = 0.98. Inter-subject means of OEF, CBF and CMRO2 were calculated in all segmented brain regions shown in Figure 2. Smokers in the pre- and post-smoking state were compared with never-smokers for all parameters in all ROIs. In order to account for the significant age difference between smokers and never-smokers, age was included in the tests as covariate. For the statistical analysis, IBM SPSS Statistics version 24 (IBM Corp., Armonk, NY, USA) was used. Four smokers were excluded from the statistical analysis due to apparent artifacts in the R2* maps. Statistical significance was assumed for p < 0.05.
Results
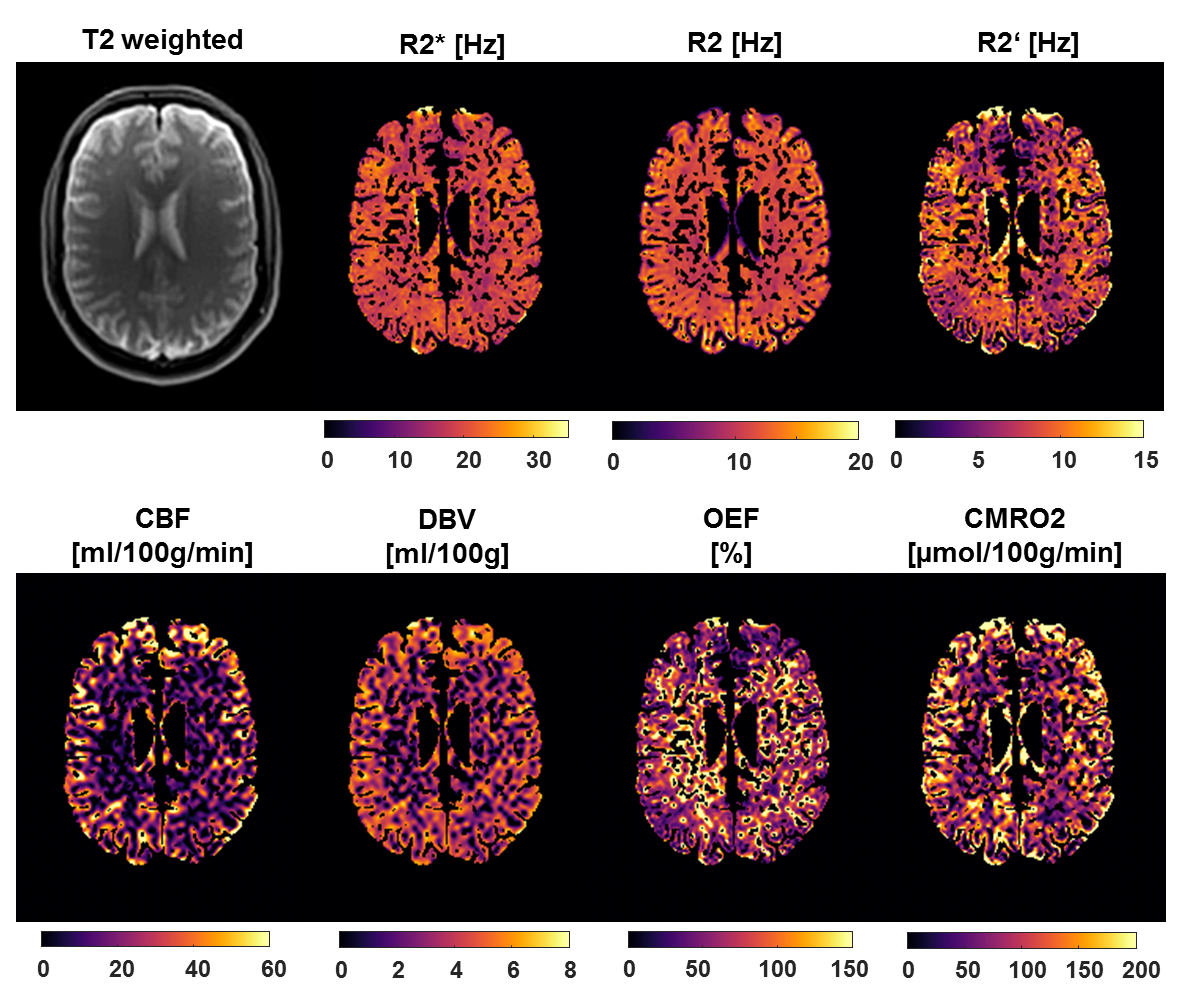
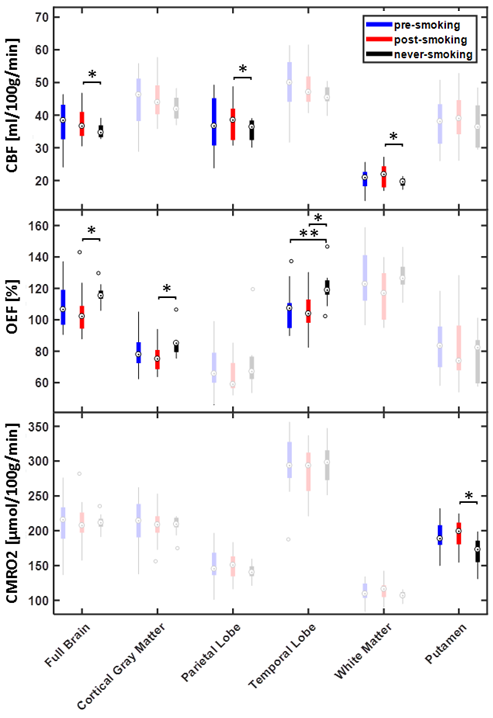
Figure 1 depicts a representative slice of the R2*, R2, R2’ = R2*- R2, CBF, DBV, OEF and CMRO2 maps of a single subject (pre-smoking) as well as the corresponding T2 weighted image as reference. Contrast between gray and white matter can be observed in CBF, OEF and CMRO2. The ROIs defined by the cortical and subcortical segmentation are depicted in Figure 2. Boxplots comparing CBF, OEF and CMRO2 in the pre- and post-smoking state with the never-smoking state are illustrated in Figure 3. Significant differences were found in CBF in the full brain, parietal lobe and white matter, OEF in the full brain, cortical gray matter and temporal lobe, CMRO2 in the putamen. ROIs not showing any significance were omitted in the figure.Discussion
In this study, we applied an ASL and multi-parametric qBOLD method in never-smokers and smokers. Significant chronic effects were detected in three regions for CBF, three regions for OEF, and one region for CMRO2. A difference in CBF between post-smoking and never-smoking state was detected. In contrast, Vafaee et al.2 found a difference in the pre-smoking state that normalized after smoking. This study may form the basis for further MRI-based investigations that will hopefully contribute to a consensus on the chronic implications of cigarette smoking on the brain metabolism.Conclusion
The combination of qBOLD and ASL allows for the measurement of significant chronic effects of cigarette smoking on the brain oxygenation and perfusion.Acknowledgements
No acknowledgement found.References
1. Yamamoto Y, Nishiyama Y, Monden T, Satoh K and Ohkawa M. A study of the acute effect of smoking on cerebral blood flow using 99mTc-ECD SPET. Eur J Nucl Med Mol Imaging. 2003; 30: 612-4.
2. Vafaee MS, Gjedde A, Imamirad N, et al. Smoking normalizes cerebral blood flow and oxygen consumption after 12-hour abstention. J Cereb Blood Flow Metab. 2015; 35: 699-705.
3. Shinohara T, Nagata K, Yokoyama E, et al. Acute Effects of Cigarette Smoking on Global Cerebral Blood Flow in Overnight Abstinent Tobacco Smokers. Nicotine & Tobacco Research. 2006; 8: 113-21.
4. Thomas S, Hubertus S, Skampardoni I, Hartig N, Vollstaedt-Klein S and Schad LR. The Acute Effects of Cigarette Smoking on Brain Oxygenation and Perfusion Measured by Multi-Parametric Quantitative BOLD and Arterial Spin Labeling MRI: Preliminary Results. Proc Intl Soc Mag Reson Med. 2019: 2925.
5. Alsop DC, Detre JA, Golay X, et al. Recommended implementation of arterial spin-labeled Perfusion mri for clinical applications: A consensus of the ISMRM Perfusion Study group and the European consortium for ASL in dementia. Magn Reson Med. 2015; 73: 102-16.
6. An H and Lin W. Cerebral venous and arterial blood volumes can be estimated separately in humans using magnetic resonance imaging. Magn Reson Med. 2002; 48: 583-8.
7. Ciris PA, Qiu M and Constable RT. Noninvasive MRI measurement of the absolute cerebral blood volume–cerebral blood flow relationship during visual stimulation in healthy humans. Magn Reson Med. 2014; 72: 864-75.
8. Evans AC, Collins DL, Mills SR, Brown ED, Kelly RL and Peters TM. 3D statistical neuroanatomical models from 305 MRI volumes. 1993 IEEE Conference Record Nuclear Science Symposium and Medical Imaging Conference. 1993, p. 1813-7 vol.3.
9. Fischl B. FreeSurfer. Neuroimage. 2012; 62: 774-81.
10. Spees WM, Yablonskiy DA, Oswood MC and Ackerman JJ. Water proton MR properties of human blood at 1.5 Tesla: magnetic susceptibility, T(1), T(2), T*(2), and non-Lorentzian signal behavior. Magn Reson Med. 2001; 45: 533-42.
11. Cho J, Kee Y, Spincemaille P, et al. Cerebral metabolic rate of oxygen (CMRO2) mapping by combining quantitative susceptibility mapping (QSM) and quantitative blood oxygenation level-dependent imaging (qBOLD). Magn Reson Med. 2018; 80: 1595-604.
Figures