2033
Radiomics based on multi departments for differentiating anaplastic astrocytoma and anaplastic oligodendroglioma and predicting 1p19q status1School of Information and Engineering, Zhengzhou University, Zhengzhou, China, 2Department of Magnetic Resonance Imaging, The First Affiliated Hospital of Zhengzhou University, Zhengzhou, China, 3School of Software, Zhengzhou University, Zhengzhou, China
Synopsis
Radiologists encounter difficulty in accurately distinguishing anaplastic astrocytoma from anaplastic oligodendroglioma based on images. Neurosurgeons prefer non-invasive determination of the 1p19q tumor status to prepare treatment plans early. This study aimed to satisfy clinical needs of multi departments by constructing two radiomic models based on magnetic resonance imaging. The models can help identify the two tumors through their imaging features and predict their 1p19q status. Good performance in terms of the area under the receiver operating characteristic curve, sensitivity, and specificity was observed, suggesting the potential of our approach in supporting multidisciplinary clinical work
Purpose
Based on multi departments requirements, the radiomic features of magnetic resonance imaging were analyzed to differentiate between anaplastic astrocytoma and anaplastic oligodendroglioma, as well as to predict 1p19q status.Introduction
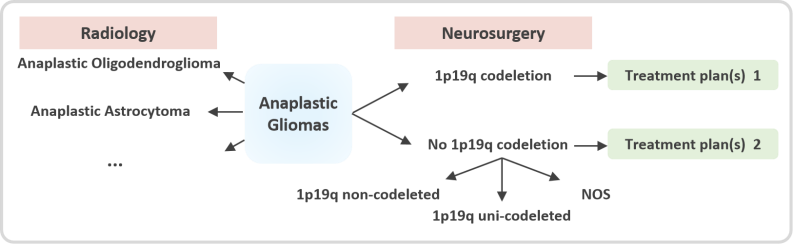
As classified by the World Health Organization, anaplastic gliomas (AGs) are grade-III malignant tumors accounting for 6%–10% of all newly diagnosed primary brain tumors in adults[1]. On the basis of their histopathology, AGs are of two main subtypes, namely, anaplastic astrocytoma (AAs) and anaplastic oligodendroglioma (AOs). Accurate determination of the subtype before surgery is crucial to patient prognosis. Radiologists encounter difficulty in accurately distinguishing between AAs and AOs based on images. Meanwhile, neurosurgeons prefer to know the 1p19q status of the tumor non-invasively to promptly prepare the treatment plans (Figure 1).Materials and Methods
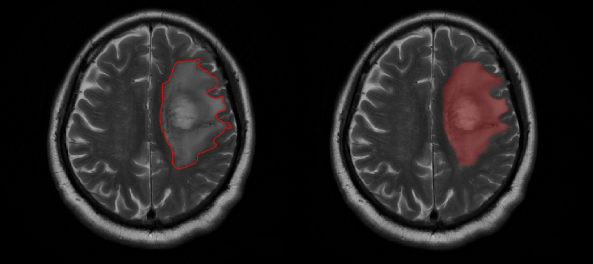
From May 2016 to May 2018, we conducted a retrospective study of 105 patients with pathologically confirmed AGs (46 AAs and 59 AOs) from the local hospital PACS system. Among the AO patients, 42 had a 1p19q co-deletion status, 1 had 1p19q non-co-deletion status, and 16 had not-otherwise-specified (NOS) status. The latter two were considered to be “no 1p19q co-deletion.” Meanwhile, all AAs were considered to be “no 1p19q co-deletion”; 6 were 1p19q non-co-deleted, 6 were 1p19q uni-co-deleted, and 34 were NOS. Overall, a total of 42 patients had 1p19q co-deletion, and 63 patients were identified as “no 1p19q co-deletion.” All patient data were anonymized prior to analysis. Both sets of data were randomly ordered. The primary and validation cohorts were divided at a ratio of 2:1 (70:35). The regions of interest (ROIs) covering the entire tumor and edema were manually delineated on the axial section of the T2WI using ITK-SNAP software (Figure 2). A total of 1561 quantitative radiomic features were automatically calculated from their respective T2WI image sequences. To ensure that the feature values remained within an appropriate range, a minimum–maximum normalization algorithm was used to normalize each radiomic feature. We used a three-level feature screening strategy (U test, Elastic Net[2], and SVM-RFE[3]) to ensure the acquisition of non-redundant and highly correlated features. Finally, eight features were selected to differentiate AAs and AOs, and five were selected to predict 1p19q status. All features were processed using MATLAB 2015b. The SVM classifier was used to establish the classification model. The receiver operating characteristic (ROC) curve was plotted to assess the differential diagnostic efficiency after modeling.Results
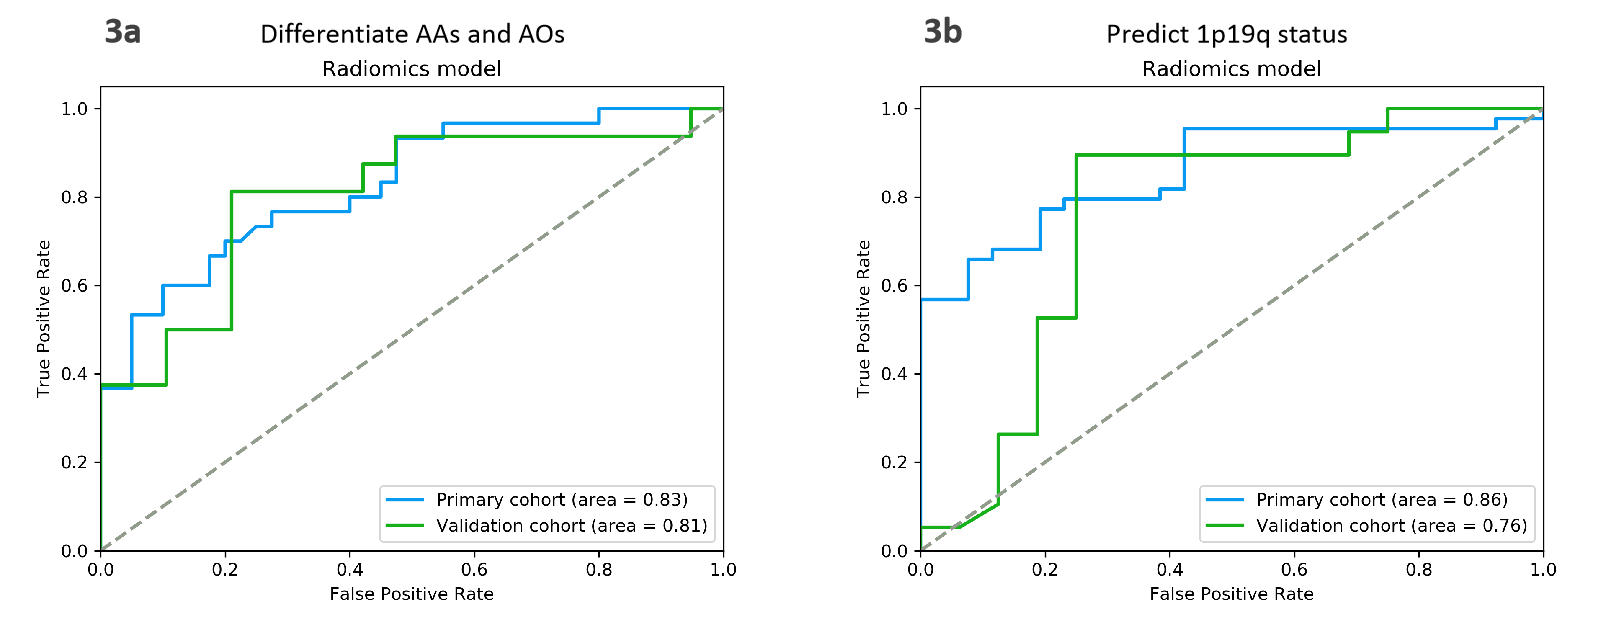
The ROC curves in Fig. 3(a) demonstrated the performance of the radiomic model in differentiating AAs from AOs in the two cohorts. In the primary cohort, the AUC, accuracy, sensitivity, and specificity were 0.83, 75.7%, 70.0%, and 80.0%, respectively. In the validation cohort, the AUC, accuracy, sensitivity, and specificity were 0.81, 80.0%, 81.3%, and 78.9%, respectively. The ROC curves in Fig. 3(b) revealed the performance of the radiomic model in predicting 1p19q status in the two cohorts. In the primary cohort, the AUC, accuracy, sensitivity, and specificity were 0.86, 78.6%, 77.3%, and 80.8%, respectively. In the validation cohort, the AUC, accuracy, sensitivity, and specificity were 0.76, 77.1%, 78.9%, and 75.0%, respectively.Discussion
Radiomics enables the high-throughput extraction and analysis of numerous quantitative image features. Tumor features are extracted from ROIs through image segmentation, gray histogram analysis, and evaluation of tumor shape, texture, and location of surrounding tissues[4]. These features can be reclassified to provide unique information for different departments, such as information on tumor subtype for radiology to enable early diagnosis and information on molecular markers for neurosurgery to facilitate treatment selection. Compared with previous radiomic techniques, our method can screen different batches of features through one feature extraction, provide customized analysis models for different departments, and achieve good diagnostic performance.Conclusion
We developed two radiomic models to non-invasively distinguish the two subtypes of AGs and predict the 1p19q status. The models may significantly assist radiologists in their clinical practice.Acknowledgements
This study was supported by the National Natural Science Foundation of China (Grant 81772009), the Scientific and Technological Research Project of Henan Province (Grant 182102310162), the Medical Science and Technology Research Project of Henan Province(Grant: 201702070)References
[1] Liu S , Wang Y , Fan X , et al. Association of MRI-classified subventricular regions with survival outcomes in patients with anaplastic glioma. Clinical Radiology, 2017, 72(5):426.e1-426.e6.
[2] Hui Z, Hastie T. Regularization and variable selection via the elastic net. Journal of the Royal Statistical Society, 2005, 67(5):768-768.
[3] Duan K B , Rajapakse J C , Wang H , et al. Multiple SVM-RFE for Gene Selection in Cancer Classification With Expression Data. IEEE Transactions on NanoBioscience, 2005, 4(3):228-234.
[4] Robert J Gillies, Paul E Kinahan, Hedvig Hricak. Radiomics: Images Are More than Pictures, They Are Data[J]. Radiology, 2015, 278(2):151169.
Figures