2029
Texture analysis based on ADC maps and T2-FLAIR images in prognosis of ischemic stroke1Department of Radiology, Minhang Hospital, Fudan University, Shanghai, China, 2United Imaging Healthcare, MR collaboration, Shanghai, China, 3Department of Neurology, Minhang Hospital, Fudan University, Shanghai, China, 4Department of Electronic Engineering, Fudan University, Shanghai, China
Synopsis
Ischemic stroke is characterized by the sudden loss of blood circulation to an area in the brain. Conventional imaging methods, including CT and MR, were difficult to evaluate and quantify the surface patterns of lesions. As textural features could serve as quantitative biomarkers of variation in surface intensity or patterns, in this study, we explored the feasibility of texture analysis (TA) based on T2-weighted fluid-attenuated inversion recovery (T2-FLAIR) as well as apparent diffusion coefficient (ADC) in predicting the prognosis of ischemic stroke. Our results indicated that the texture features could differentiate minor stroke from severe stroke, and detect functional outcomes.
Introduction
In stroke cases, ischemic stroke approximately accounts for 80% [1, 2]. Timely and appropriate treatment of ischemic stroke based on accurate diagnosis is of a high importance to patients. Conventionally, both computer tomography (CT) imaging and magnetic resonance (MR) imaging have been widely applied for stroke diagnosis [3]. However, the surface patterns of lesions are difficult to evaluate and quantify directly with conventional medical imaging. To our knowledge, textural properties represent a variety of information that quantify the variation in surface intensity or patterns [4]. In the evaluation of stroke, texture analysis (TA), could assist in revealing the changes caused by infarction as well as predicting hemorrhagic transformation [5, 6]. Nevertheless, it is uncertain whether the homogeneity, complexity and other texture features of infarct lesions are correlated to the prognosis of stroke. In our study, we aimed to explore the feasibility of texture analysis based on T2-weighted fluid-attenuated inversion recovery (T2-FLAIR) and Diffusion-weighted imaging (DWI) to predict the severity and prognosis of ischemic stroke.Method
A cohort of 116 patients diagnosed with ischemic stroke was enrolled in our study. Demographic, baseline NIHSS score on admission (NIHSSbaseline), 24 hours after stroke onset (NIHSS24h) and modified Rankin scale (mRS) score were collected. For lesion severity, patients were divided into minor stroke (NIHSS score< 6) and severe stroke (NIHSS score≥6) group. For functional outcome, patients were dichotomized into good outcome (mRS score = 0, 1, 2) or poor outcome (mRS score = 3, 4, 5) group. All imaging data were collected at a 3.0T MRI scanner (uMR780; United Imaging Healthcare, Shanghai, China). T1-weighted fast spin echo (FSE), T2-weighted FSE, T2-FLAIR and DWI sequences were conducted. Apparent diffusion coefficient (ADC) maps were calculated from corresponding DWI imaging (b = 0 and b = 1000 s/mm2) in a commercial work station (uWS-MR). The regions of interest (ROIs) were manually delineated to contain the largest area of stroke lesions (Figure 1). Based on T2-FLAIR image and ADC map, 16 texture features were extracted from the ROI of each patient using gray-level co-occurrence (GLCM) and local binary pattern histogram Fourier (LBP-HF) methods. The correlations of NIHSSbaseline, NIHSS24h and mRS with the texture features were evaluated using the Spearman’s test, separately. The receiver operating characteristic curve (ROC) was used to compare the performance of the selected texture features in the evaluation of stroke severity (minor versus severe stroke) and prognosis (good outcome versus bad outcome). All reported P-values were based on two-tailed tests and P-values under 0.05 were considered statistically significant.Result
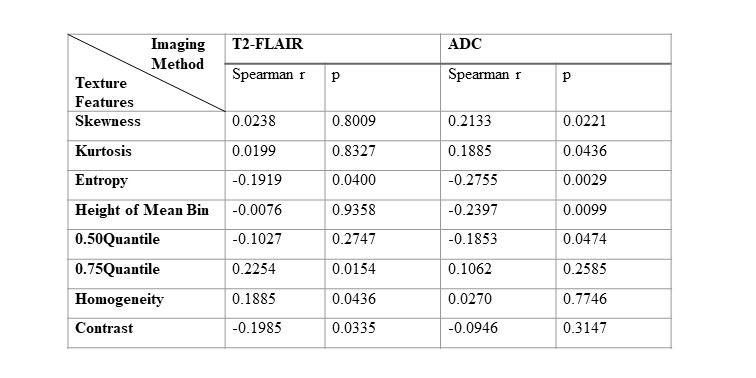
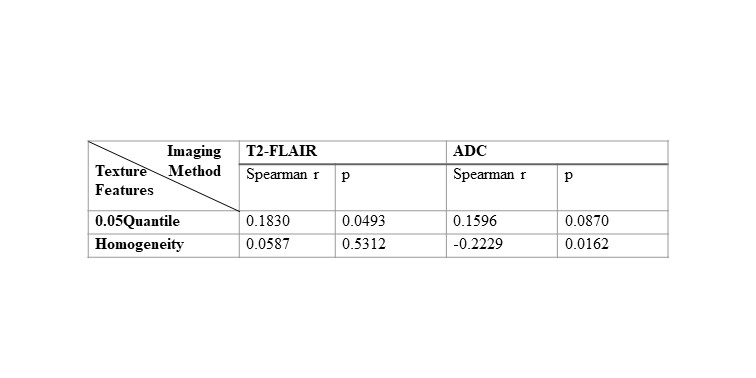
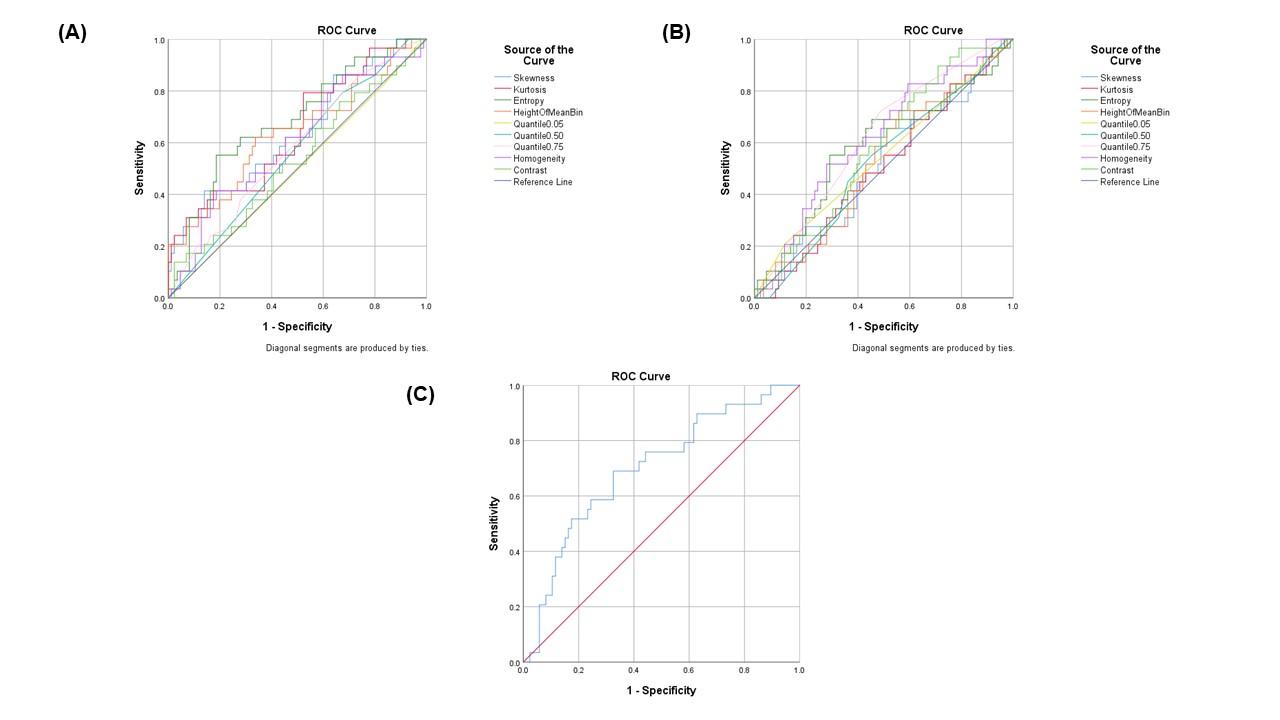
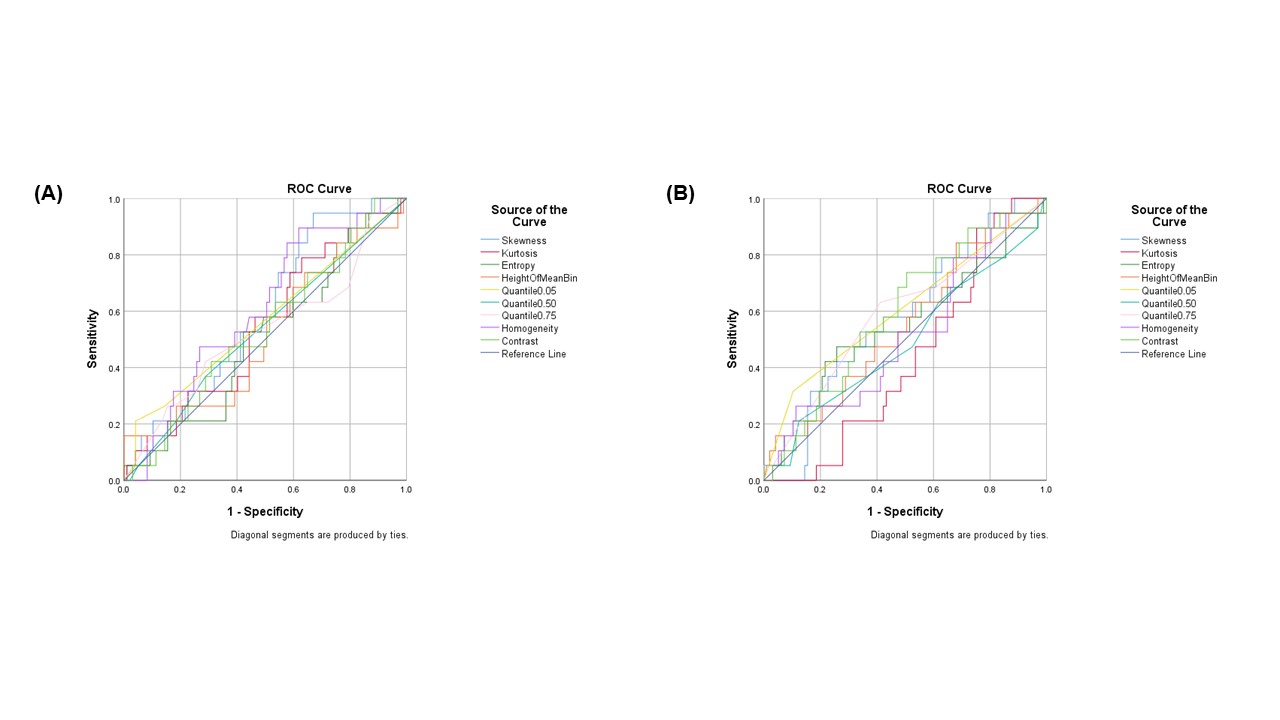
Four texture features derived from T2-FLAIR (Entropy, 0.75 Quantile, Homogeneity and Contrast) and four texture features derived from ADC (Skewness, Kurtosis, Entropy, Height of mean bin) were significantly correlated with NIHSSbaseline (Table 1). Four texture features derived from T2-FLAIR (Entropy, 0.75 Quantile, Homogeneity and Contrast) and five texture features derived from ADC (Skewness, Kurtosis, Entropy, Height of mean bin and 0.50 Quantile) were significantly correlated with NIHSS24h (Table 2). One texture feature derived from T2-FLAIR (0.05 Quantile) and one texture feature derived from ADC (Homogeneity) were significantly correlated with mRS (Table 3). Based on ADC map (Figure 3(A)), Entropy was the most valuable feature to predict the NIHSSbaseline (AUC = 0.638, p = 0.027). While based on T2-FLAIR image (Figure 3(B)), 0.75Quantile was the most valuable one (AUC = 0.620, p = 0.054). A joint of EntropyADC and 0.75QuantileT2-FLAIR resulted in a better performance in prediction of stroke severity (AUC=0.7, p = 0.01) than either feature used alone (Figure 3(C)). The same result was found in evaluation of the performance of texture features to predict NIH24h. No predictive performance was noted when using the texture features to predict mRS (Figure 4).Discussion
Our results showed that lesion severity was positively correlated with texture feature ‘homogeneity’ derived from T2-FLAIR. The probably explanation is that higher Blood-Brain Barrier (BBB) leakage would make the texture of the signal in the abnormal tissues smoother due to an increased BBB leakage uniformly distributed across the tissues [7]. Compared with T2-weighted imaging, ADC had a higher sensitivity for lesion detection [8, 9]. According to the literatures, the change in signal intensity on the ADC map and quantitative analysis of the ADC values may help predict HT in patients with early ischemic infarction [10, 11]. Previous study indicated that a more obvious decrease in ADC values usually links to a higher risk of bleeding [11], which probably explain our positive correlation results of skewness and kurtosis between NIHSS score. However, there was no predictive performance using texture features to predict mRS. It could be probably attributed to the fact that besides the characteristics of the lesion itself, functional outcomes could also be affected by multiple factors, such as age, history of prior stroke, initial neurologic deficit, and lesion location [12]. The current study still has some limitations. The clinical scores used were incomplete and study power regarding causality are limited by the retrospective study design.Conclusion
This study sheds new light on predicting the prognosis of ischemic stroke. Our results suggested that using textual analysis based on T2-FLAIR and ADC could predict the severity of stroke and detect functional outcomes.Acknowledgements
No acknowledgement found.References
1. Kumar, A., et al., Stroke Progression. 2015. 3(3): p. 60-64.
2. R Tan, J., et al., microRNAs in stroke pathogenesis. 2011. 11(2): p. 76-92.
3. Vilela, P. and H.A.J.E.j.o.r. Rowley, Brain ischemia: CT and MRI techniques in acute ischemic stroke. 2017. 96: p. 162-172.
4. Kassner, A. and R. Thornhill, Texture analysis: a review of neurologic MR imaging applications. American Journal of Neuroradiology, 2010. 31(5): p. 809-816.
5. Sikiö, M., et al., MRI texture analysis and diffusion tensor imaging in chronic right hemisphere ischemic stroke. 2015. 25(4): p. 614-619.
6. Kassner, A., et al., Prediction of hemorrhagic transformation in acute ischemic stroke using texture analysis of postcontrast T1‐weighted MR images. 2009. 30(5): p. 933-941.
7. Valdés Hernández, M.d.C., et al., application of Texture analysis to study small Vessel Disease and Blood–Brain Barrier integrity. 2017. 8: p. 327.
8. Na, D.G., et al., Diffusion-weighted MR imaging in acute ischemia: value of apparent diffusion coefficient and signal intensity thresholds in predicting tissue at risk and final infarct size. 2004. 25(8): p. 1331-1336.
9. Shen, J.-M., et al., The use of MRI apparent diffusion coefficient (ADC) in monitoring the development of brain infarction. 2011. 11(1): p. 2.
10. Oppenheim, C., et al., DWI prediction of symptomatic hemorrhagic transformation in acute MCA infarct. Journal of neuroradiology. Journal de neuroradiologie, 2002. 29(1): p. 6-13.
11. Chen, L.-P., et al., Apparent diffusion coefficient value for prediction of hemorrhagic transformation in acute ischemic infarction. INTERNATIONAL JOURNAL OF CLINICAL AND EXPERIMENTAL MEDICINE, 2018.11(1): p. 109-117.
12. Macciocchi, S.N., et al., Ischemic stroke: relation of age, lesion location, and initial neurologic deficit to functional outcome. 1998. 79(10): p. 1255-1257.
Figures
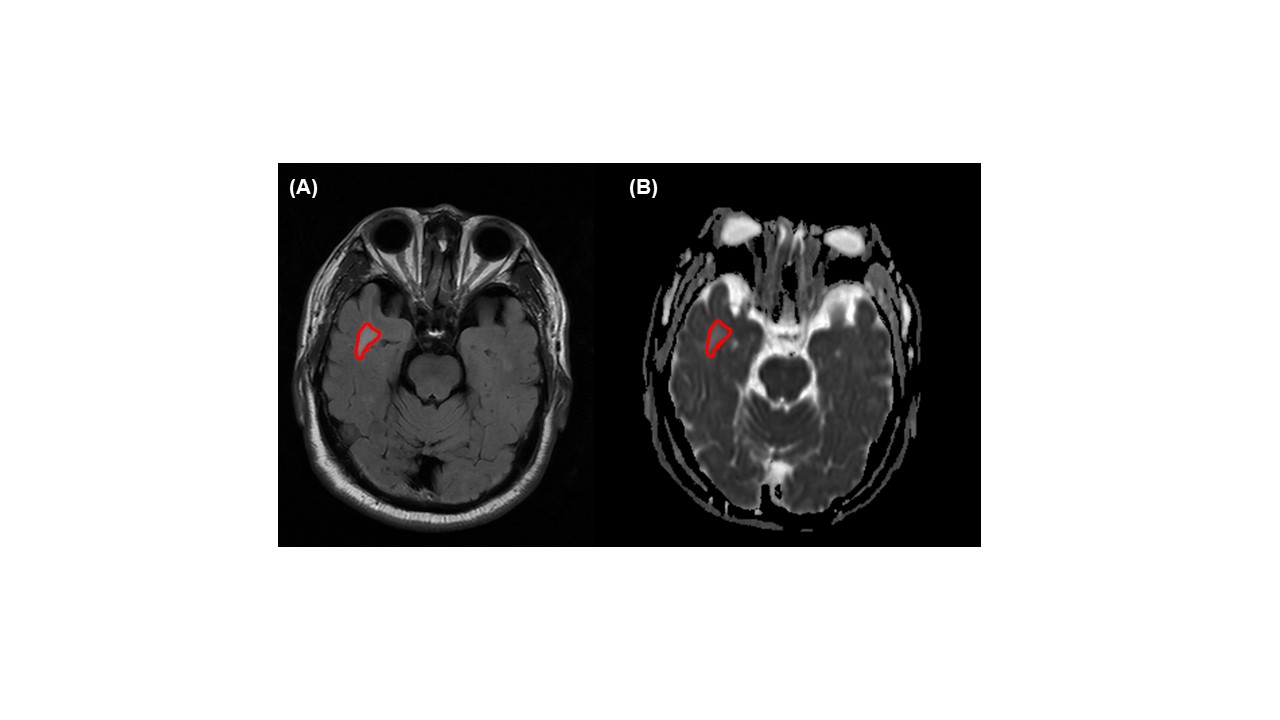
Figure 1. Representative MRI images of ischemic stroke patients. (A) T2-FLAIR images (B) ADC map. Note: The regions of interest (ROIs) were delineated to contain the largest area of stroke lesions (red curve).
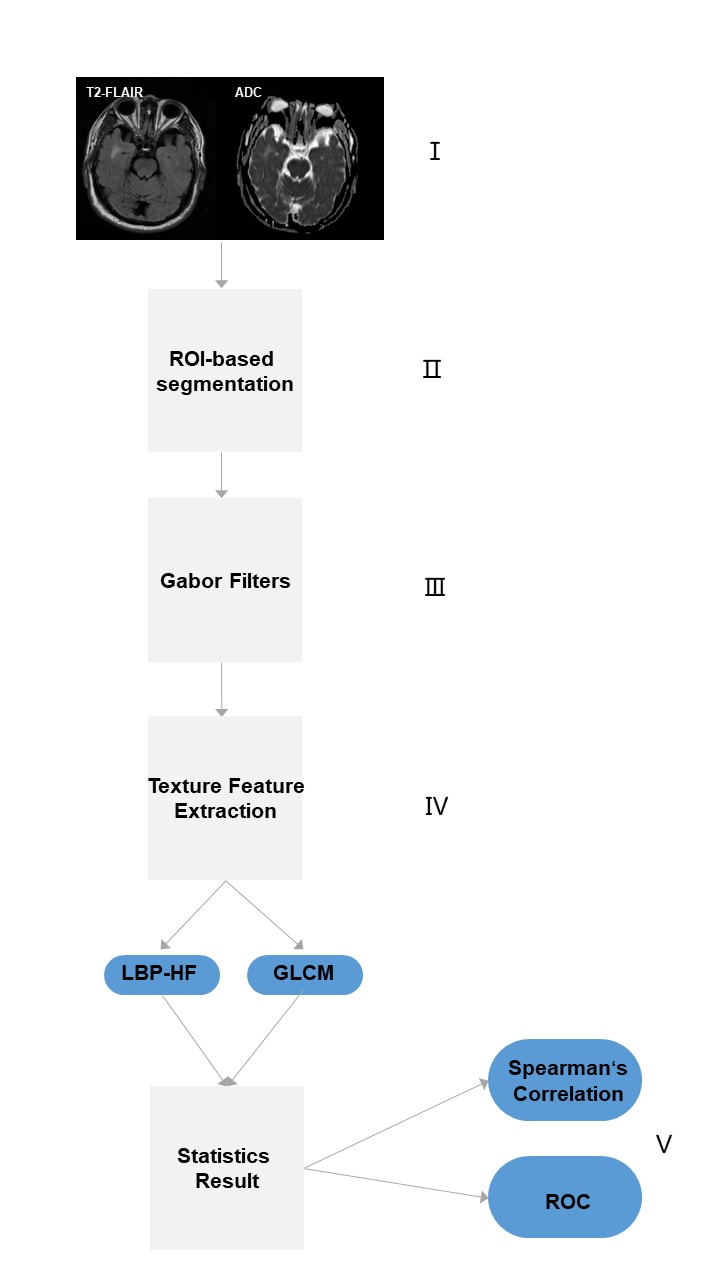
Figure 2. Image analysis processing pipeline: Ⅰ. ADC map and T2-FLAIR image acquisition; Ⅱ. ROI-based segmentation of abnormal tissues; Ⅲ. Images filtering; Ⅳ. Texture feature extraction; Ⅴ. Finally statistics analysis.