2028
Suitability of Deep Weakly-supervised Learning to Detect Acute Ischemic Strokes and Hemorrhagic Infarctions Using Diffusion-weighted Imaging
Chen Cao1,2, Zhiyang Liu3, Guohua Liu3, Jinxia Zhu4, Song Jin1, and Shuang Xia5
1Key Laboratory for Cerebral Artery and Neural Degeneration of Tianjin, Radiology Department, Tianjin Huanhu Hospital, Tianjin, China, 2Radiology Department, First Central Clinical College, Tianjin Medical University, Tianjin, China, 3Tianjin Key Laboratory of Optoelectronic Sensor and Sensing Network Technology, College of Electronic Information and Optical Engineering, Nankai University, Tianjin, China, 4MR Collaboration, Siemens Healthcare Ltd, Beijing, China, 5Radiology Department, Tianjin First Central Hospital, Tianjin, China
1Key Laboratory for Cerebral Artery and Neural Degeneration of Tianjin, Radiology Department, Tianjin Huanhu Hospital, Tianjin, China, 2Radiology Department, First Central Clinical College, Tianjin Medical University, Tianjin, China, 3Tianjin Key Laboratory of Optoelectronic Sensor and Sensing Network Technology, College of Electronic Information and Optical Engineering, Nankai University, Tianjin, China, 4MR Collaboration, Siemens Healthcare Ltd, Beijing, China, 5Radiology Department, Tianjin First Central Hospital, Tianjin, China
Synopsis
We hypothesized that deep weakly-supervised learning could detect acute ischemic stroke (AIS) and hemorrhagic infarction (HI) lesions using diffusion-weighted imaging. Each image slice was assigned an annotation indicating whether or not the slice contained a lesion. The proposed method was trained on an AIS dataset using 417 patients with weakly-labeled lesions and evaluated on a dataset using 319 patients with fully-labeled lesions, which detected lesions with high accuracy. The method was trained on a HI dataset using 240 patients with weakly-labeled lesions and evaluated using 65 patients with fully-labeled lesions. Lesion detection sensitivities were 87.7% (AISs) and 86.2% (HIs).
Background and Purpose
Acute ischemic strokes (AISs) rank as the leading cause of death in China. Hemorrhagic infarctions (HIs), as a complication of AISs, can occur before any treatment, and could seriously influence patient prognosis if not detected in a timely manner.1 Diffusion-weighted imaging (DWI) should be routinely performed in patients with clinical suspicion for AISs. Identifying HIs with the naked eye is more difficult in b0 images than in T2*-weighted imaging; however, T2*-weighted imaging usually takes several minutes to perform and prolongs the examination time for AIS patients. Previous research looking at the automated detection of AISs is typically performed based on fully-supervised deep learning.2 Fully-supervised deep learning might not be universally performed because the manual labeling of images is time-consuming. The purpose of this study was to evaluate a deep weakly-supervised learning method in terms of AIS and HI detection using DWI.Methods
In this study the magnetic resonance (MR) images of 736 patients with AISs and 305 patients with HIs were randomly divided into independent training set and test set. To detect whether weakly-supervised learning is affected by the size and location of the lesion, the subjects in the test set were carefully divided into the no-lacunar-lesion (Non-LI) group and lacunar-lesion groups (including pons (LI-P) group, basal ganglia (LI-B) group, and semi-oval center (LI-C) group). MR measurements were acquired from three MR scanners, with two 3T MR scanners (MAGNETOM Skyra and MAGNETOM Trio a Tim System, Siemens Healthcare, Erlangen, Germany) and one 1.5T MR scanner (MAGNETOM Avanto, Siemens, Erlangen, Germany). Two convolutional neural networks, the residual neural (ResNet) and visual geometry group (VGG) networks, were trained on an AIS dataset from 417 patients with weakly-labeled lesions and evaluated on an AIS dataset from 319 patients with fully-labeled lesions, which detected lesions with high accuracy. For the HI datasets, 240 patients with weakly-labeled lesions were used for training, and 65 patients with fully-labeled lesions were used for evaluations.The area under the receiver operating characteristic (ROC) curve (AUC), sensitivity, precision, mean number of false-positive lesions (mFP-L), mean number of false-negative lesions (mFN-L), and the number of failure-to-detect subjects (FD-S) of two methods were calculated and compared. Next, the method proven to be superior in the previous step was also applied to an HI dataset. Fig. 1 shows the network architecture for lesion detection.
Results
As seen in Fig. 2A, both networks were superior in being able to identify lesions in the AIS image slices. Fig. 2B shows the dependence between the mFN-L and mFP-L of the ResNet and VGG networks in the test dataset. As we can see in Table 1, the ResNet network performed better in the tradeoff curve. The ResNet network showed a higher sensitivity and lower misdiagnosis rate compared with the VGG network, especially for the LI-P group. In Fig. 3, we observed that the ResNet network also tended to be more precise in outlining the lesions. Since the ResNet network showed excellent AIS performance, it was also applied to HI detection. In Fig. 4, we show that the trained ResNet network could annotate the data of the AIS and HI groups. Table 1 shows that the detection efficiency of ResNet for HI lesions was consistent with that of AIS lesions. Lesion detection sensitivities were 87.7% for AISs and 86.2% for HIs.Discussion
Deep weakly-supervised learning has the potential to reduce image labeling workloads, provided that some easily annotated data is used in the training.3 The ResNet network provided more benefits compared with the VGG network. The sensitivity of the LI-P group in the VGG network was lower than that of the LI-B and LI-C groups, and 14 patients were identified as FD-S in the VGG network because of magnetic susceptibility artifacts.4 Since the ResNet network could access much deeper tissues and avoid a gradient vanishing problem,5 this network improved the sensitivity and precision of the LI-P group and reduced the FD-S down to 1. Therefore, the ResNet network was used in the HI detection study. As shown in Table 2, the ResNet network could sensitively detect both AIS and HI lesions. Three examples of plotted AIS and HI lesion class activation maps are shown in Fig. 4. It was difficult to find small HI lesions by observing b0 images with the naked eye, but the ResNet network could accurately label these lesions. This research demonstrated that deep weakly-supervised learning was very effective at detecting AIS and HI lesions using DWI.Acknowledgements
This work was supported in part by Natural Science Foundation of China (NSFC) (81771806, 81871342, 61871235) and in part by the Fundamental Research Funds for the Central Universities, Nankai University (63191106).References
- Zhu F, Labreuche J, Haussen DC, Piotin M, Steglich-Arnholm H, Taschner C, et al. Hemorrhagic transformation after thrombectomy for tandem occlusions. Stroke. 2019;50:516-519.
- Kim YC, Lee JE, Yu I, Song HN, Baek IY, Seong JK, et al. Evaluation of diffusion lesion volume measurements in acute ischemic stroke using encoder-decoder convolutional network. Stroke. 2019;50:1444-1451.
- Liu M, Zhang J, Lian C, Shen D. Weakly supervised deep learning for brain disease prognosis using mri and incomplete clinical scores. IEEE Trans Cybern. 2019.
- Lu J, Wang X, Zhao Q, Li Z, Zhang W, Liu Y, et al. Detectability and reproducibility of the olfactory fmri signal under the influence of magnetic susceptibility artifacts in the primary olfactory cortex.Neuroimage. 2018;178:S1053811918305159.
- Liu Z, Cao C, Ding S, Liu Z, Han T, Liu S. Towards clinical diagnosis: Automated stroke lesion segmentation on multi-spectral mr image using convolutional neural network. IEEE Access. 2018;6:57006-57016.
Figures
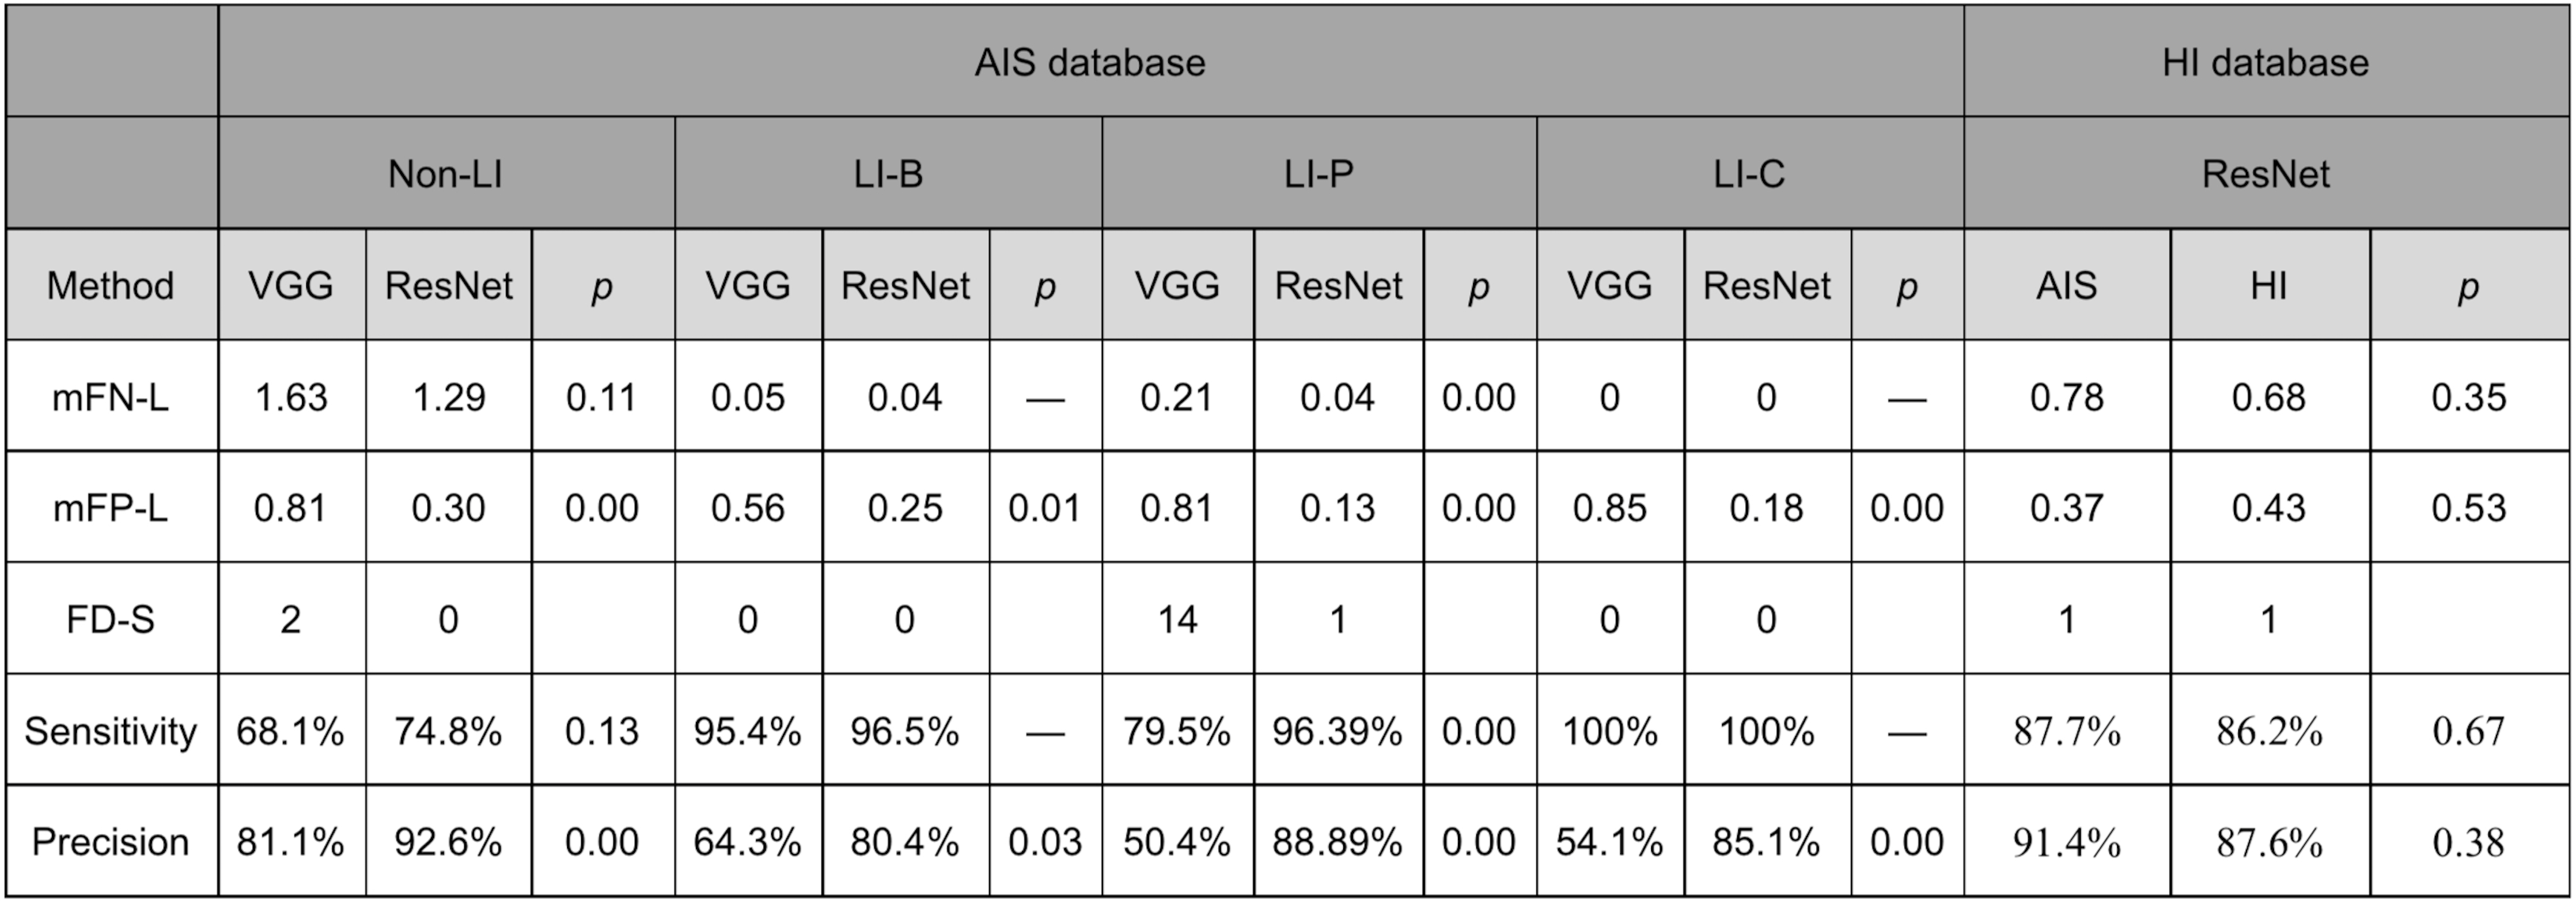
Table 1. Lesion identification performance of deep weakly-supervised learning on the acute ischemic stroke (AIS) and hemorrhagic infarction (HI) test sets. mFN-L, mean number of false negative lesions; mFP-L, mean number of false positive lesions; FD-S, the number of failure-to-detect subjects; Non-LI, no-lacunar-lesion group, LI-P lacunar-lesion (pons) group; LI-B, basal ganglia group; LI-C, semi oval center group; ResNet, residual neural network; and VGG, visual geometry group network.
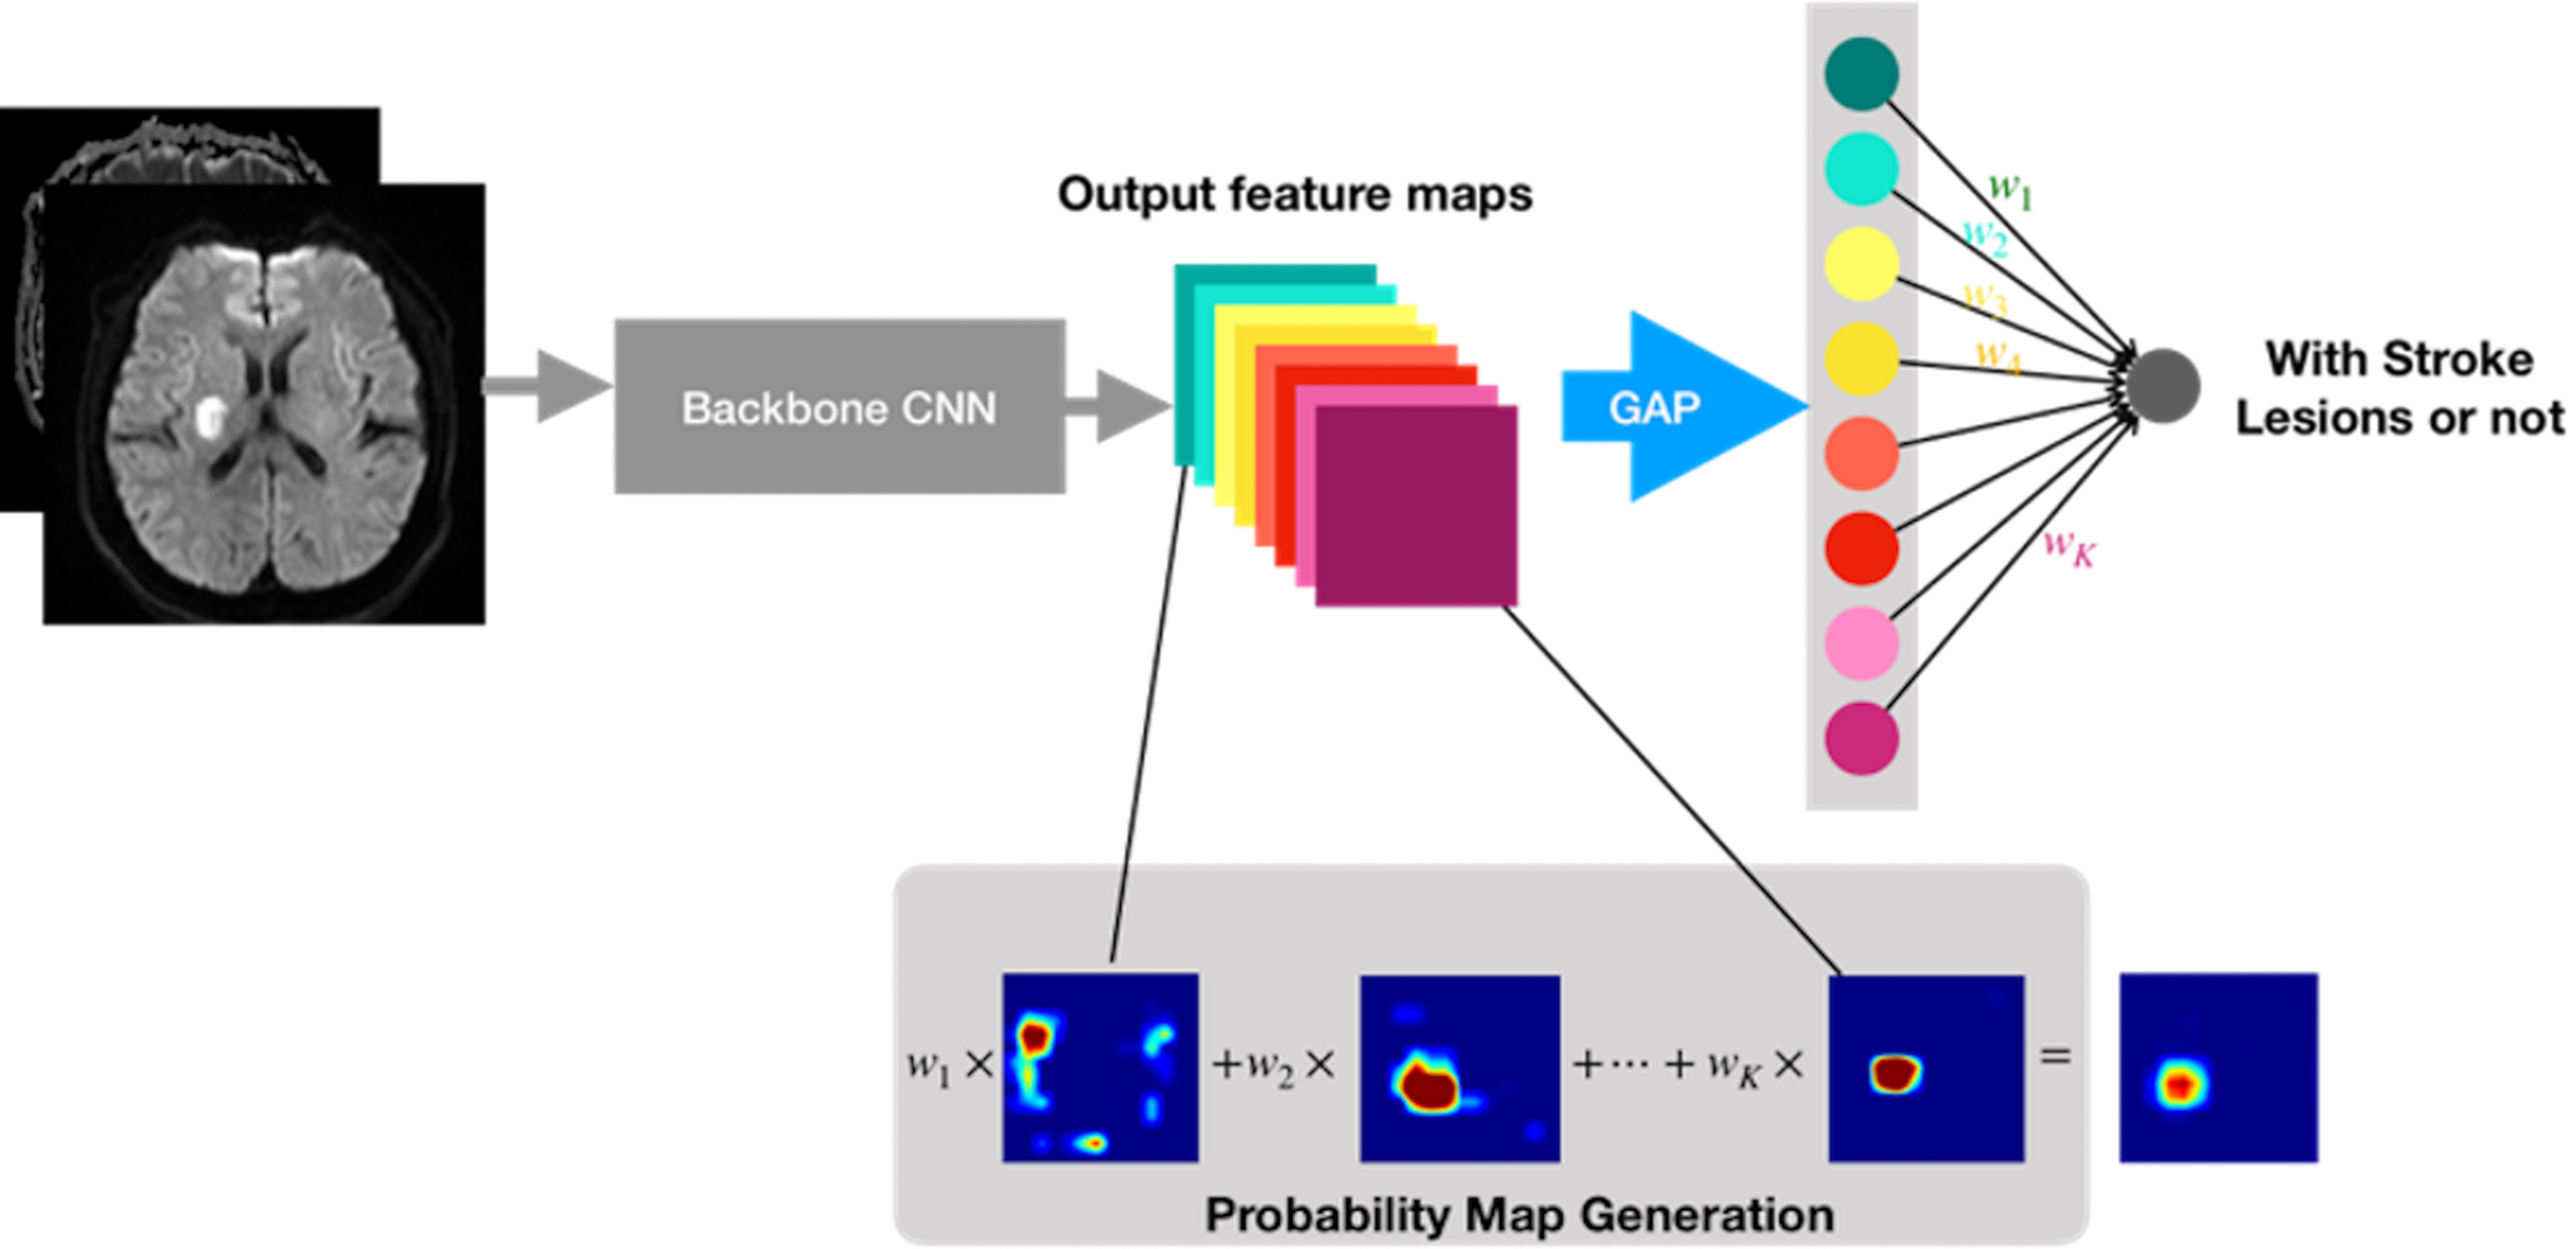
Figure 1. The network architecture for acute ischemic stroke (AIS) and hemorrhagic infarction (HI) lesion detection. CNN, convolutional neural network; GAP, global average pooling.
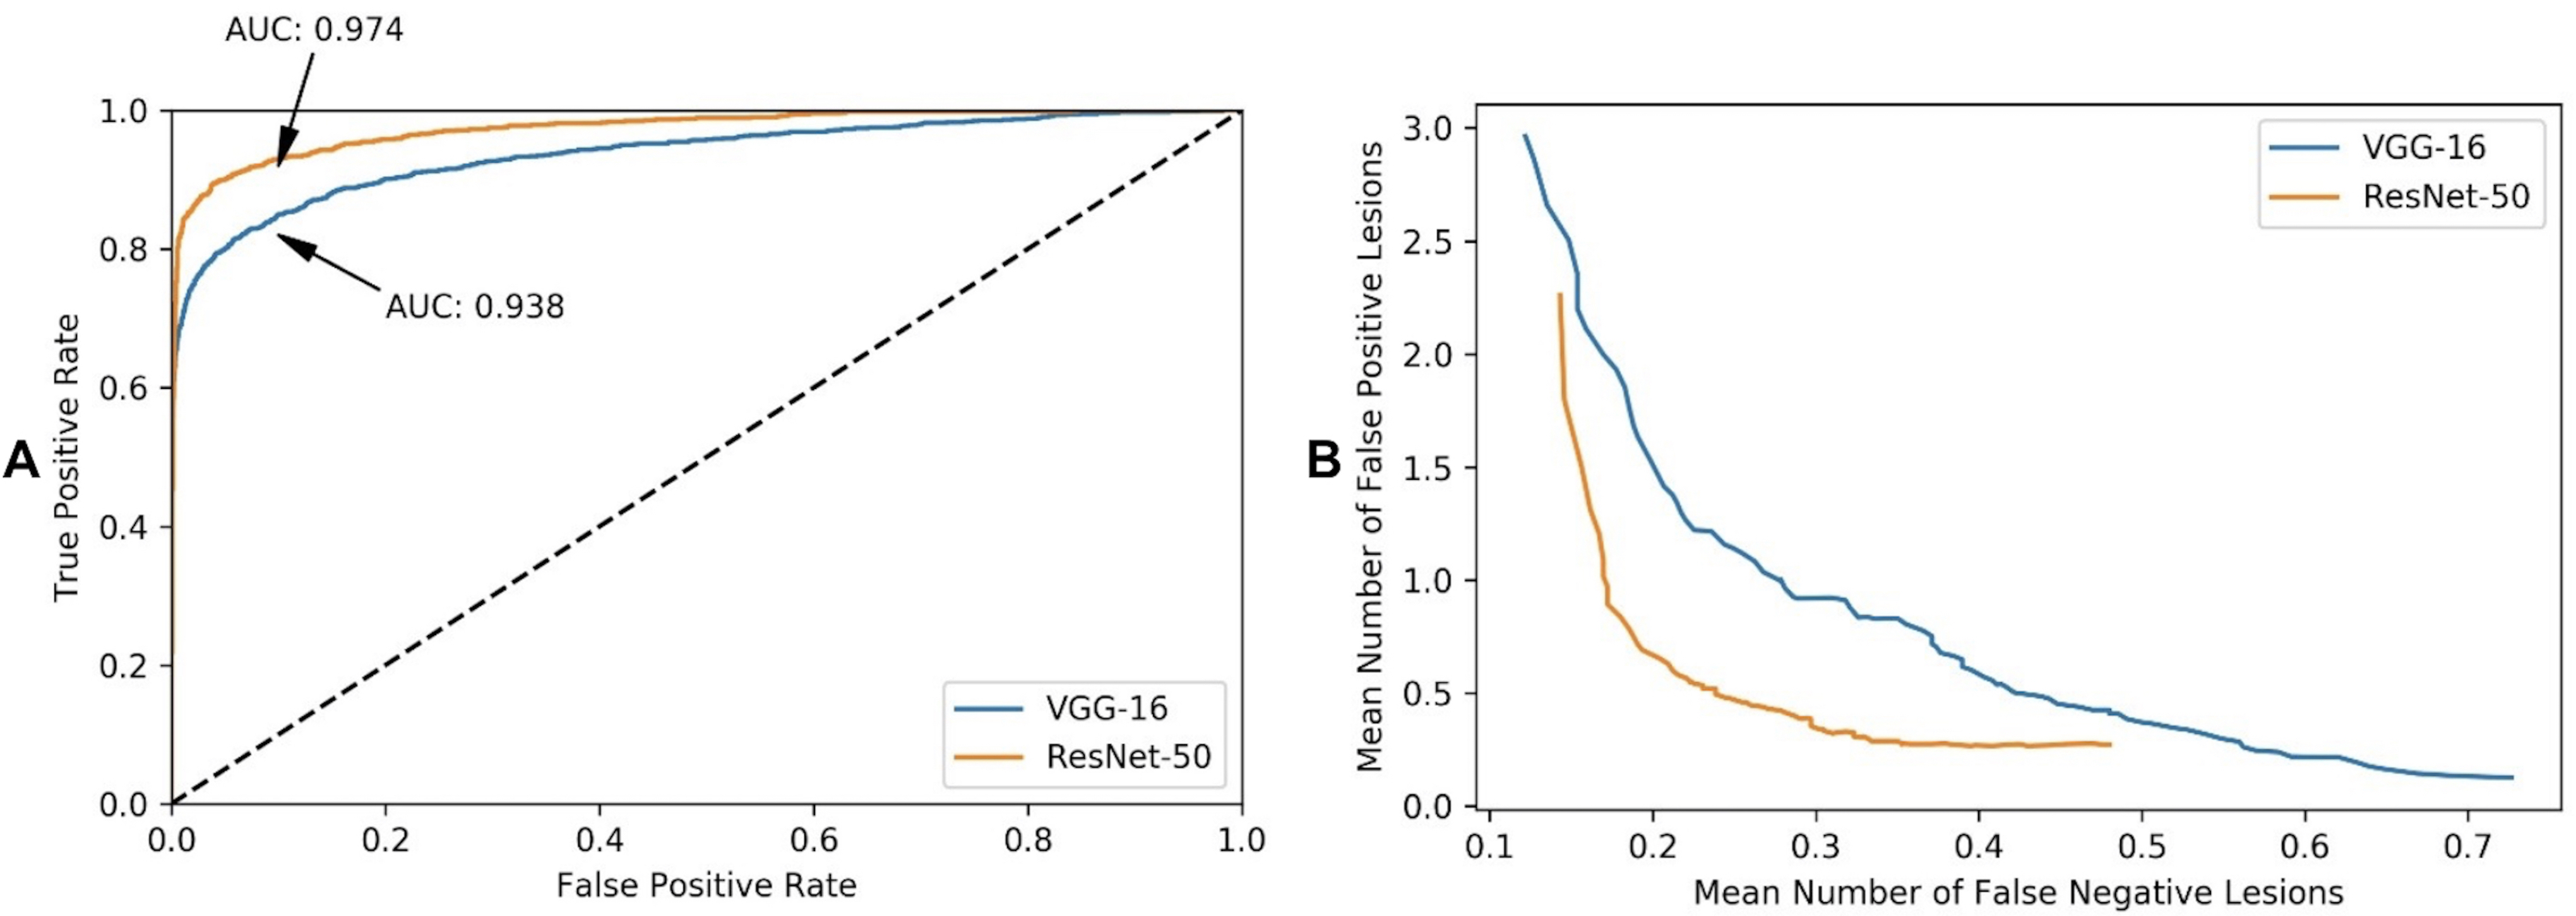
Figure 2. A. The ROC curve of the residual neural (ResNet) and visual geometry group (VGG) network classifiers shows the false positive rate (x-axis) vs. the true positive rate (y-axis). The areas under the ROC curve (AUCs) for the ResNet and VGG networks were both superior in being able to identify lesions in AIS image slices. B. The performance of the weakly-supervised lesion detection method in being able to detect lesions shows the dependence between the mean number of false-negative lesions (x-axis) vs. false-positive lesions (y-axis) in the AIS test dataset.
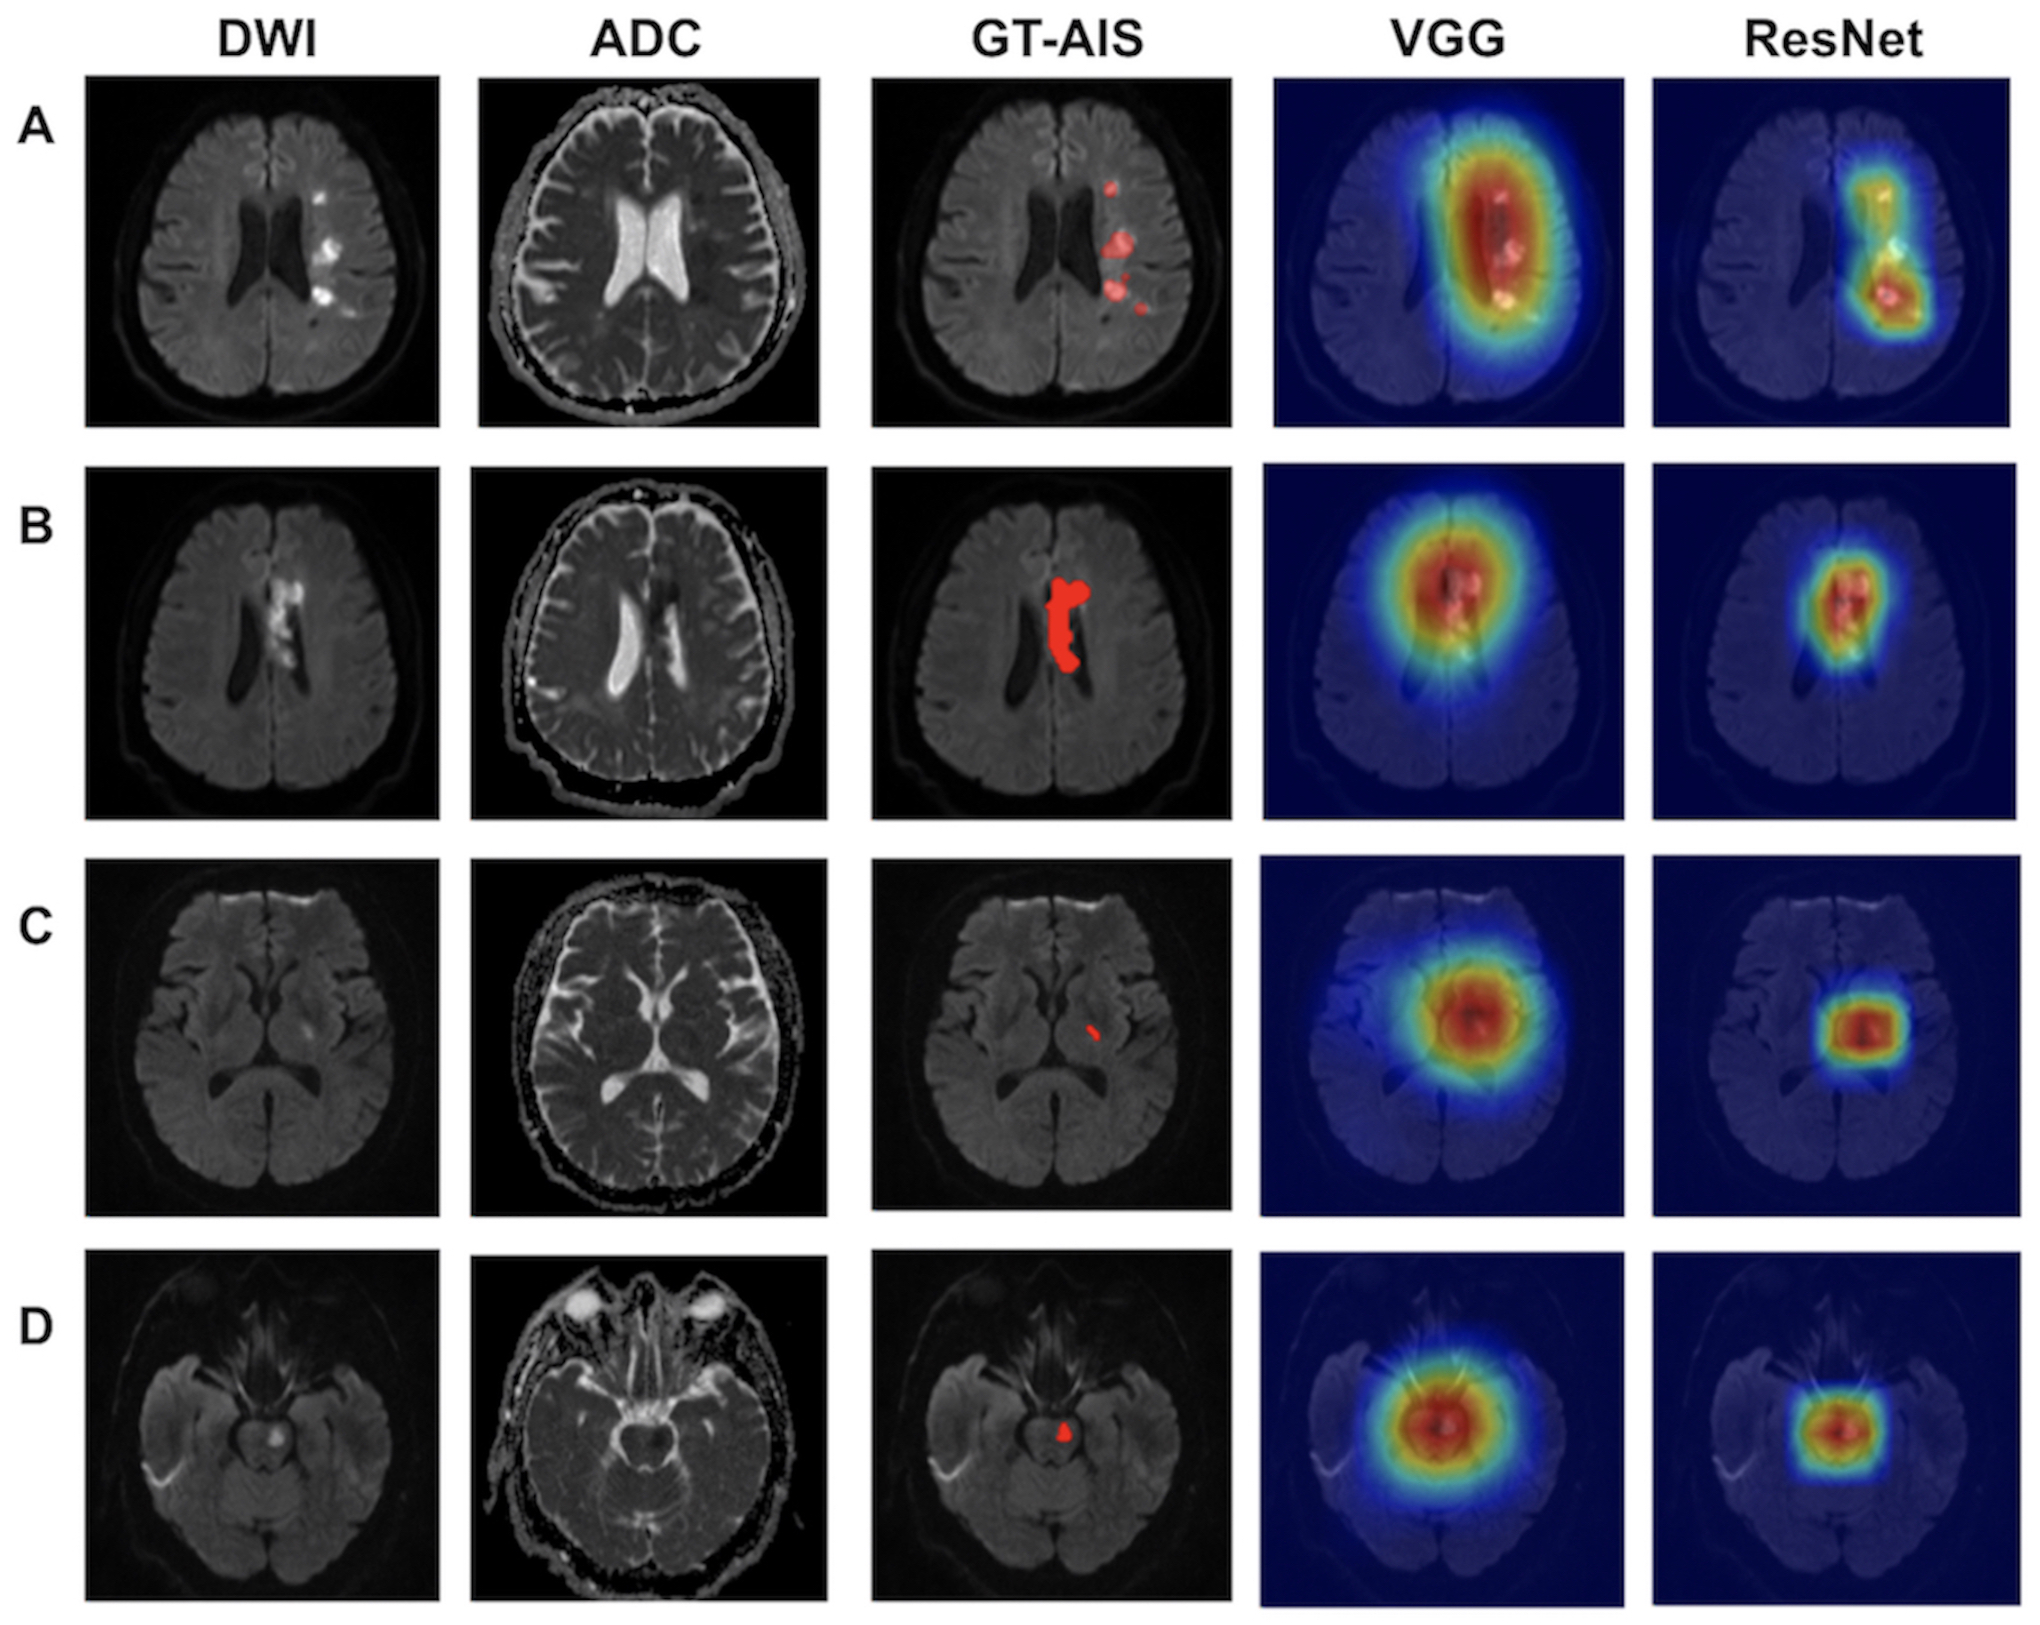
Figure 3. Lesion detection results using the weakly supervised method on 319 patients with acute ischemic strokes (AISs). Four patient examples are shown (A, B, C, D). The AIS lesions were annotated in red in the ground truth (GT) images. Subjects A and B belonged to the Non-LI groups, with multiple or large lesions. Subjects C and D belonged to the LI groups, which had lesions that were located in the basal ganglia and pons, respectively. DWI, diffusion-weighted imaging; ADC, apparent diffusion coefficient; and ResNet, residual neural network; and VGG, visual geometry group network.
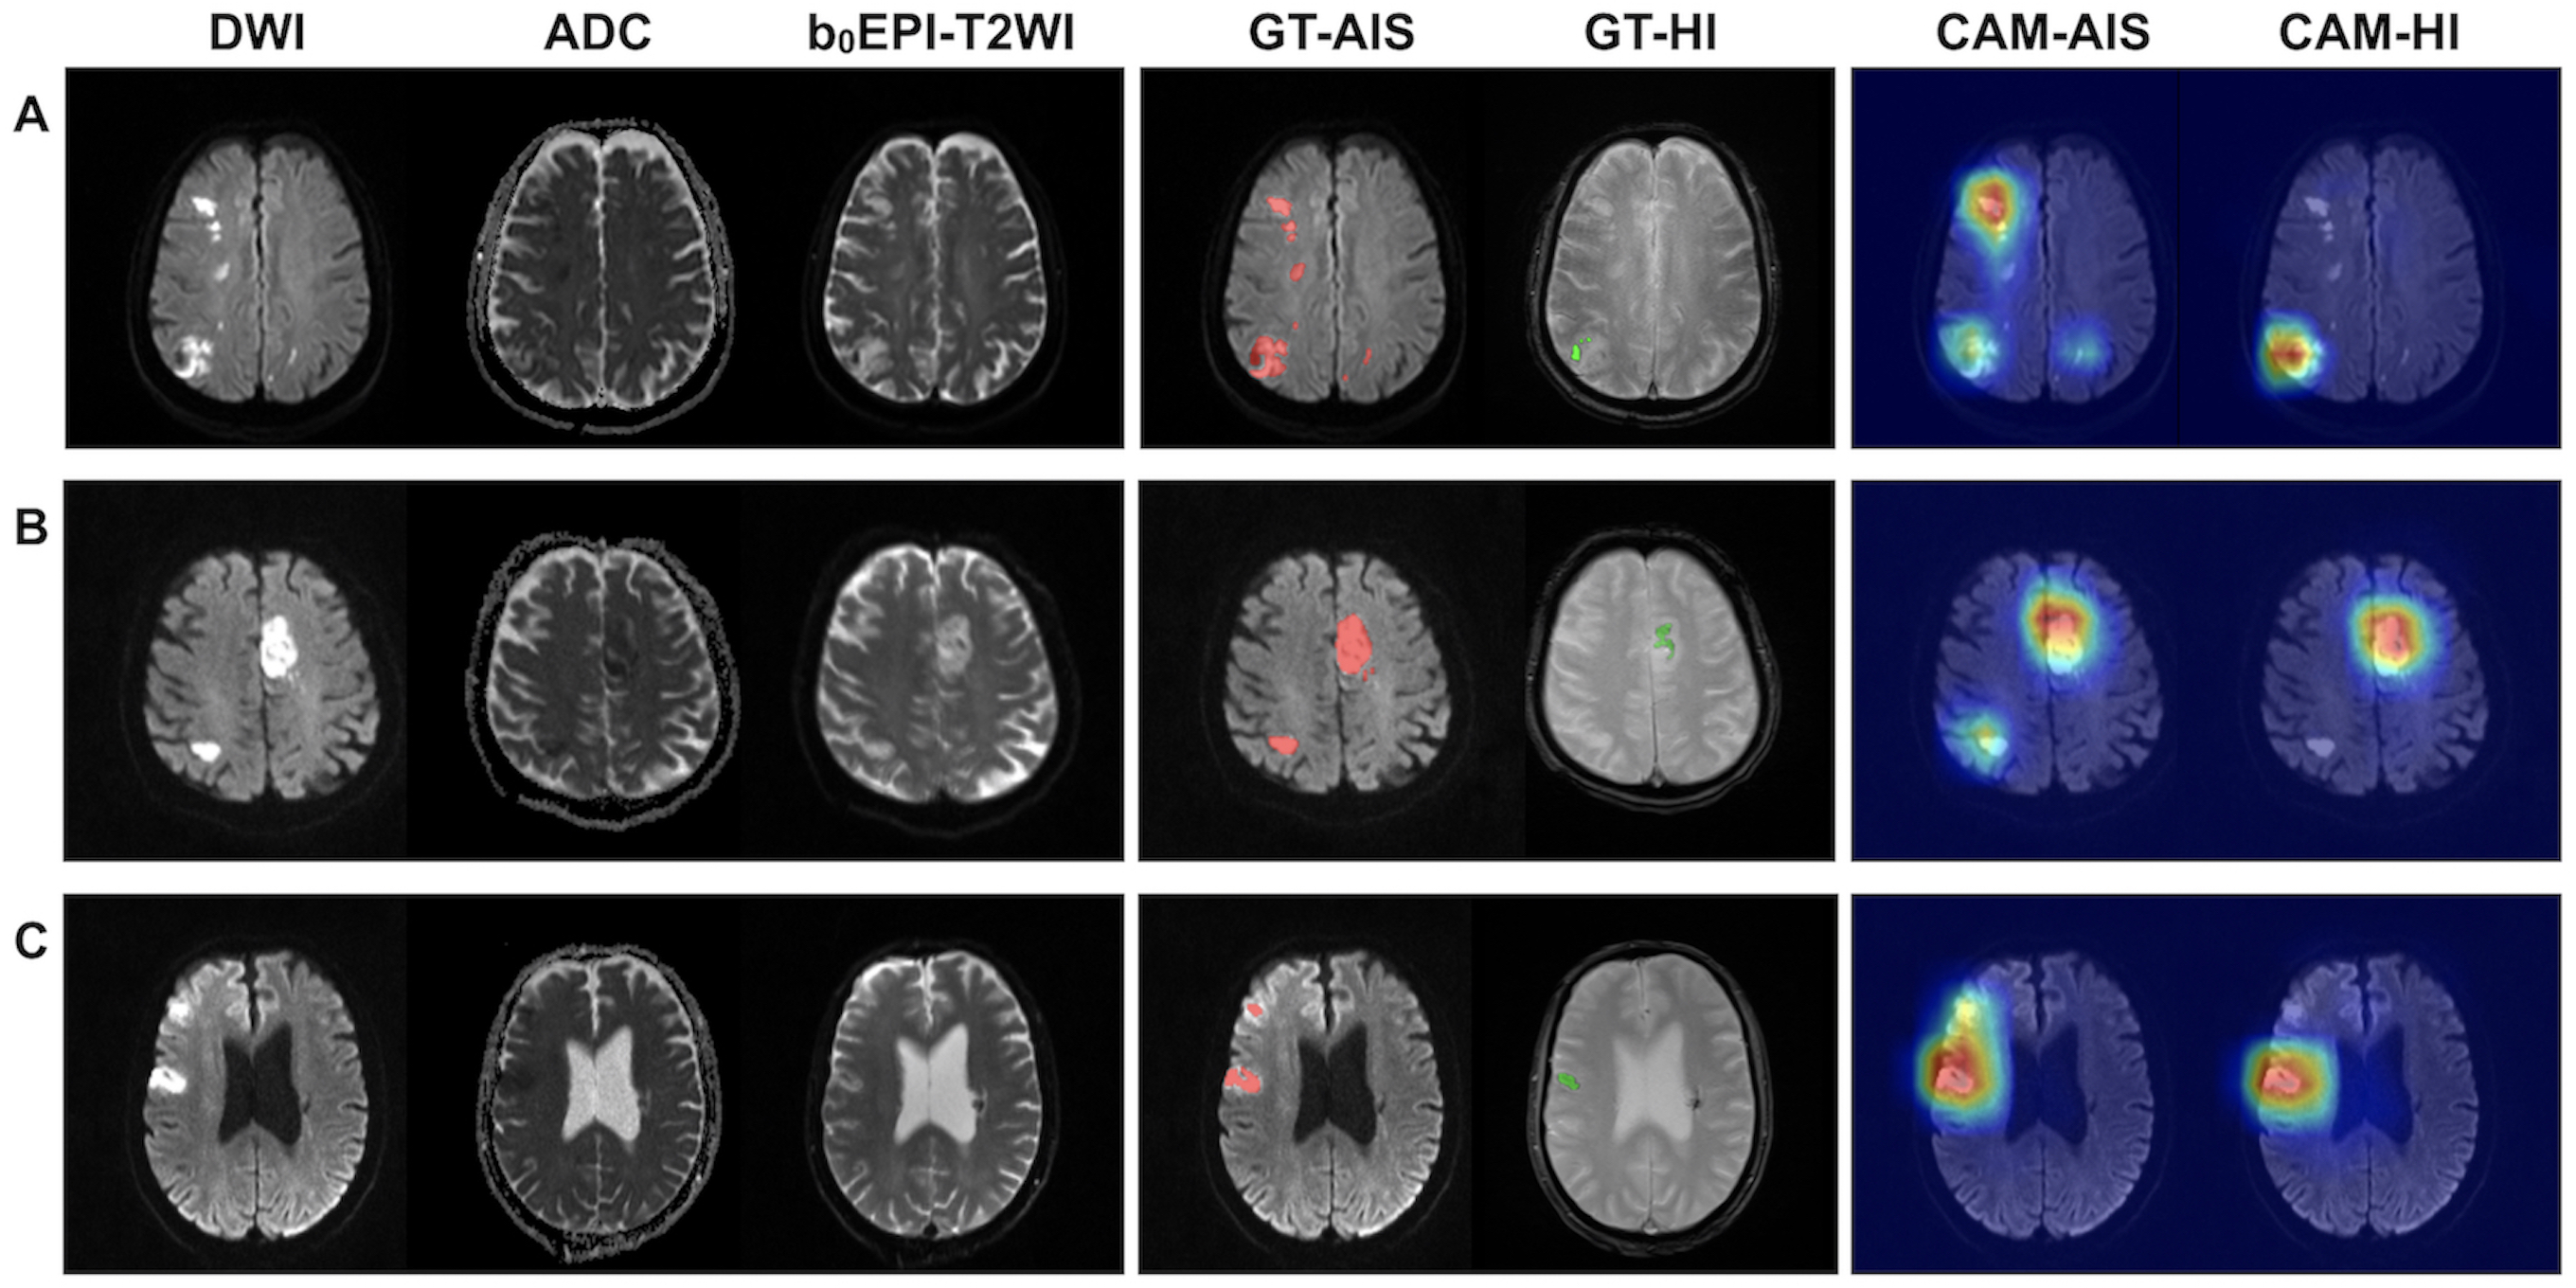
Figure 4. Three examples of HI patient imaging (A, B, and C). In the ground truth (GT) images, the acute ischemic stroke (AIS) lesions and the hemorrhagic infarction (HI) lesions were annotated in red and green, respectively. As we can observe in patients A and B, the residual neural (ResNet) network accurately marked multiple AIS lesions and distinguished AIS lesions from those of HI. Subject C had an old hemorrhagic lesion. The hemisphere contralateral to that of the AIS lesion and the lesion was not misdiagnosed as an HI lesion. CAM, class activation map.