2021
Simultaneous MR Neurography and Quantitative Mapping of the Lumbar Plexus Using Point-Spread-Function Encoded EPI1Department of Biomedical Engineering, Center for Biomedical Imaging Research, Beijing, China, 2Philips Healthcare, Beijing, China
Synopsis
The combination of MR neurography (MRN) and comprehensive quantitative MRI is of great clinical significance for pathological analysis of peripheral nerves. This study aims to investigate simultaneous MRN, T2, T2* mapping of lumbar plexus by using a distortion-free multishot technique, Point-Spread-Function Encoded EPI (PSF-EPI). Particularly, the quantitative T2 and T2* mapping are conducted by using the multiple echo-shifted intermediate images of PSF-EPI. Also, PSF-EPI can be highly accelerated by the titled-CAIPI acquisition scheme. The acquisition time can be reduced to around 2 minutes. The efficacy of PSF-EPI is demonstrated on healthy volunteers and patients.
Introduction
MR neurography (MRN) can depict 3D morphology of plexus and assist the detection of pathological changes (1). However, the underlying pathophysiology remains less examined using anatomical imaging. To acquire functional information of peripheral nerves, several quantitative MR approaches including diffusion weighted imaging (DWI) (2-4) and T2 mapping (5,6) have been attempted. This shows promising potentials for clinical evaluation and treatment of neuropathology. Nevertheless, DWI suffers from susceptibility-induced distortion and low SNR. Also, the conclusions on the ADC change of plexus in patients with neuropathies vary very much. Quant-SHINKEI achieves simultaneous neurography and T2 mapping but requires long scan time and complex implementation (5). Therefore, combination of MRN and comprehensive quantitative MRI is of great clinical significance.In this study, we adopted a distortion-free multi-shot EPI technique, Point-Spread-Function Encoded EPI (PSF-EPI) for simultaneous neurography imaging and T2, T2* mapping of the lumbar plexus. In particular, T2 mapping requires no extra scans or preparation pulses and is conducted using multiple echo-shifted intermediate images of PSF-EPI. The scan can be conducted in 2 minutes with tilted-CAIPI acceleration.
Theory
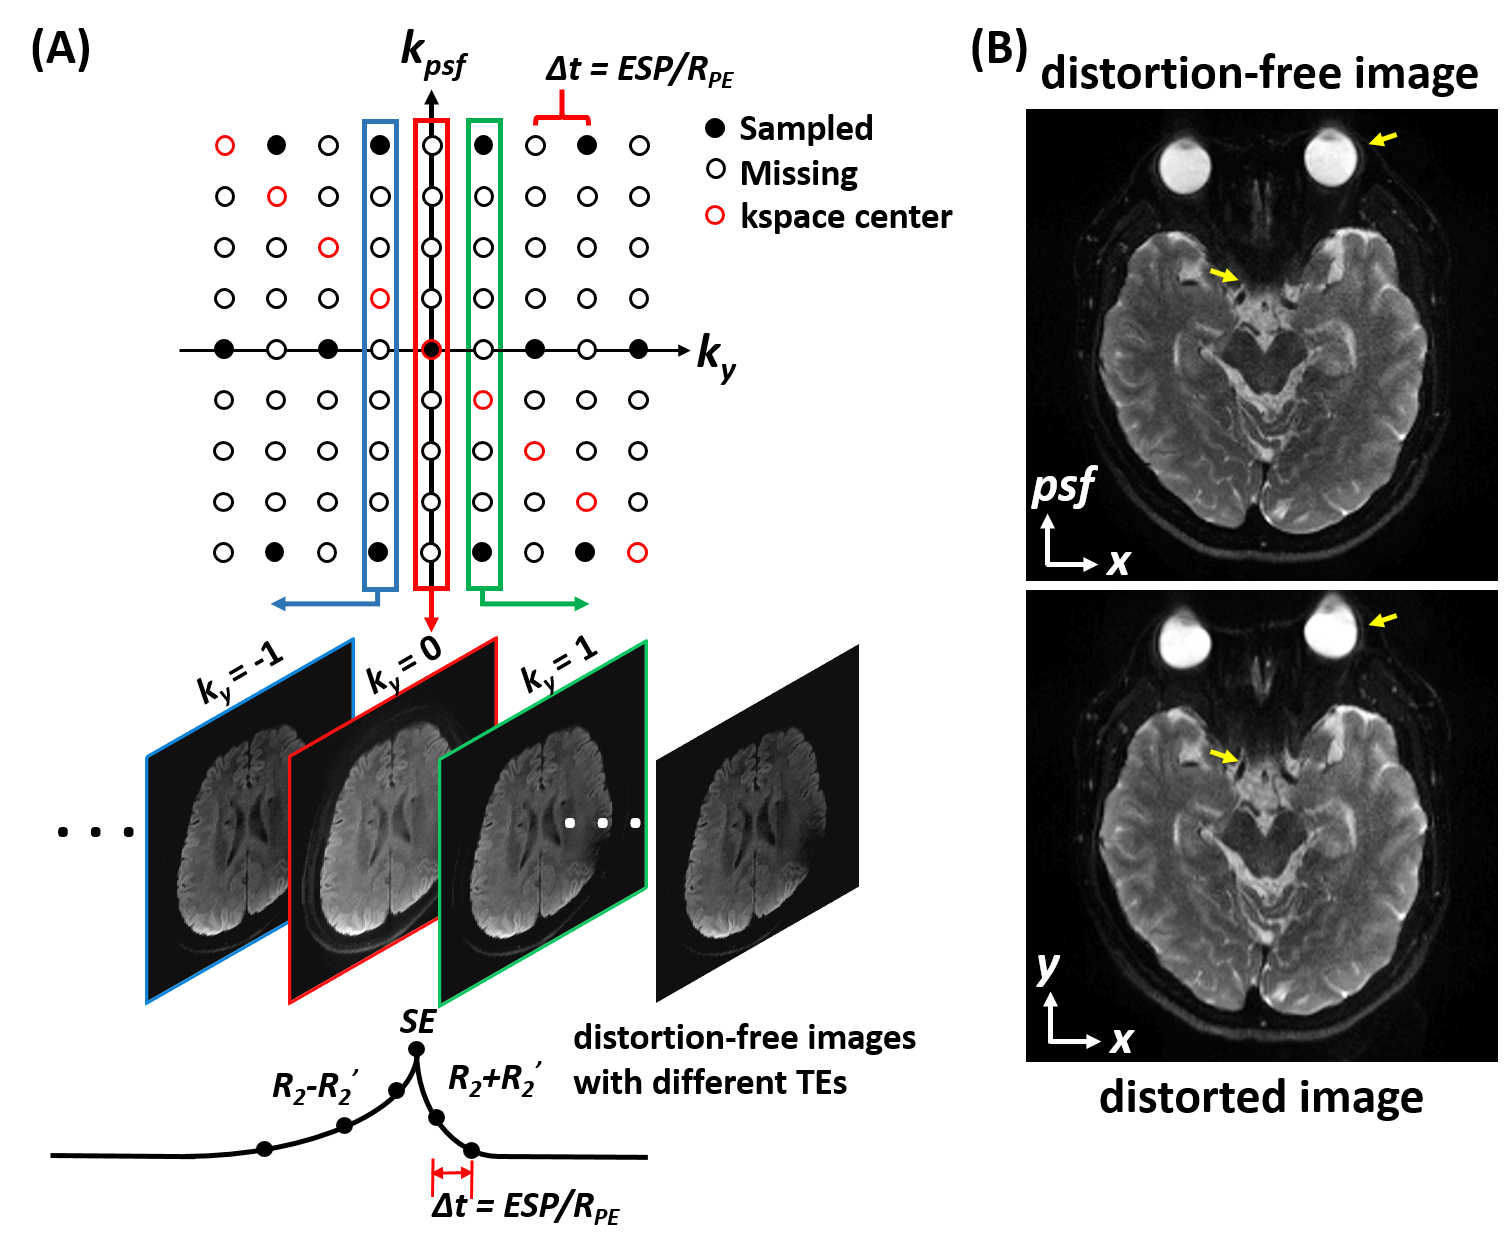
In PSF-EPI, an additional phase encoding (PE) is exerted step-wisely along the PE direction in the conventional 2D single-shot EPI (7). This encoding scheme generates a three dimensional k-space consisting of $$$k_x$$$ (readout), $$$k_y$$$ (EPI-PE) and $$$k_{psf}$$$ (PSF-PE) dimension. At a given $$$k_y$$$ in $$$k_x$$$-$$$k_{psf}$$$ plane, all signals across different $$$k_{psf}$$$ steps share the same echo time and thus the $$$x$$$-$$$psf$$$ images are T2* blurring- and distortion-free.The distortion-free images along $$$k_y$$$ are acquired at different TEs with an interval time shift of $$$Δt$$$ (effective echo spacing along $$$k_y$$$ ) (Figure 1A). Based on these echo-shifted intermediate images, PSF-EPI can provide quantitative T2 and T2* mapping intrinsically (8,9). Particularly, for a spin-echo acquisition, the signal of the distortion-free images at positive $$$k_y$$$ steps and those at negative steps decay at a rate of (R2+R2’) and (R2-R2’) respectively. Thus T2 and T2* can be subsequently calculated by fitting the decay signals of $$$k_y>0$$$ images and $$$k_y<0$$$ images.Here, considering the intrinsic k-space center shifting in PSF-EPI, the 2D kspace ($$$k_x$$$-$$$k_{psf}$$$) at each $$$k_y$$$ needs separate k-space center realignment and Partial Fourier reconstruction (9). A typical example for the brain using PSF-EPI is shown in Figure 1B.
To accelerate the acquisition, parallel imaging and partial Fourier can be combined with PSF-EPI (10). Here, we denote the acceleration rate along PE and PSF by RPE and RPSF, respectively. For further acceleration, an undersampling and reconstruction scheme, tilted-CAIPI, is also employed (11). This scheme utilizes the inherent signal correlation in PSF-EPI and recovers the k-space by GRAPPA-like interpolation through a tilted kernel. With tilted-CAIPI, the shot number can be reduced from more than 100 to less than 10.
Data Acquisition
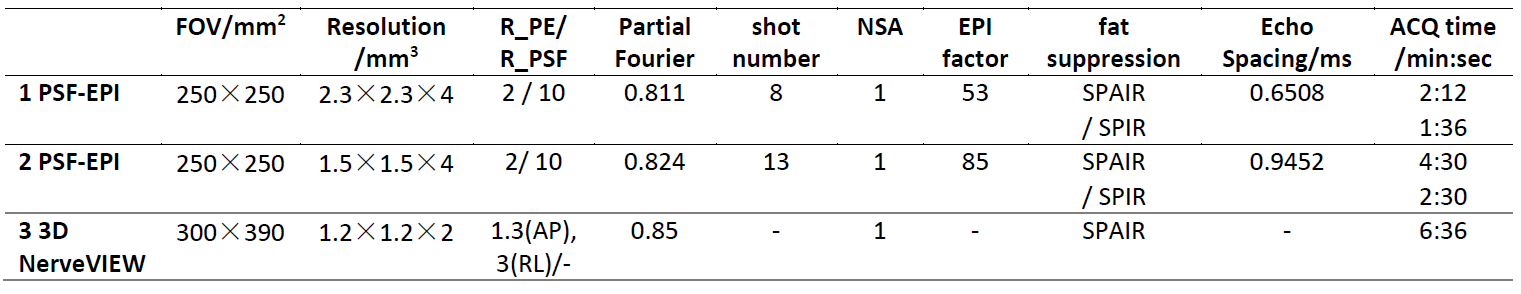
MRI scans were performed in 7 healthy volunteers and 2 patients on a Philips 3T Ingenia CX scanner (Philips Healthcare, Best, The Netherlands) using a 16-channel spine coil. This study was approved by the Institutional Review Board and written informed consent was obtained from all subjects. To suppress background signals, saturation bands were placed on the two sides of the lumbar. A low diffusion moment (b-value = 80 or 100 mm2/s) was employed (1). No respiratory gating or triggering was used. The common imaging parameters for PSF-EPI were: coronal slice orientation, 11 slices with 4mm thickness (1mm overlapping), fat suppression, SPAIR, DWI, MPS directions. Other acquisition parameters are summarized in Table 1 for different acquisitions.Results and Discussion
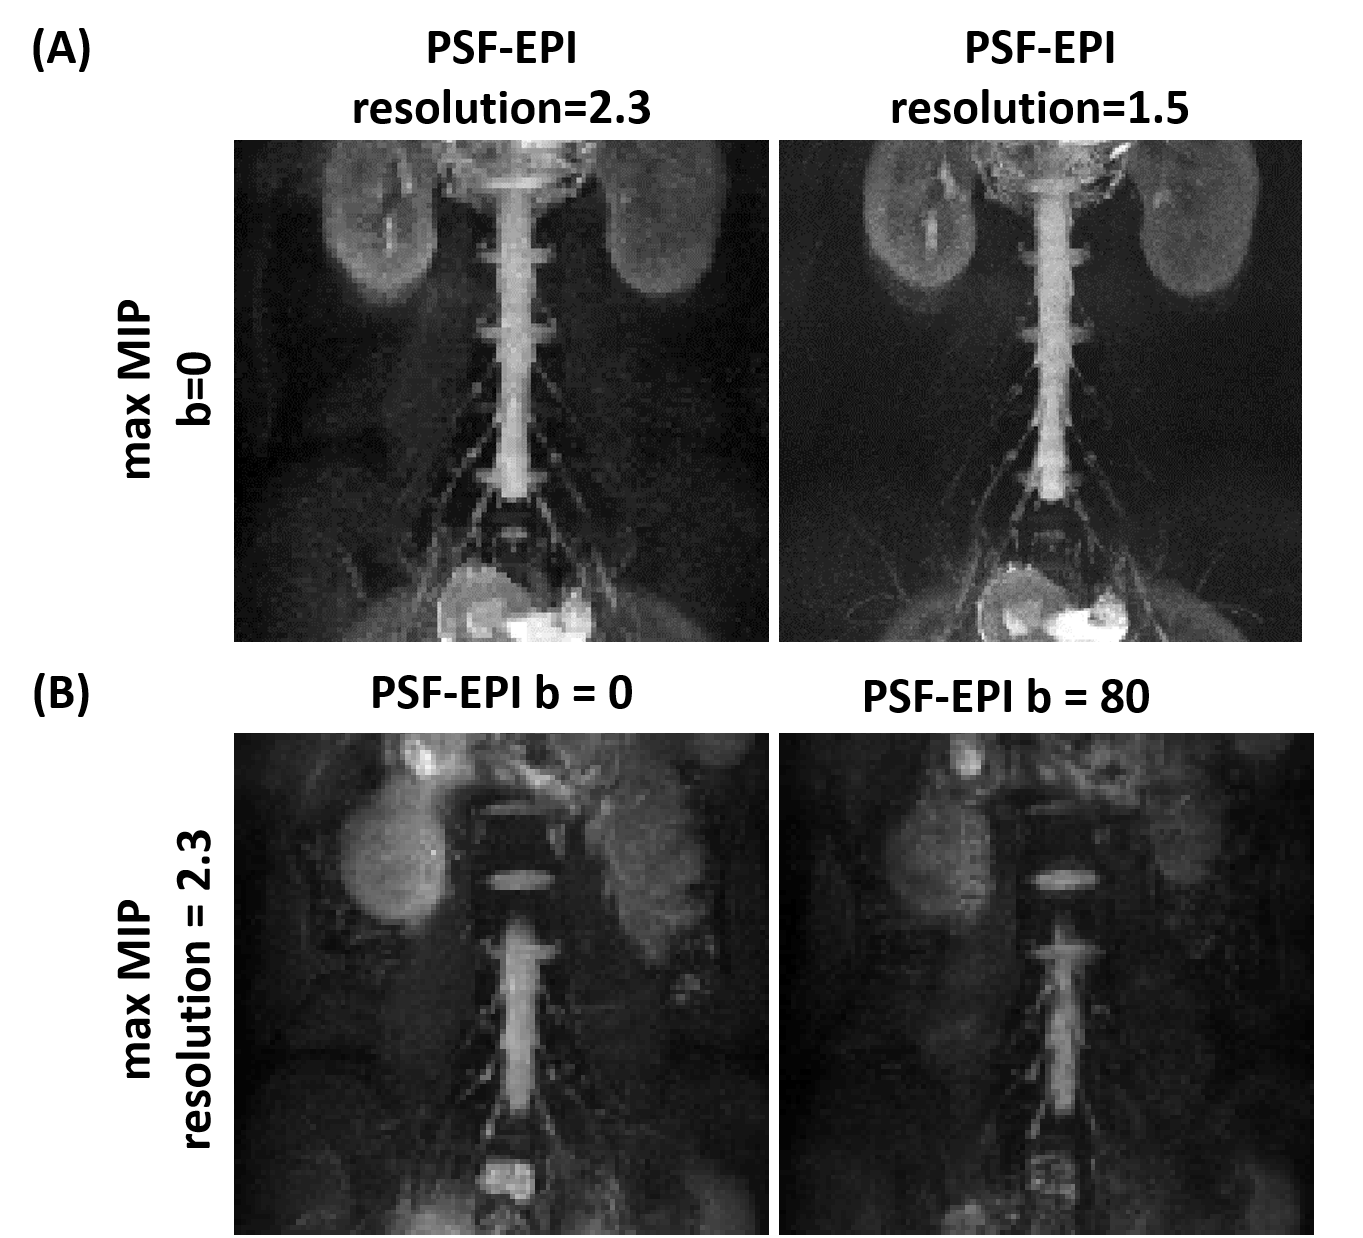
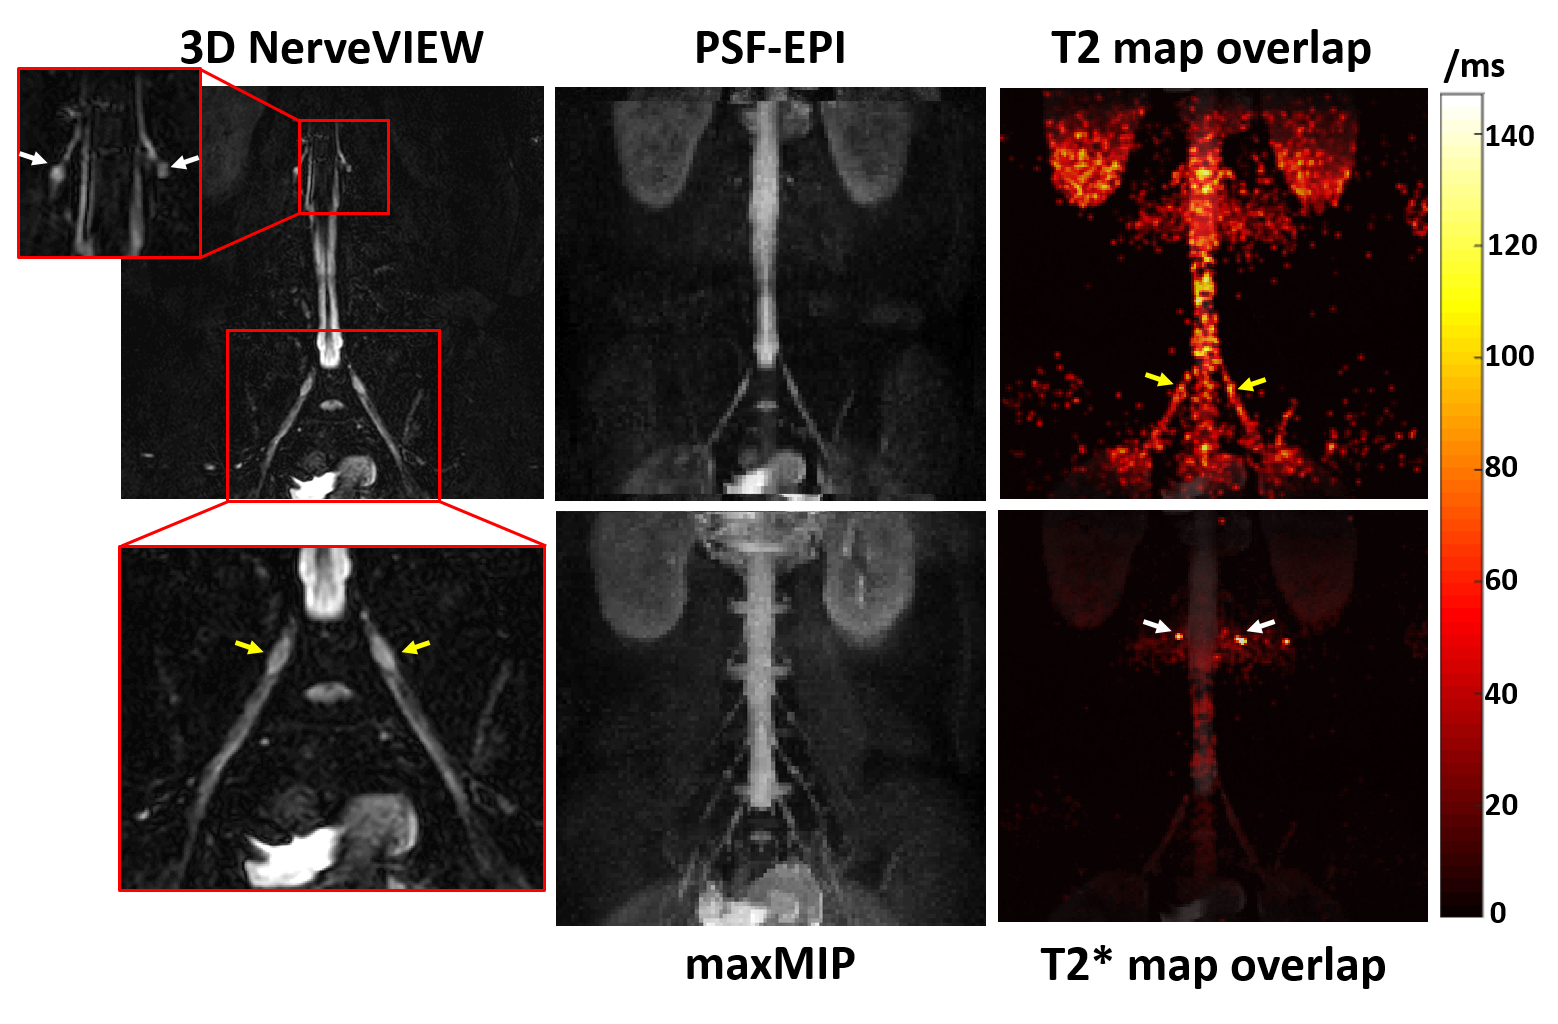
Figures 2A and 2B compare the MRN results using PSF-EPI with different resolutions and diffusion moments. The max MIP of PSF-EPI images with higher resolution demonstrates lower SNR level though depicts more detailed anatomical structures. In addition, the low-diffusion-weighted results show better background signal suppression but slightly reduced SNR.Figure 3 demonstrates the MRN and T2 mapping results of a healthy volunteer using PSF-EPI. The zoomed area in the high-resolution reference using 3D NerveVIEW (SHINKEI) offers clear illustration of the nerve roots. As it is shown, the T2 value of nerve roots is slightly higher than that in the sciatic nerve (yellow arrows). Additionally, compared with nerves, higher T2* value of the nerve roots is also demonstrated (white arrows). The measured mean T2 value of the sciatic nerve agrees well with literature (6).
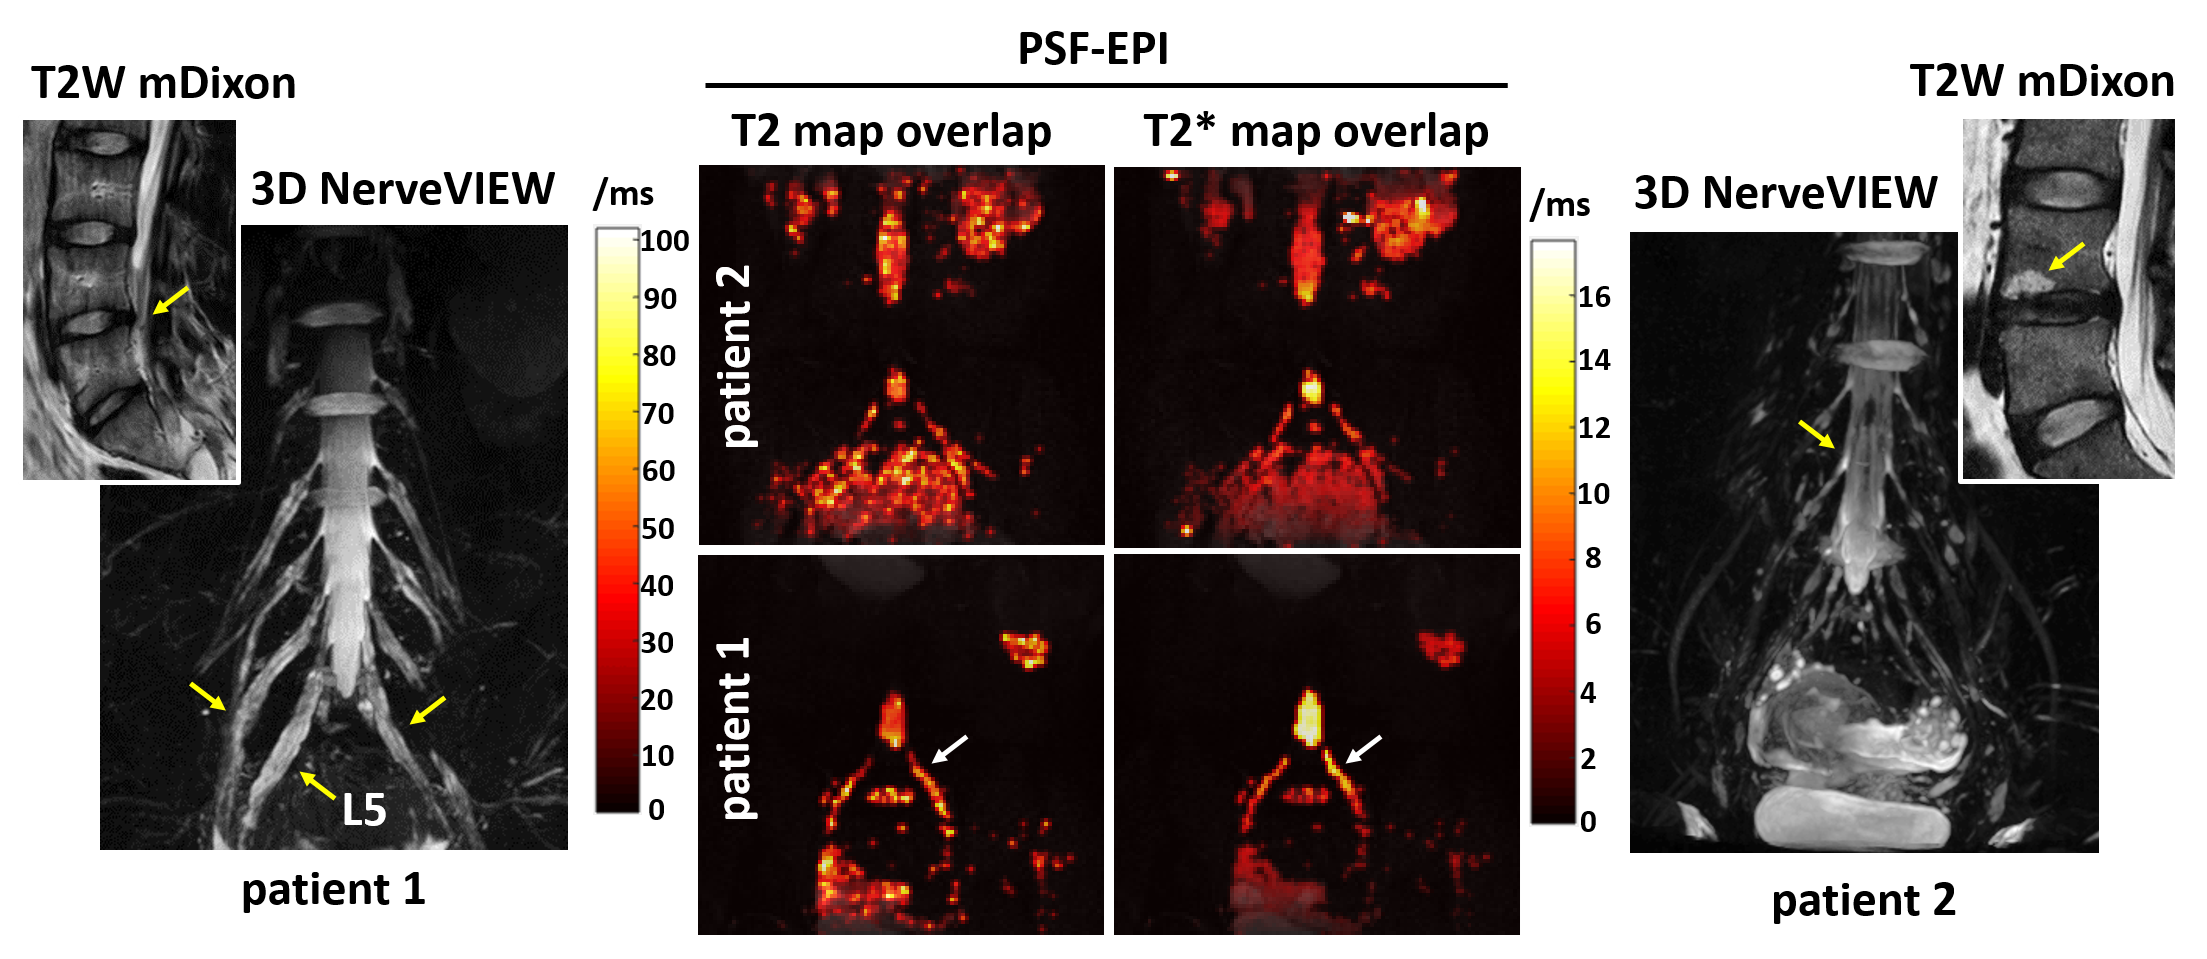
Figure 4 shows the quantitative mapping results of two patients with low back pain. The MRN of patient 1 demonstrates wide-spread edema and compressed nerve roots induced by disk herniation. For patient 2, though mediate end-plate osteochonondritis is demonstrated in the T2W mDixon image, no pathological changes of nerves are observed in MRN. As shown in the relaxation-time comparison, the symptomatic L5 nerve root of patient 1 shows higher T2 and T2* values than patient 2 throughout the entire nerve root (arrows). This indicates that MR quantitative mapping using PSF-EPI might be useful for diagnosis and treatment of disc degeneration and neurological pathologies in the lumbar.
Conclusions
PSF-EPI with tilted-CAIPI acceleration can achieve simultaneous MRN and T2, T2* mapping of the lumbar plexus within 2 minutes. The results demonstrate great clinical potential for quantitative evaluation of lumbar nerve roots.Acknowledgements
No acknowledgement found.References
1. Chhabra A, Zhao L, Carrino JA, Trueblood E, Koceski S, Shteriev F, Lenkinski L, Sinclair CDJ, Andreisek G. MR Neurography: Advances. Radiology Research and Practice;2013:1-14.
2. Takashima H, Takebayashi T, Yoshimoto M, Terashima Y, Ida K, Yamashita T. Efficacy of Diffusion-Weighted Magnetic Resonance Imaging in Diagnosing Spinal Root Disorders in Lumbar Disc Herniation. Spine;38(16):E998-E1002.
3.Wu, Liang, Jie, Neng, Zhou, Caisheng, Chen, Jianfeng. Microstructural Changes in Compressed Nerve Roots Are Consistent With Clinical Symptoms and Symptom Duration in Patients With Lumbar Disc Herniation. 2016;41(11):1.
4. Eguchi Y, Ohtori S, Yamashita M, Yamauchi K, Suzuki M, Orita S, Kamoda H, Arai G, Ishikawa T, Miyagi M. Diffusion-weighted magnetic resonance imaging of symptomatic nerve root of patients with lumbar disk herniation.53(9):633-641.
5. Hiwatashi A, Togao O, Yamashita K, Kikuchi K, Momosaka D, Nakatake H, Yamasaki R, Ogata H, Yoneyama M, Kira J-i. Simultaneous MR neurography and apparent T2 mapping in brachial plexus: Evaluation of patients with chronic inflammatory demyelinating polyradiculoneuropathy. Magnetic Resonance Imaging 2019.
6. Akio H, Osamu T, Koji Y, Kazufumi K, Daichi M, Hiroshi N, Ryo Y, Hidenori O, Masami Y, Jun-ichi K. Lumbar plexus in patients with chronic inflammatory demyelinating polyradiculoneuropathy: evaluation with simultaneous\\r <i>T</i>\\r <sub/>2</sub>\\r mapping and neurography method with SHINKEI. The British Journal of Radiology:20180501-.
7.Zaitsev M, Hennig J, Speck O. Point spread function mapping with parallel imaging techniques and high acceleration factors: fast, robust, and flexible method for echo‐planar imaging distortion correction. Magnetic Resonance in Medicine: An Official Journal of the International Society for Magnetic Resonance in Medicine 2004;52(5):1156-1166.
8. Wang F, Dong Z, Reese TG, Bilgic B, Katherine Manhard M, Chen J, Polimeni JR, Wald LL, Setsompop K. Echo planar time-resolved imaging (EPTI). Magnet Reson Med.
9. Hu Z, Wang Y, Dong Z, Guo H. Water/fat separation for distortion‐free EPI with point spread function encoding. Magnet Reson Med 2019.
10.In M-H, Posnansky O, Speck O. High-resolution distortion-free diffusion imaging using hybrid spin-warp and echo-planar PSF-encoding approach. Neuroimage 2017;148:20-30.
11.Dong Z, Wang F, Reese TG, Manhard MK, Bilgic B, Wald LL, Guo H, Setsompop K. Tilted‐CAIPI for highly accelerated distortion‐free EPI with point spread function (PSF) encoding. Magnet Reson Med 2019;81(1):377-392.
Figures