2020
Towards quantitative characterization in patients with skull-based invasion of nasopharyngeal carcinoma (NPC) using synthetic MRI1Department of Radiology, Sun Yat-Sen University Cancer Center, Guangzhou, China, 2MR Research, GE Healthcare, Beijing, China
Synopsis
MRI is the primary image diagnosis of nasopharyngeal carcinoma (NPC) at the stage T or N. For diagnosis of NPC, the presence of skull-based invasion is an important indicator for grading. In the early tumor infiltration, tumor cells have invaded bone marrow without re-arrangement of trabecular and cortical bones. Routine MRI diagnosis depends on physician’s objectively visual determination without quantification and standardization. Our study showed that T1 and T2 values in patients with skull-based invasion of NPC were higher and lower than healthy volunteers, respectively. MAGiC imaging sequence could help physicians determine NPC with or without skull-based invasion.
Introduction
MRI has been widely applied to diagnose nasopharyngeal carcinoma (NPC) and evaluate treatment effectiveness. Routine MRI sequences such as T1-weighted images, T2-weighted images, diffusion weighted images (DWI) provide good soft tissue contrast and clearly contrast the lesions from surrounding tissues so that clinical physicians can determine tumor stages and make customized treatment plans.1 However, routine MRI protocols fail to offer quantitative data for skull-based invasion of NPC. To quantify the level of skull-based invasion might improve the accuracy of clinic diagnosis and offer more objective information. A novel MAGiC sequence offers T1, T2 and PD quantitative maps to measure the relaxation time of each tissue.2 This study aims to establish an imaging protocol to quantify the level of skull-based invasion of NPC.Methods
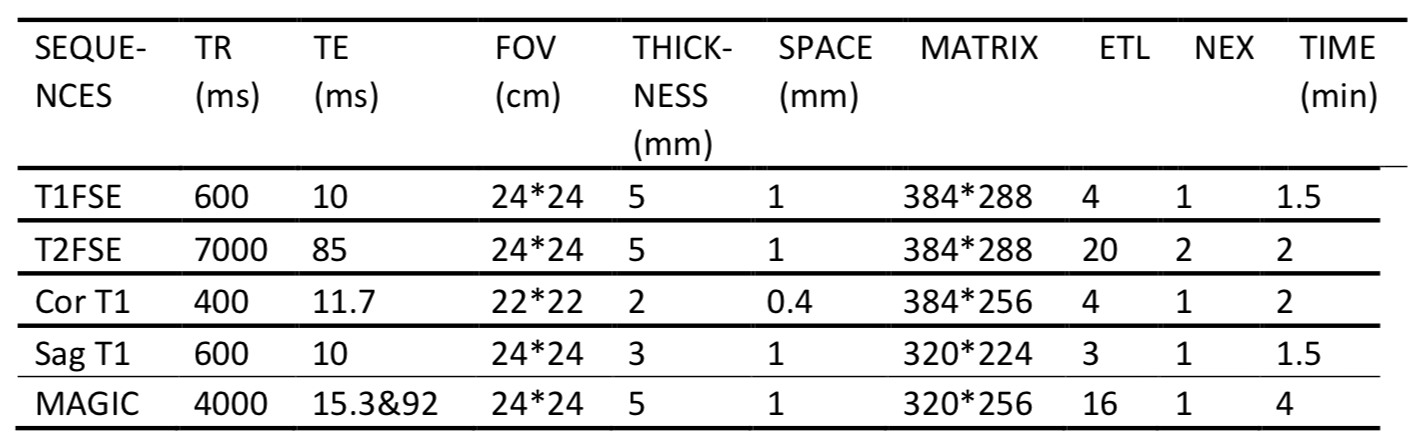
This study was approved by the Institutional Review Board of our hospital and all recruited subjects gave the informed consent. Seventy-four patients with NPC and skull-based invasion (NPCIs) and seventy healthy controls (HCs) were retrospectively collected from August 2018 to August 2019. Inclusion criteria for patients and HCs were non-keratinizing NPC and non-cranial-related diseases, respectively. Exclusion criteria were subjects with MR scanning contraindications or who failed to cooperate leading to scanning failure. All subjects underwent head-first routine three-plane T1 fast spin echo (FSE) imaging, T2 FSE and MAGiC with 16-channel array coil on 3.0 T MR scanner (SIGNATM Pioneer, GE Healthcare) (Table 1). No contrast agent was used in all scanning in avoidance of its influence on tissue relaxation time. Region of interests (ROIs) were manually delineated by a senior radiologist at GE workstation. The maximum areas of skull-based invasion lesion contour on the clivus of occipital bone on each patient with NPC and the maximum clivus areas of occipital bone on HCs were recorded. T1 and T2 values of the corresponding areas between two groups were analyzed with two-sample independent t-test.Results and Discussion
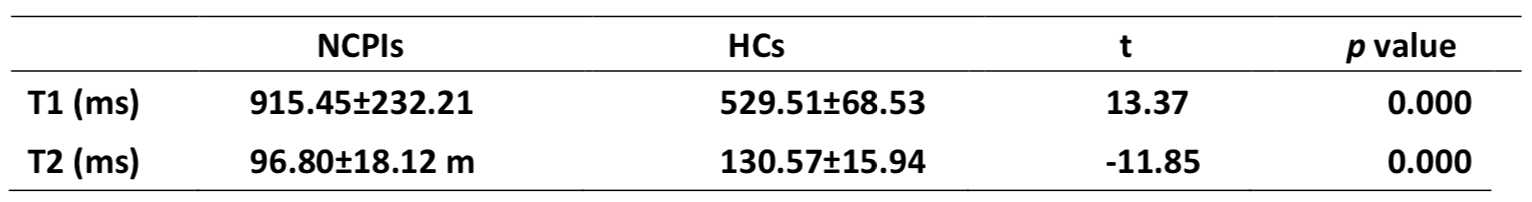
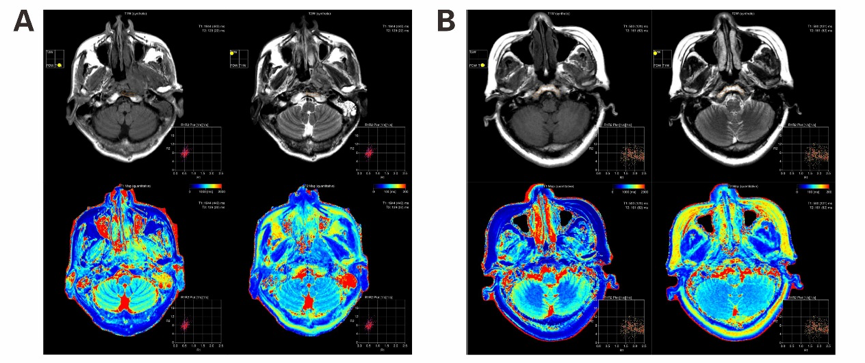
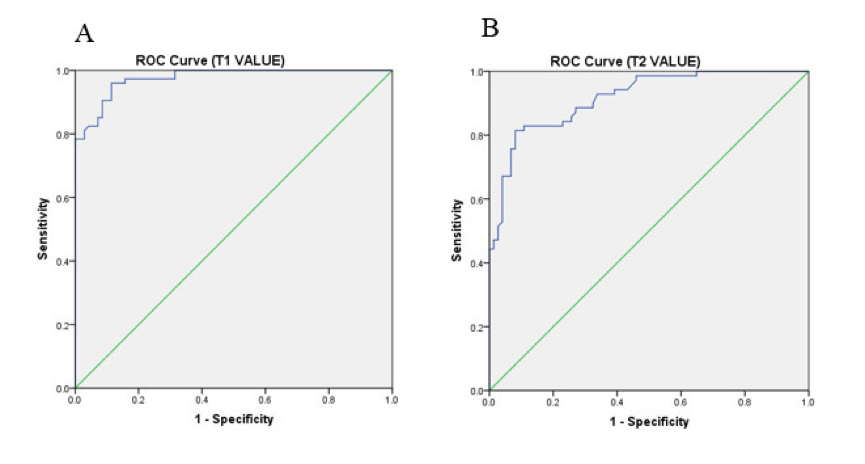
T1 and T2 values in NPCIs was 915.45±232.21 ms and 96.80±18.12 ms while in HCs was 529.51±68.53 ms and 130.57±15.94 ms (Table 2). Significant differences of T1 and T2 values between two groups were found (p < 0.001). The representative images of both NPCI and HC groups were demonstrated in Figure 1. In addition, the ROC curves showed that T1 and T2 had good discriminative capacity for diagnosis of NPCI from HC (Figure 2). These T1 and T2 values were obtained with MAGiC sequence based on multiple-delay multiple-echo (MDME) different to conventional imaging sequences. Since routine MR images were so-called weighted images, real T1 and T2 values could not be obtained without variant flip angles or multi-echoes in one sequence. It takes longer time to acquire T1 and T2 maps with conventional image sequences and image quality is concerned because of motion artifact and patient comfort. With this new imaging sequence MAGiC, not only morphology but also quantification can be achieved at the same time. In this study, adipose in normal bone marrow was replaced by tumors due to skull-based invasion of NPC, so increased T1 and decreased T2 values of bone were found. MAGiC became a useful supplementary imaging sequence for NPC research with its provision of quantitation information.Conclusion
MAGiC achieved the fast quantification of unitary-standard MR imaging so as to fulfill the goal of data collection, database establishment at multicenter with the same imaging parameters. Future research on abundant patients with and without skull-based of NPC by application of deep learning based on classification of age and gender might offer automatic segmentations of tumor contours and tissue quantification information and consequently assist physician to diagnose, grade tumor stage and delineate the radiation target.Acknowledgements
No acknowledgement found.References
1. Li YZ, Cai PQ, Xie CM, et al. Nasopharyngeal cancer: impact of skull base invasion on patients prognosis and its potential implications on TNM staging. European journal of radiology. 2013;82(3):e107-11.
2. Warntjes JB, Leinhard OD, West J, et al.Rapid magnetic resonance quantification on the brain: Optimization for clinical usage[J]. Magn Reson Med. 2008; 60(2):320-9.
Figures