2019
Application of diffusion kurtosis imaging in differential diagnosis of thyroid adenoma and papillary thyroid carcinoma1Xiamen Branch, Zhongshan Hospital, Fudan University, Xiamen, China, 2MR Research China, GE Healthcare, Beijing, China
Synopsis
Diffusion kurtosis imaging (DKI) has not yet been widely studied in thyroid disease diagnosis. Here we investigate the feasibility of DKI in distinguishing thyroid adenoma (TA) from papillary thyroid carcinoma (PTC). We found that quantitative measurements provided by DKI were significantly different between TA and PTC. A higher area under the curve of mean diffusivity (MD) in discriminating TA from PTC was also observed. We concluded that DKI can be used as a feasible technique and benefit the diagnostic performance in distinguishing between TA and PTC.
Introduction
In current clinical routine, diffusion-weighted imaging (DWI) and the subsequent apparent diffusion coefficient (ADC) can be used to differentiate the thyroid adenoma (TA) from papillary thyroid carcinoma (PTC) [1]. However, it is still challenging due to a variety of imaging features of PTC. Pitfalls may occur when PTC presents with features more commonly associated with benign nodules, such as cyst degeneration [2]. Diffusion kurtosis imaging (DKI), based on the non-Gaussian water diffusion model, can provide more information on tissue structure than standard monoexponential model [3]. Therefore, the aim of this study was to evaluate the feasibility and whether the quantitative measurements offered by DKI can benefit the diagnostic performance in distinguishing TA from PTC.Methods
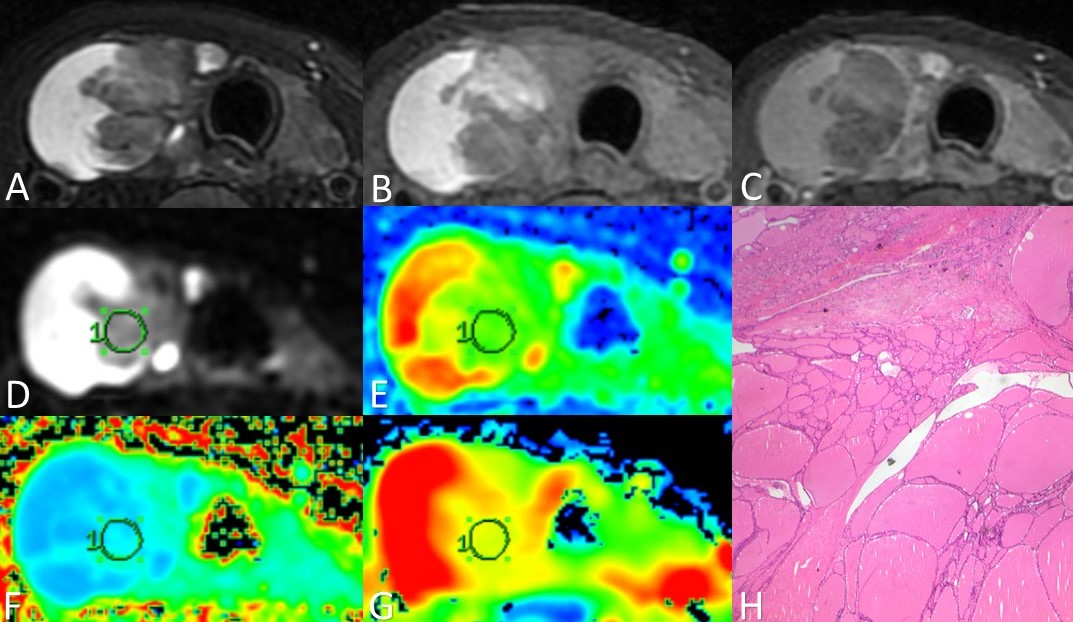
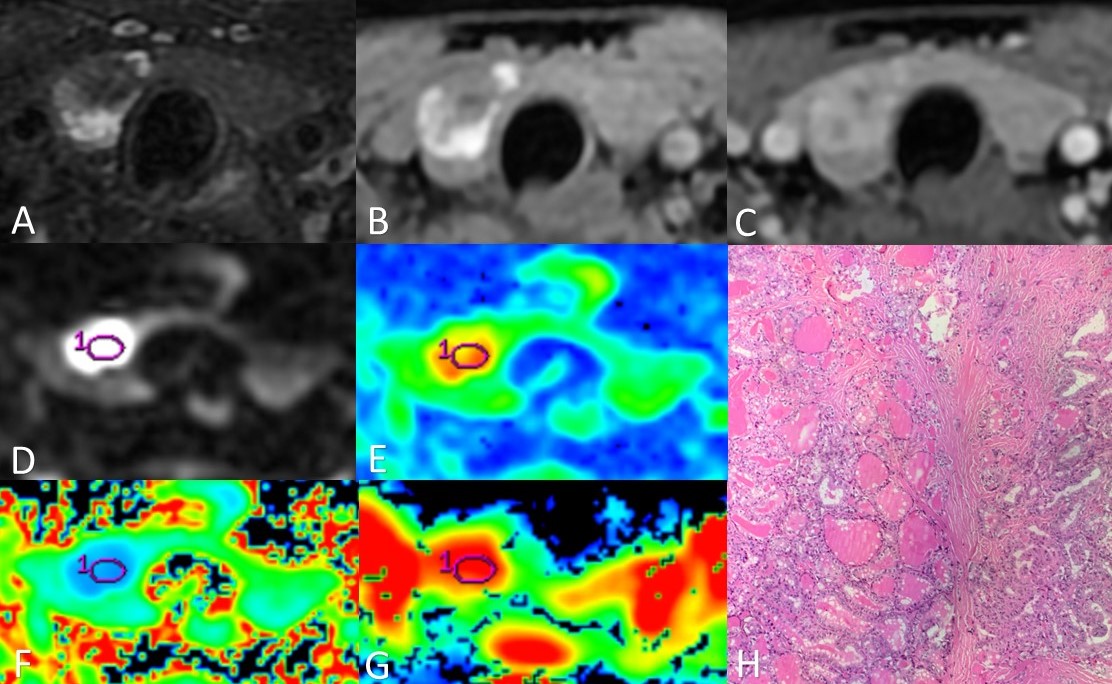
Thirteen consecutive patients with thyroid nodules were enrolled in this study, including six patients diagnosed with thyroid adenomas and seven patients diagnosed with papillary thyroid carcinomas, according to the surgery and histological results. All data were obtained on a 3T MR scanner (Discovery MR750W, GE Healthcare, Milwaukee, WI, USA). All participants underwent MR examinations including routine thyroid acquisitions, DWI (b = 0, 600 s/mm2) and DKI (b = 0, 1000, 2000 s/mm2, 15 diffusion directions). Images analyses were performed on GE AW4.6 Workstation by two radiologists, who were blinded to the pathologic results. The ROIs were manually drawn on the maximal section of each lesion, carefully avoiding the area of cystic degeneration, necrosis and bleeding. Quantitative measurements including ADC from DWI, mean diffusivity (MD) and mean kurtosis (MK) from DKI in the ROIs were extracted. Student’s t-test was applied to assess the difference between TA and PTC. Receiver operating characteristic (ROC) curve analysis was performed to evaluate the diagnostic efficacy of each parameter in discriminating TA from PTC by the area under the curve (AUC).Results
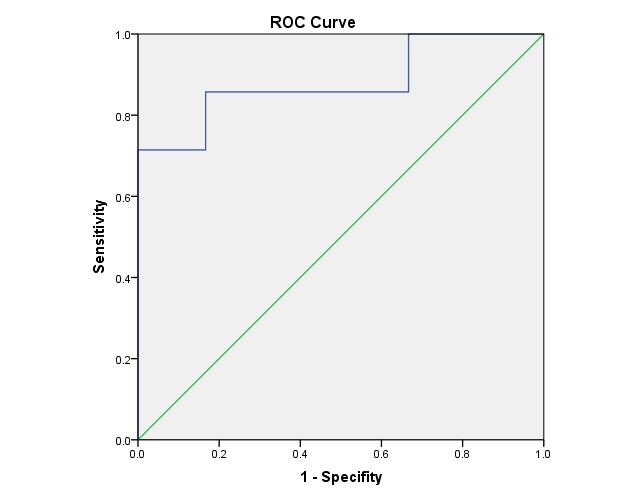
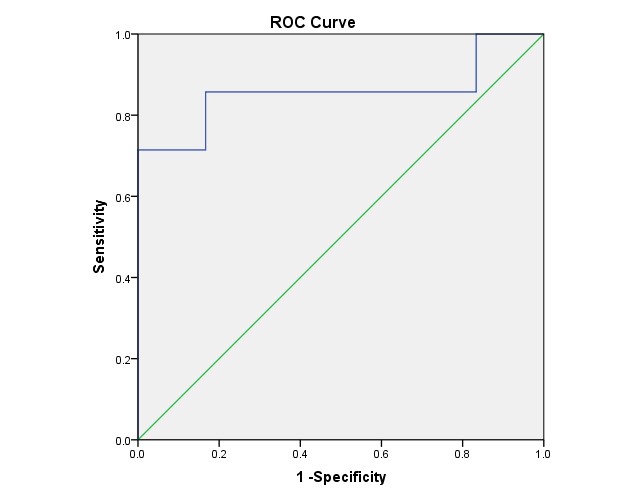
We found that the value of MD was higher in TA than in PTC (t = 2.716, P = 0.020), and the value of MK was lower in TA than in PTC (t = -2.836, P = 0.016), while the value of ADC had no statistical significance between them (t = 1.192, P = 0.863). The AUC value of MD and MK were 0.881 and 0.857, respectively. Results of ROC curves indicated that MD had the highest AUC. The diagnostic thresholds of MD and MK were 1.715 and 0.84, respectively.Discussion
DWI has been commonly utilized in regular thyroid MRI. DKI, which can reflect the diffusion of tissue water molecules and the complexity of tissue structure, however, has not yet been widely studied in thyroid disease diagnosis. Our results demonstrated that quantitative measurements provided by DKI are significantly different between TA and PTC. TA is mainly composed of follicles in different sizes and loose tumor stroma, which may explain the higher MD in TA. Although bleeding and cystic degeneration are commonly seen, the solid portion of TA has relatively simple structure, resulting in a lower MK in TA presented in our study. Microscopic features related to the classical PTC are papillary structure, psammoma bodies, peculiar appearance of the tumor cell nuclei, and the fibrosis of the tumor stroma. Thus PTC presented a lower MD and a higher MK. As a new technology conforming to non-Gaussian distribution, DKI can more objectively reflect the diffusion of water molecules in vivo, and can provide relatively accurate information about the microstructure of tissues. Overall, compared with conventional DWI, DKI can more accurately reflect the characteristics of microenvironment and water diffusion in tumor, and thus increase the ability in differentiating between TA and PTC.Conclusion
The pilot study demonstrated that DKI sequence can be used to distinguish TA and PTC, and showed better performance than DWI.Acknowledgements
No acknowledgement found.References
[1] Hao Y, Pan C, Chen W, et al. Differentiation between malignant and benign thyroid nodules and stratification of papillary thyroid cancer with aggressive histological features: Whole-lesion diffusion-weighted imaging histogram analysis. J MAGN RESON IMAGING 2016;44(6):1546-55.
[2] Patel BN, Kamaya A, Desser TS. Pitfalls in Sonographic Evaluation of Thyroid Abnormalities. Seminars in Ultrasound, CT and MRI 2013;34(3):226-35.
[3] Shi RY, Yao QY, Zhou QY, et al. Preliminary study of diffusion kurtosis imaging in thyroid nodules and its histopathologic correlation. EUR RADIOL 2017;27(11):4710-20.
Figures