2018
Repeatability of T1rho imaging in the head and neck1The Chinese University of Hong Kong, Hong Kong, Hong Kong
Synopsis
T1rho imaging is a new MRI sequence for cancer evaluation but the repeatability of this sequence in the head and neck region is unknown. T1rho imaging of the head and neck was performed three times comprising an initial scan (scan 1) followed by a scan 30 minutes (scan 2) and 14 days (scan 3) later. The repeatability, agreement and variance for the parotid gland, palatine tonsil and tongue were assessed by comparing scan 1 and 2 and comparing scan 1 and 3. Results suggested that T1rho imaging could be a reliable sequence for use in the head and neck.
PURPOSE
The spin-lattice relaxation time in the rotating frame, known as T1rho, is sensitive to biological processes associated with alterations in the macromolecular content of tissues. It does not require the injection of an intravenous contrast agent. T1rho imaging is therefore a potential new MRI sequence for cancer evaluation. In the head and neck region it may also have an advantage over diffusion weighted imaging because there is less distortion from B0 field inhomogeneities 1,2. The repeatability of T1rho imaging has been shown to be reliable in tissues such as the liver and cartilage 3-7. However, T1rho imaging is still a new MRI sequence in the head and neck and the repeatability for this region is unknown. The purpose of this study is to evaluate whether quantitative T1rho imaging has reliable repeatability for studying tissues in the head and neck.MATERIALS AND METHODS
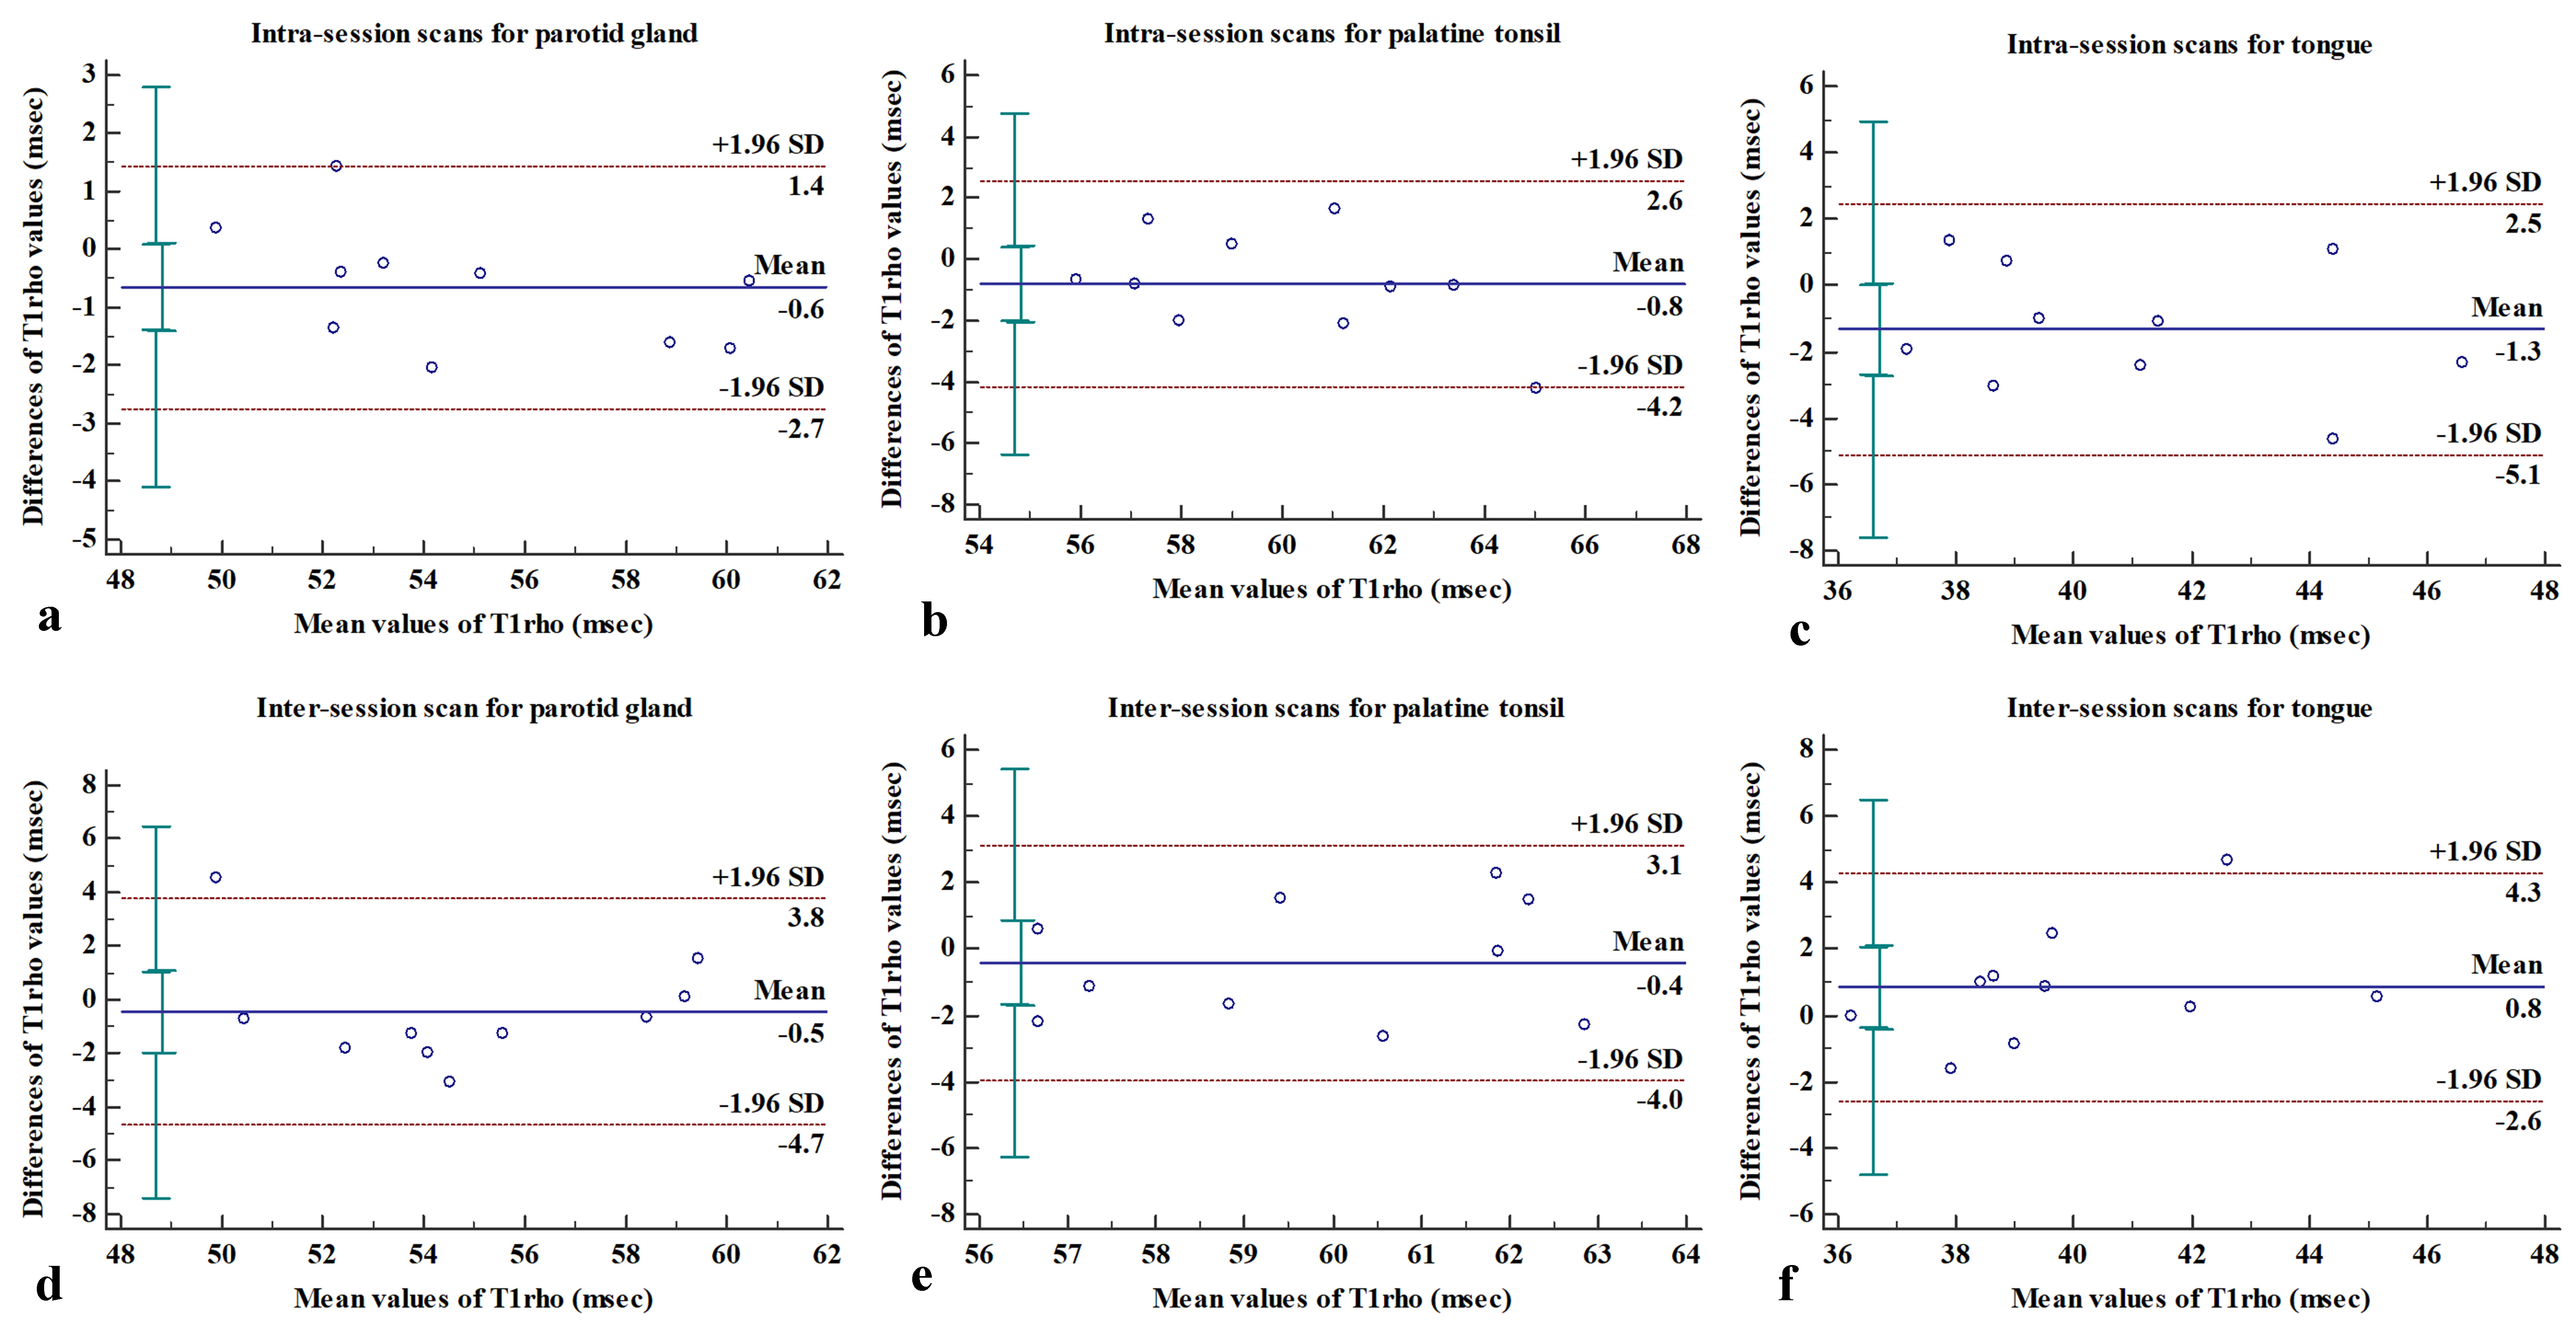
This prospective study was performed with local institutional board approval and written informed consent was obtained from 10 healthy volunteers (median age: 27 years, range: 24-31 years). T1rho imaging of the head and neck was performed on a Philips Achieva TX 3.0T scanner (Philips Healthcare) and was performed three times in all volunteers. The first two scans (scan 1 and scan 2) were performed with a time interval of 30 minutes and the third scan was performed 14 days after the initial scan (scan 3). T1rho imaging was performed using adiabatic continuous wave constant amplitude spin-lock approach [1] followed with a single shot turbo spin echo acquisition. The imaging parameters were: repetition time/echo time 2500/15 msec; field of view, 230 mm × 216 mm; resolution, 1.2 mm × 1.2 mm; slice thickness, 5 mm; number of slices, 9; sensitivity encoding factor, 2; frequency of spin-lock, 400Hz; and time of spin lock, 0, 10, 30, 55, and 90 msec. At each pixel, the image intensity was fitted to the relaxation model $$y=A\exp{\left(-\frac{\text{TSL}}{\text{T1rho}}\right)}+B$$ to calculate the T1rho value.Pixels with extreme T1rho values (< 15 msec or > 200 msec) were excluded.The left parotid gland, left palatine tonsil, and the tongue were manually contoured. The repeatability of the intra-session scans (scan 1 vs scan 2) and inter-session scans (scan 1 vs scan 3) for parotid gland, palatine tonsil and tongue were evaluated by using Bland-Altman plot and the limits of agreement calculated. Intra-class coefficient (ICC), within-subject coefficient of variance (wCV), and repeatability coefficient (RC) were also calculated to assess the repeatability of T1rho imaging for each of the three tissues.
RESULTS
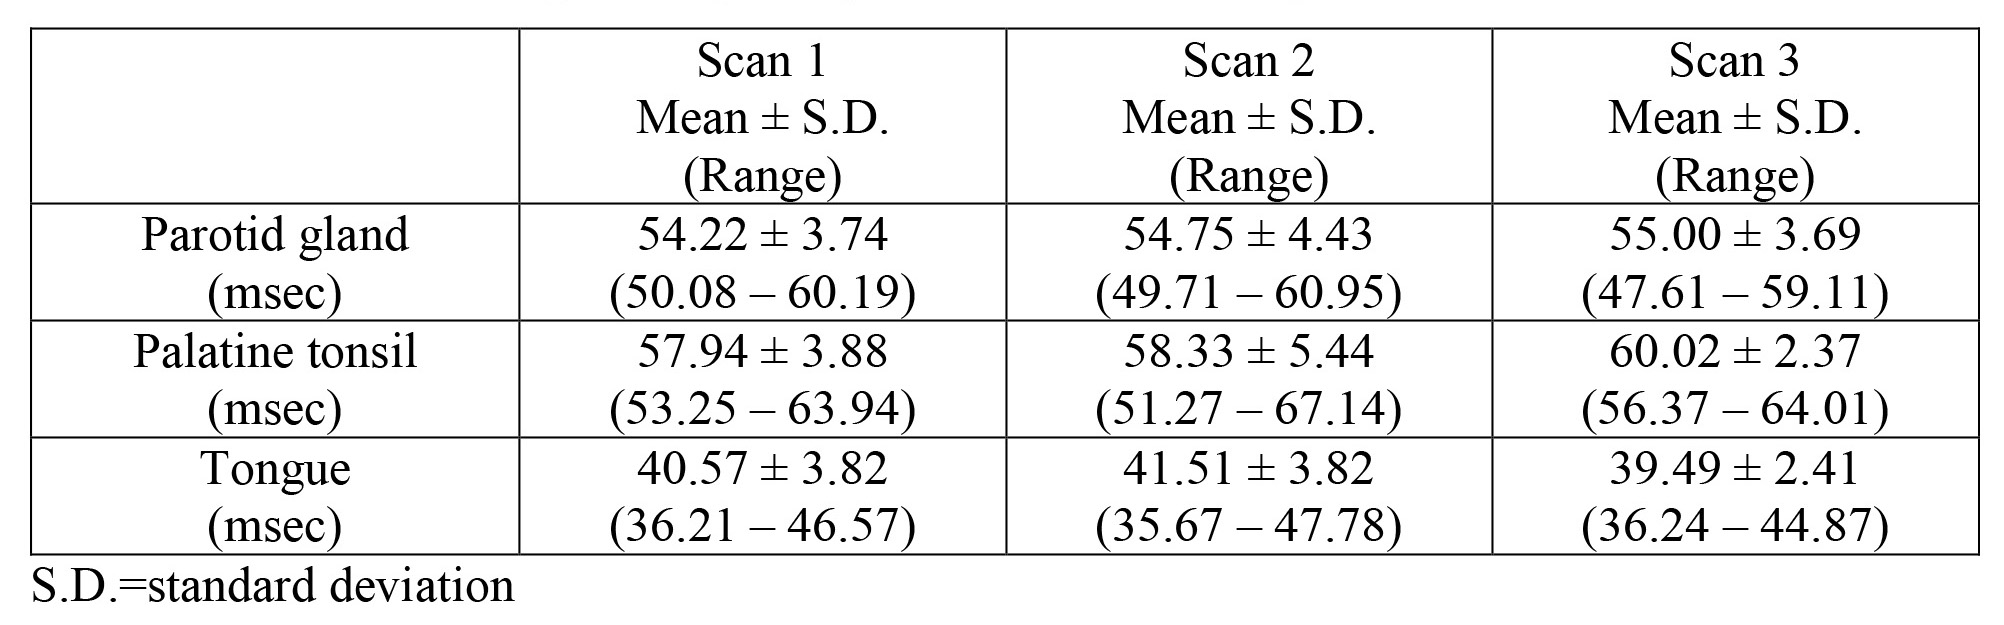
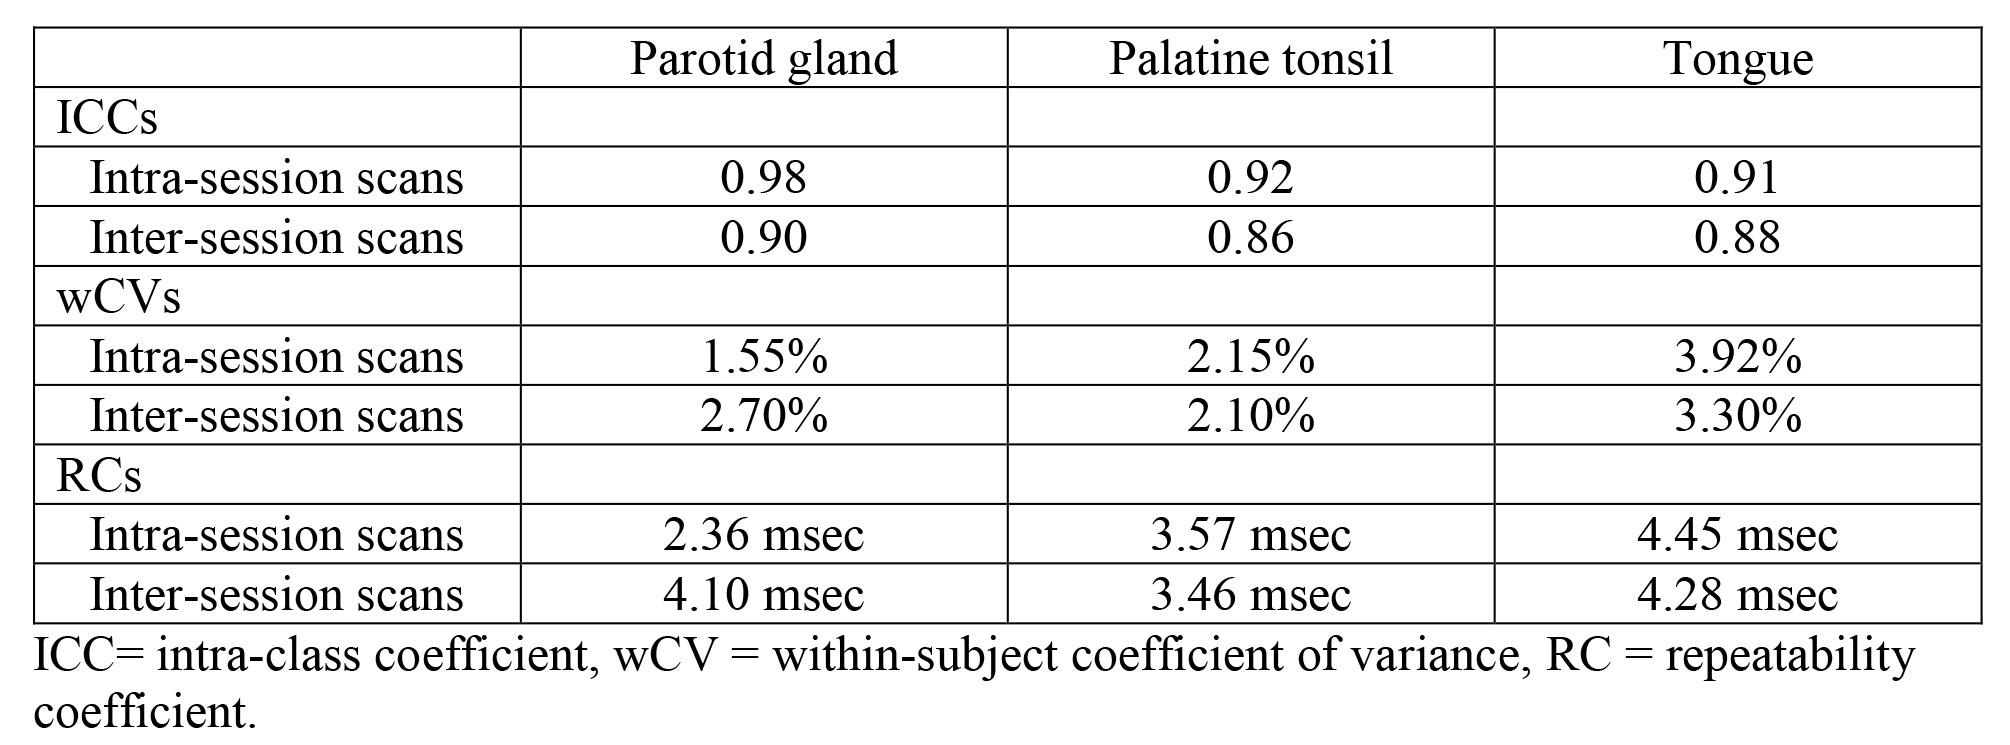
The mean ± standard deviation of T1rho values for the normal tissues on the three scans are shown in Table 1. The Bland-Altman plots, showing differences of T1rho values between intra and inter sessions for each tissue, are shown in Figure 1a-f. The ICCs, wCVs and RCs comparing intra-session scan and inter-session scan for each tissue are shown in Table 2. Intra-session ICCs were high (0.91 – 0.98) and the wCVs were between 1.55% to 3.92% for all tissues. Inter-session ICCs remained high (0.86 – 0.90) and wCVs were between 2.10% to 3.30% for all tissues. The greatest T1rho RC for all sessions and all tissues was 4.45 msec.DISCUSSION
Distribution of plots in the Bland-Altman graphs indicated T1rho values for normal tissues in the head and neck were considered to be in agreement and interchangeable for scans repeated intra-session and inter-session. Furthermore, intra-session T1rho values in each of the three normal tissues showed good repeatability with excellent agreements (ICCs > 0.9) and low wCVs (1.55% to 3.92%) with only a slight reduction in the inter-session repeatability. Our results suggest repeatability of T1rho imaging in the head and neck may be similar to or better than that in liver and cartilage [3–7]. Results from this study are encouraging because repeatability of quantitative T1rho imaging will be important in head and neck cancer research aiming to characterise tumours, predict treatment response and assess intra-treatment changes.CONCLUSION
T1rho imaging is a repeatable MRI sequence that can be used in head and neck research.Acknowledgements
No acknowledgement found.References
1. Jiang B, Chen W. On-resonance and off-resonance continuous wave constant amplitude spin-lock and T1ρ quantification in the presence of B1 and B0 inhomogeneities. NMR in Biomedicine 2018;31(7):e3928.
2. Chen W. Artifacts correction for T1rho imaging with constant amplitude spin-lock. Journal of Magnetic Resonance 2017;274:13–23.
3. Mosher TJ, Zhang Z, Reddy R, et al. Knee articular cartilage damage in osteoarthritis: Analysis of MR image biomarker reproducibility in ACRIN-PA 4001 multicenter trial. Radiology 2011;258:832–42.
4. Li X, Wyatt C, Rivoire J, et al. Simultaneous Acquisition of T1ρ and T2 Quantification in Knee Cartilage: Repeatability and Diurnal Variation. Journal of Magnetic Resonance Imaging 2014;39:1287–93.
5. Wáng YXJ, Deng M, Lo GG, et al. Breath-hold black-blood T1rho mapping improves liver T1rho quantification in healthy volunteers. Acta Radiologica 2018;59:257–65.
6. Nemeth A, Di Marco L, Boutitie F, et al. Reproducibility of in vivo magnetic resonance imaging T 1 rho and T 2 relaxation time measurements of hip cartilage at 3.0T in healthy volunteers. Journal of Magnetic Resonance Imaging 2018;47:1022–33.
7. Sharafi A, Xia D, Chang G, et al. Biexponential T1ρ Relaxation Mapping of Human Knee Cartilage in-vivo at 3T. NMR in Biomedicine 2017;30:e3760.
Figures