2012
Altered visual pathway dynamics upon dark rearing of mice captured with ultra-fast fMRI1Champalimaud Neuroscience Programme, Champalimaud Centre for the Unknown, Lisbon, Portugal
Synopsis
Dark rearing (DR) profoundly affects visual processing. Decreased flash responsiveness and increased off-response latencies were reported in DR mice visual cortex (VC). Here, we targeted such plastic changes in activation dynamics using ultrafast fMRI upon mice monocular visual stimulation. Our results, targeting the most of the pathway, showed decreased BOLD amplitudes in most visual pathway structures as well as less well-defined neuronal input order. Activation maps revealed marked increases in ipsilateral response in DR mice compared to controls. These results reveal that BOLD fMRI can depict visual pathway plasticity, and suggests a naïve and unskilled network upon DR.
Introduction
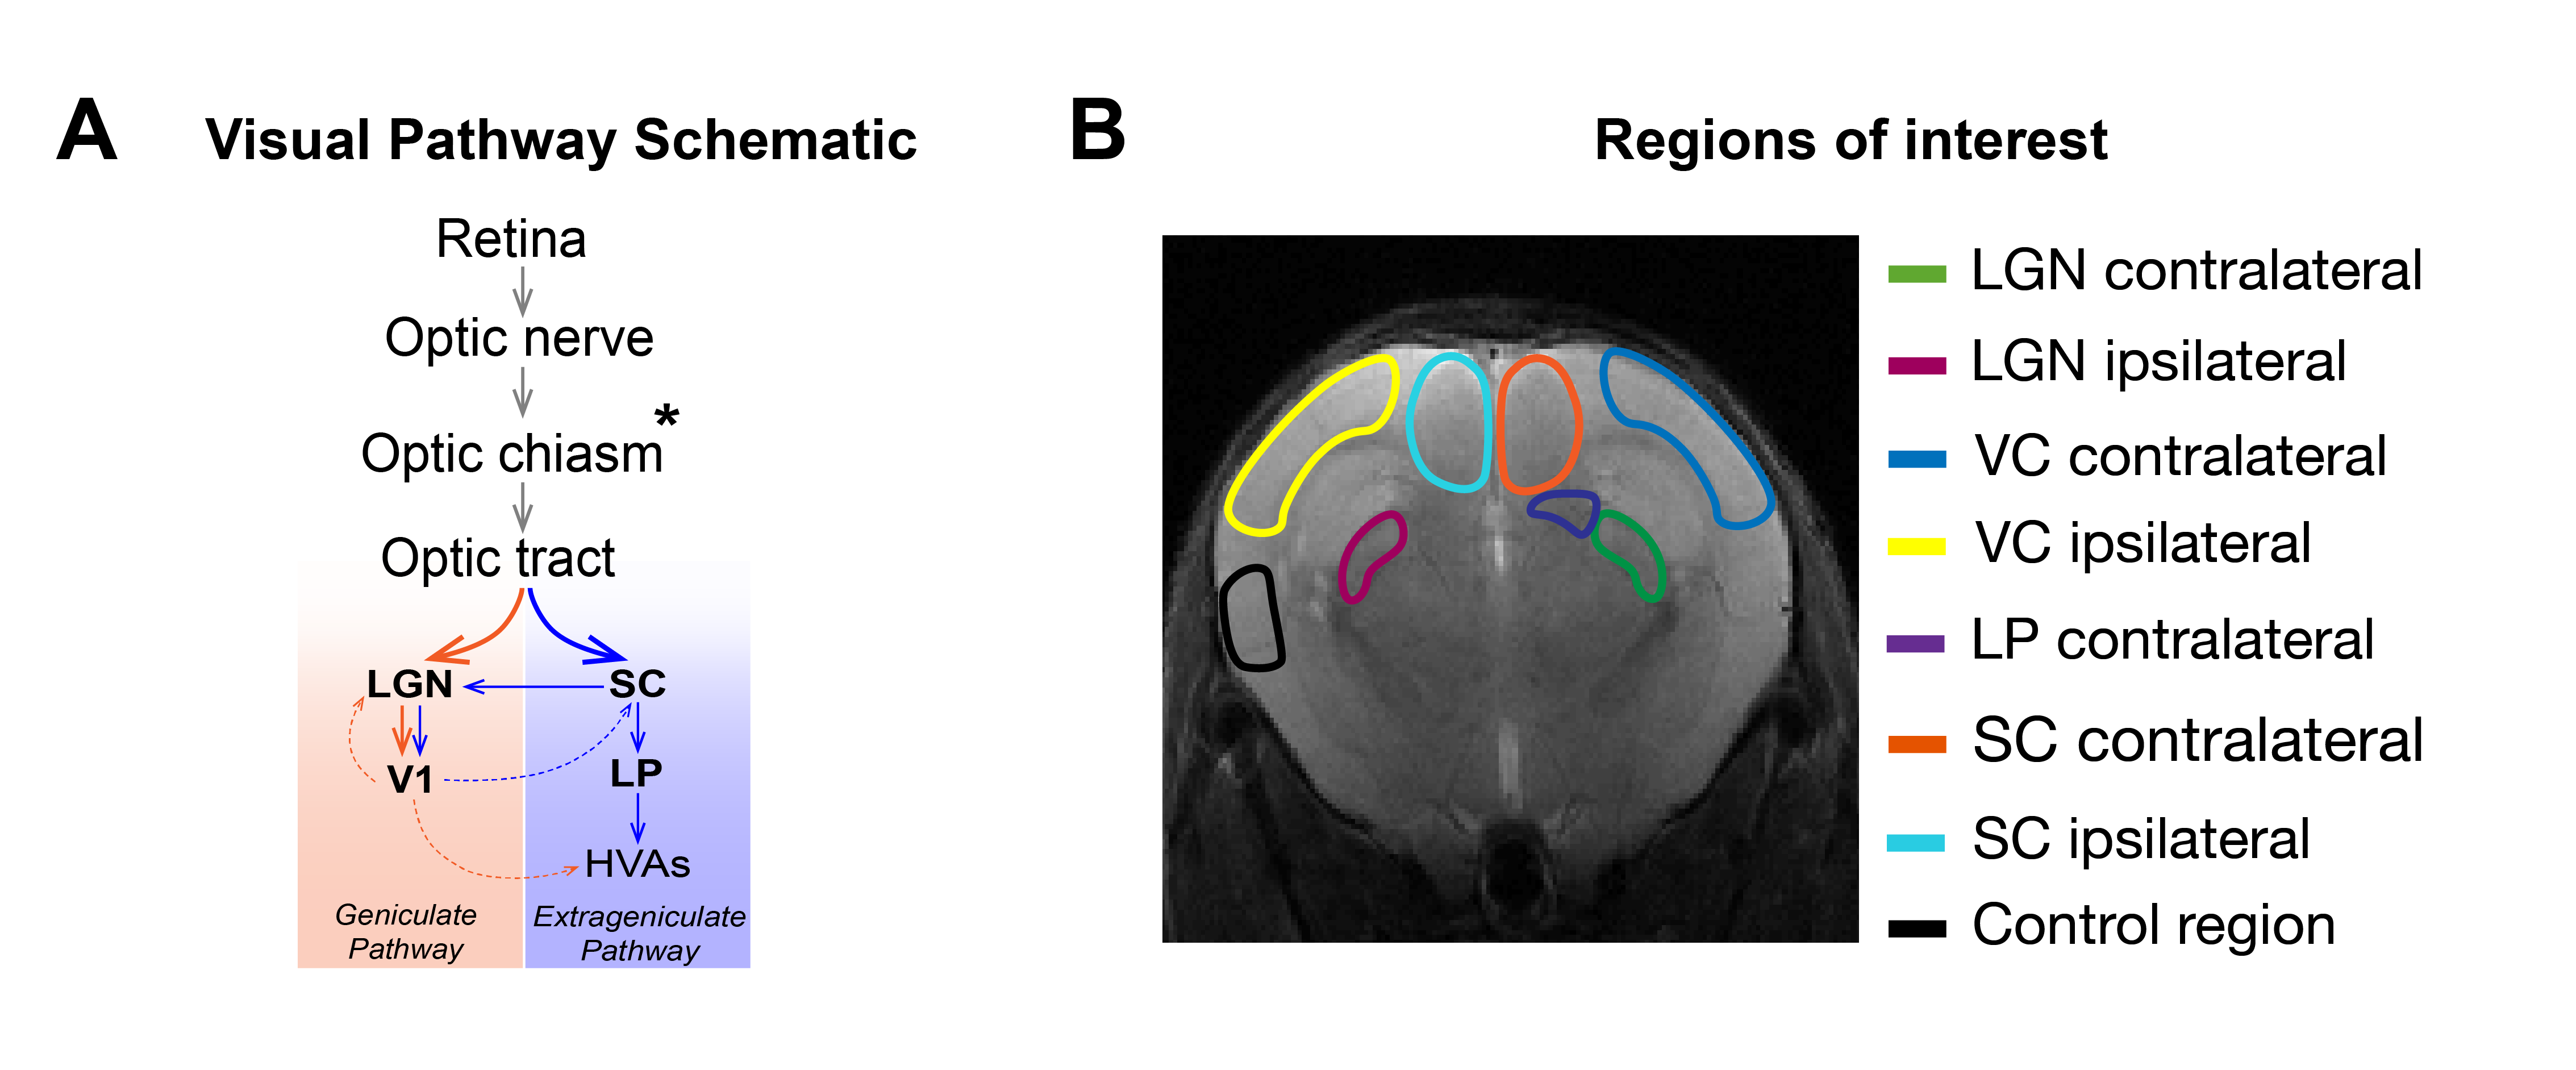
Monocular stimulation under normal reared (NR) conditions elicits contralateral visual pathway activation, arriving first to SC and LGN and later to VC (Fig.1A). A reduced number of retinal projections arrives to the ipsilateral binocular area of these structures. Dark Rearing (DR) alters the refinement of neuronal connections and visual system function1-12, leading to increased latency of off-responses and decreases in flash responsiveness in mice VC, as measured electrophysiologically4.Here, we used DR as a model of aberrant pathways, and hypothesized that BOLD-fMRI can reflect such plastic changes. We targeted altered DR-induced visual responses using an ultrafast fMRI approach, to robustly measure onset times, suggested to reflect neuronal input order13-15. Results indicate amplitude BOLD decreases as well as increased ipsilateral responses, and a less defined neuronal input order compared with NR controls. These suggest an important role of exposure to light stimulus in the maturation of synaptic function along the visual pathway and show that altered patterns and dynamics can be captured with ultrafast fMRI signals.
Methods
Animal experiments were preapproved by the institutional and national authorities and were carried out according to European Directive 2010/63.Animal preparation: Adult C57BL/6 mice (n=7), born and raised in complete darkness, were kept under medetomidine and 0.3% isoflurane anaesthesia while breathing oxygen-enriched air. Temperature and respiration rate remained stable.
MRI experiments: A 9.4T BioSpec scanner (Bruker, Karlsruhe, Germany) with an 86mm quadrature resonator for transmittance and a 4-element array cryoprobe16,17 (Bruker, Fallanden, Switzerland) for signal reception were used. An oblique slice, capturing the visual pathway, was used enabling fast temporal resolution (GE-EPI: TR/TE=50/17.5msec, FOV=16×12.35mm2, resolution=167×167μm2, slice thickness=1mm, tacq=7min30sec).
Visual Stimulation: Left eye monocular stimulation was performed using a 470nm LED (2.89x10⁻³W/m2) with ten blocks of 1sec stimulation (frequency=2Hz; pulse width=10ms) and 40sec rest.
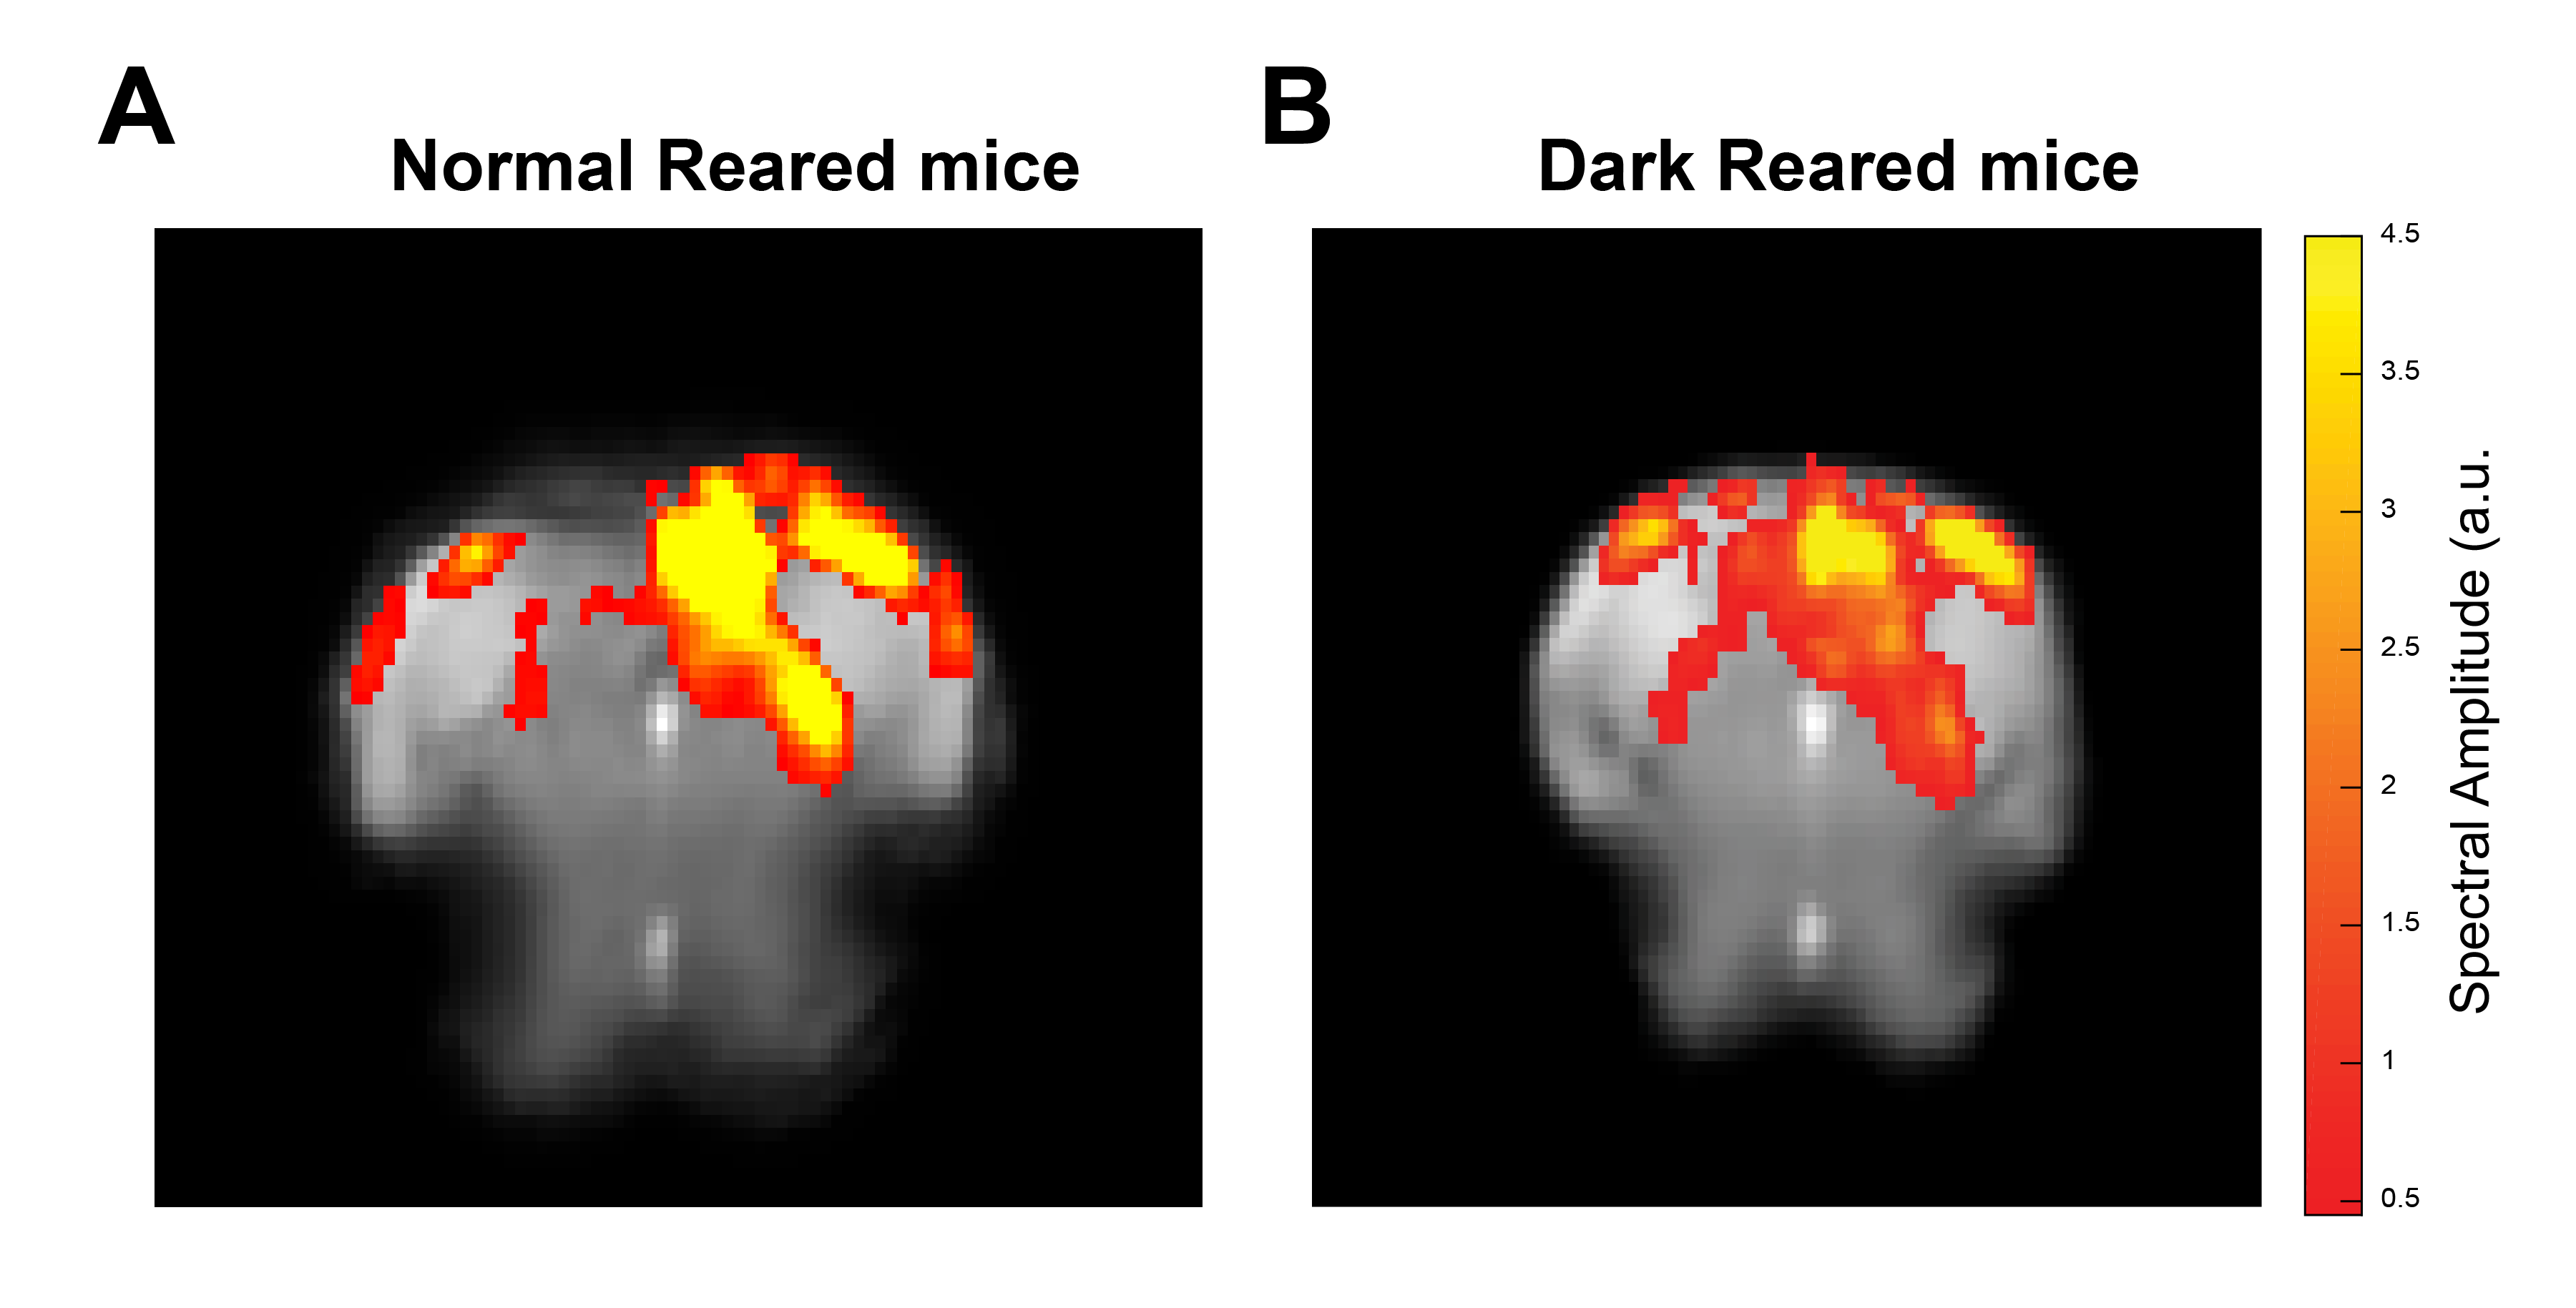
Data analysis: Manual outlier correction and motion regression were performed. To avoid GLM associated HRF assumptions, a Fourier analysis (Fig.2) was performed as in [18], where the power in frequencies associated with the stimulation paradigm was mapped voxelwise. Results were compared with data acquired for NR mice (N=5) under the same conditions.
ROIs were manually drawn (Fig.1B) based on an atlas19 and time-courses were detrended with a polynomial fit to resting periods.
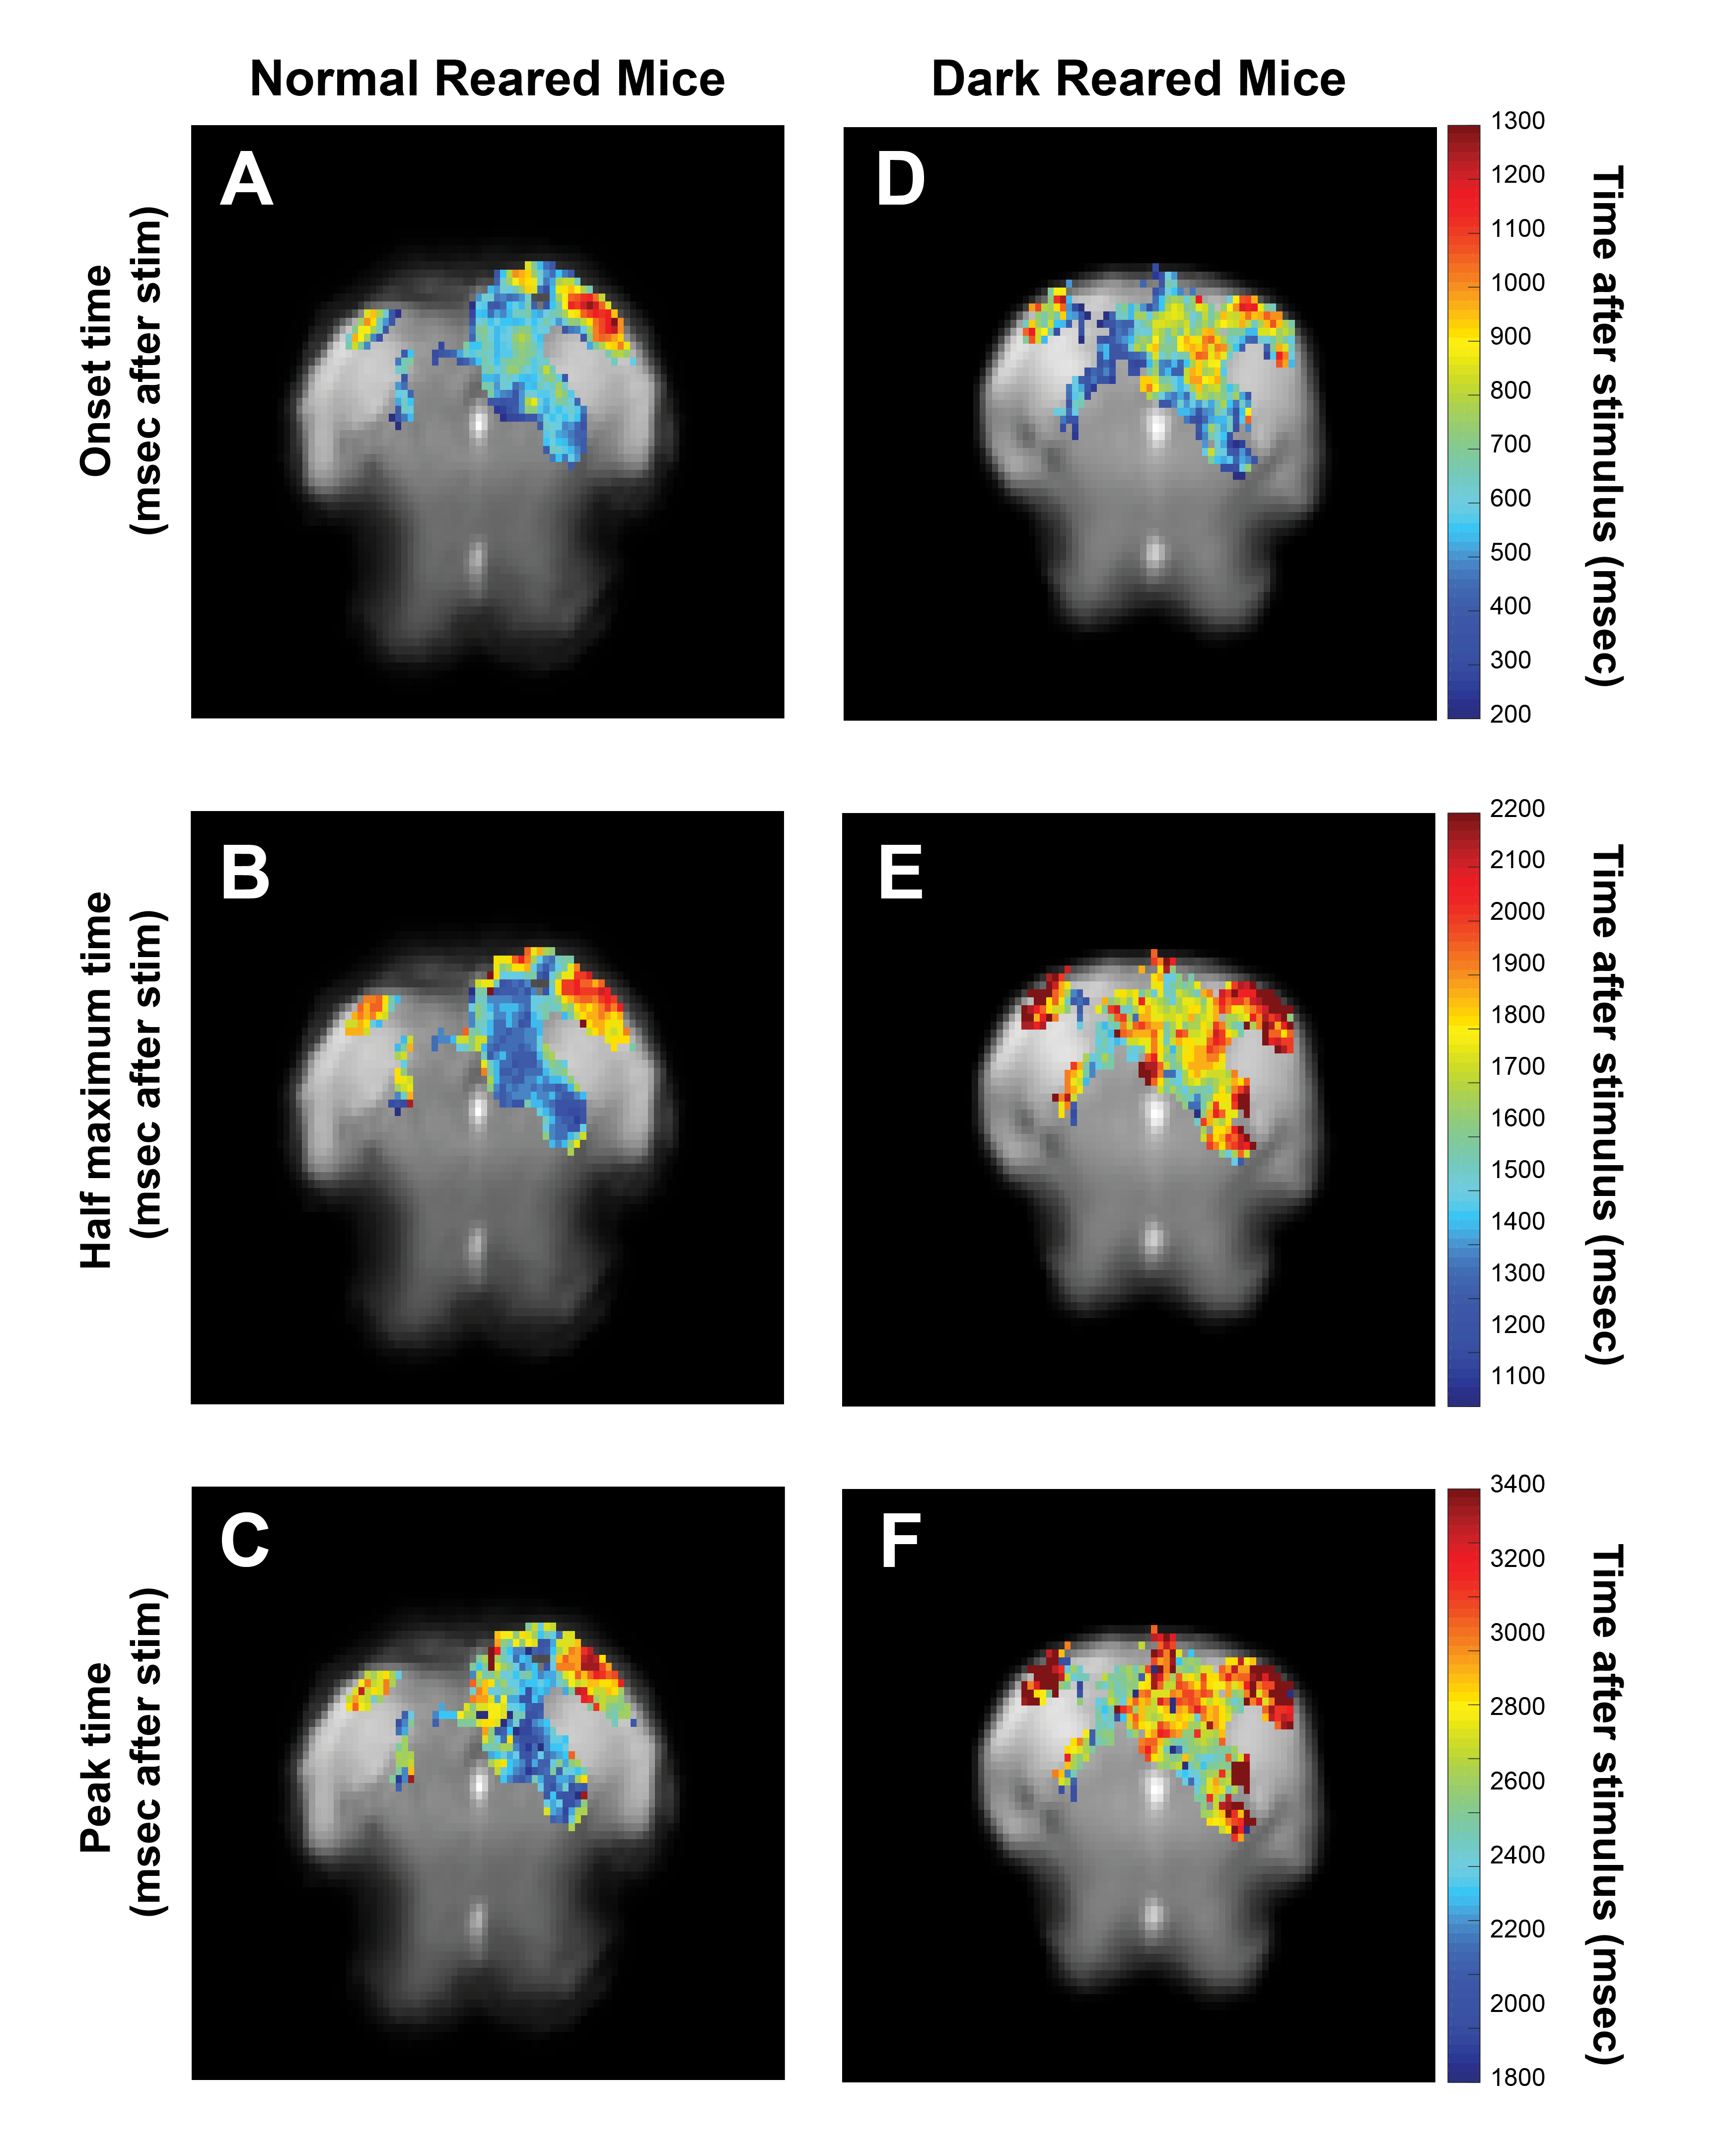
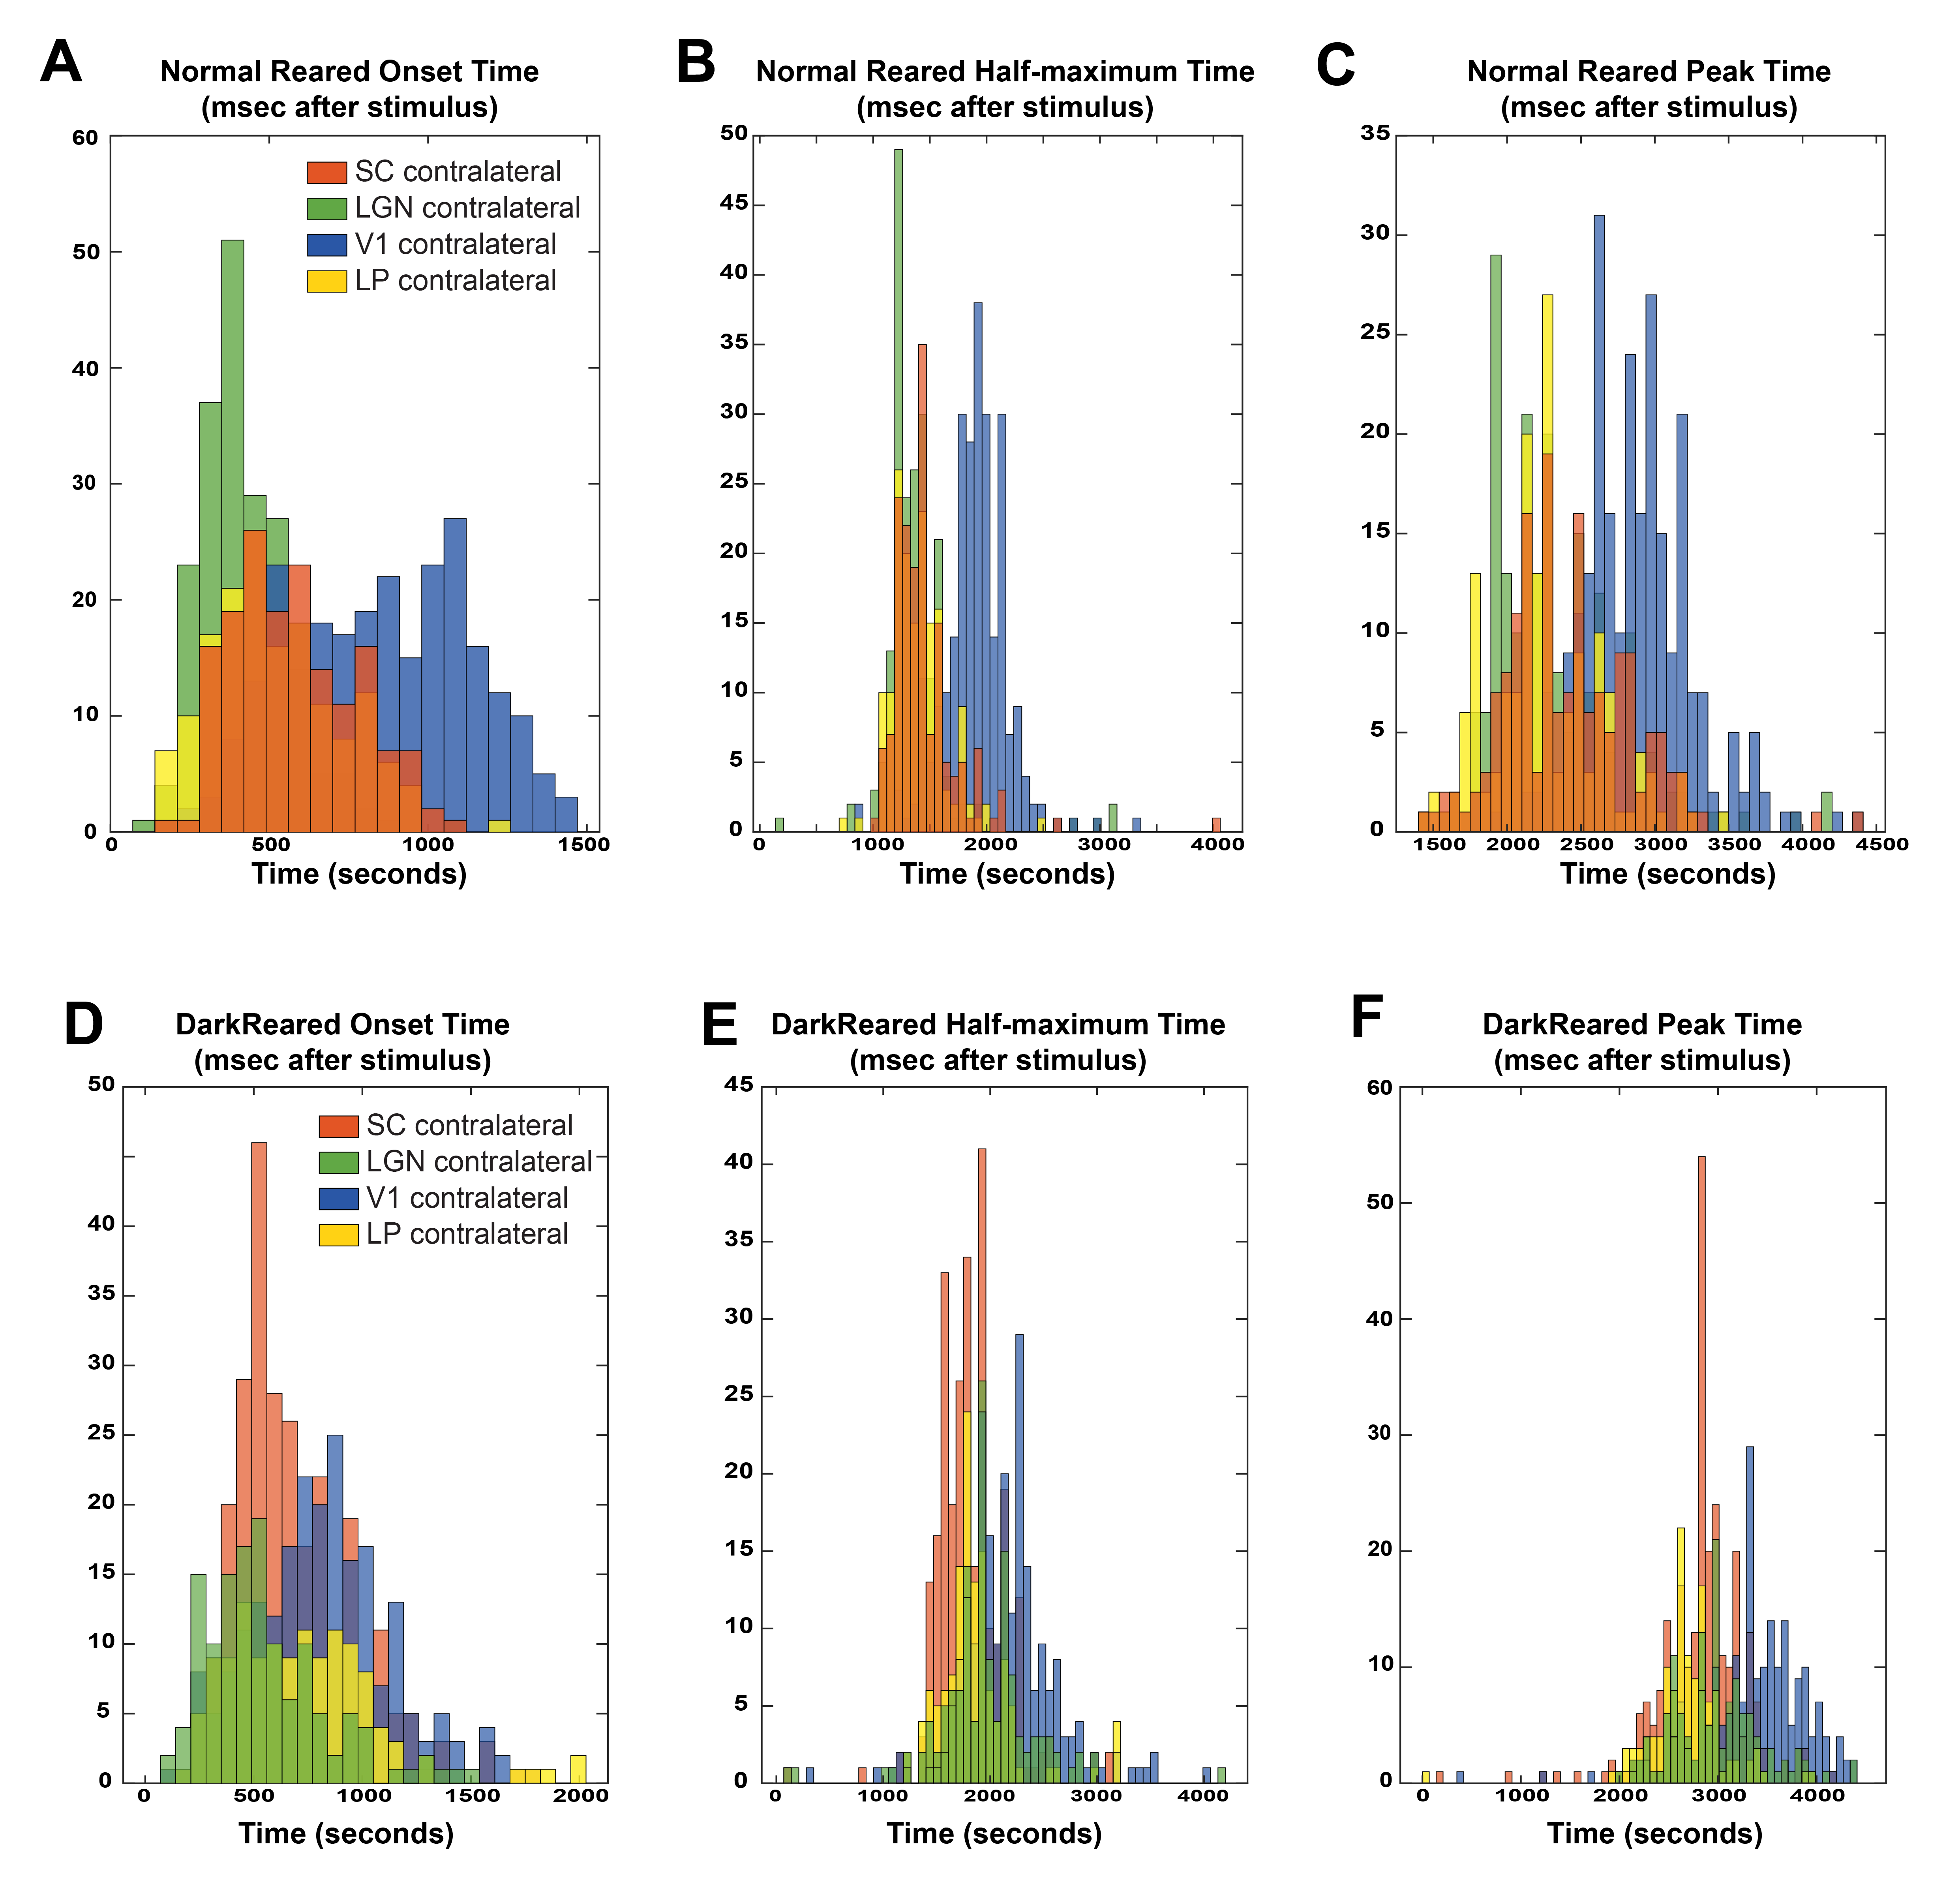
Voxelwise analysis: A Gaussian function was fitted, voxelwise, to the average BOLD response. Peak and half-maximum times were calculated as the time to maximum and half-maximum of the fitted curve, respectively. Onset times were calculated as the 5% increase time of the fitted curve. A minimum cluster of 15 voxels was imposed, and maps were masked with the Fourier maps. Individual maps were calculated to generate the histograms (Fig.4).
Results
Fig.2A shows NR group activation maps derived from Fourier analysis. Activation along the contralateral pathway and much less activation, as expected, in ipsilateral LGN and V1B area, were observed. Fig.2B shows similar maps for the DR group. Interestingly, while overall response amplitude was lower, ipsilateral responses in LGN and SC were amplified.Given the fast temporal resolution, we quantified BOLD dynamics along the pathway (Fig.3). Onset delays (reflecting neural input order) LGN~SC->VC were observed in the NR group. Remarkably, this order was lost in the DR group, and similar onsets were quantified along the entire pathway. Half-maximum and peak times evidenced less structured activation dynamics in the DR group. Histograms (Fig.4) highlight these differences with VC bins appearing closer to subcortical bins in the DR group while, in the NR group, they appear shifted towards longer times.
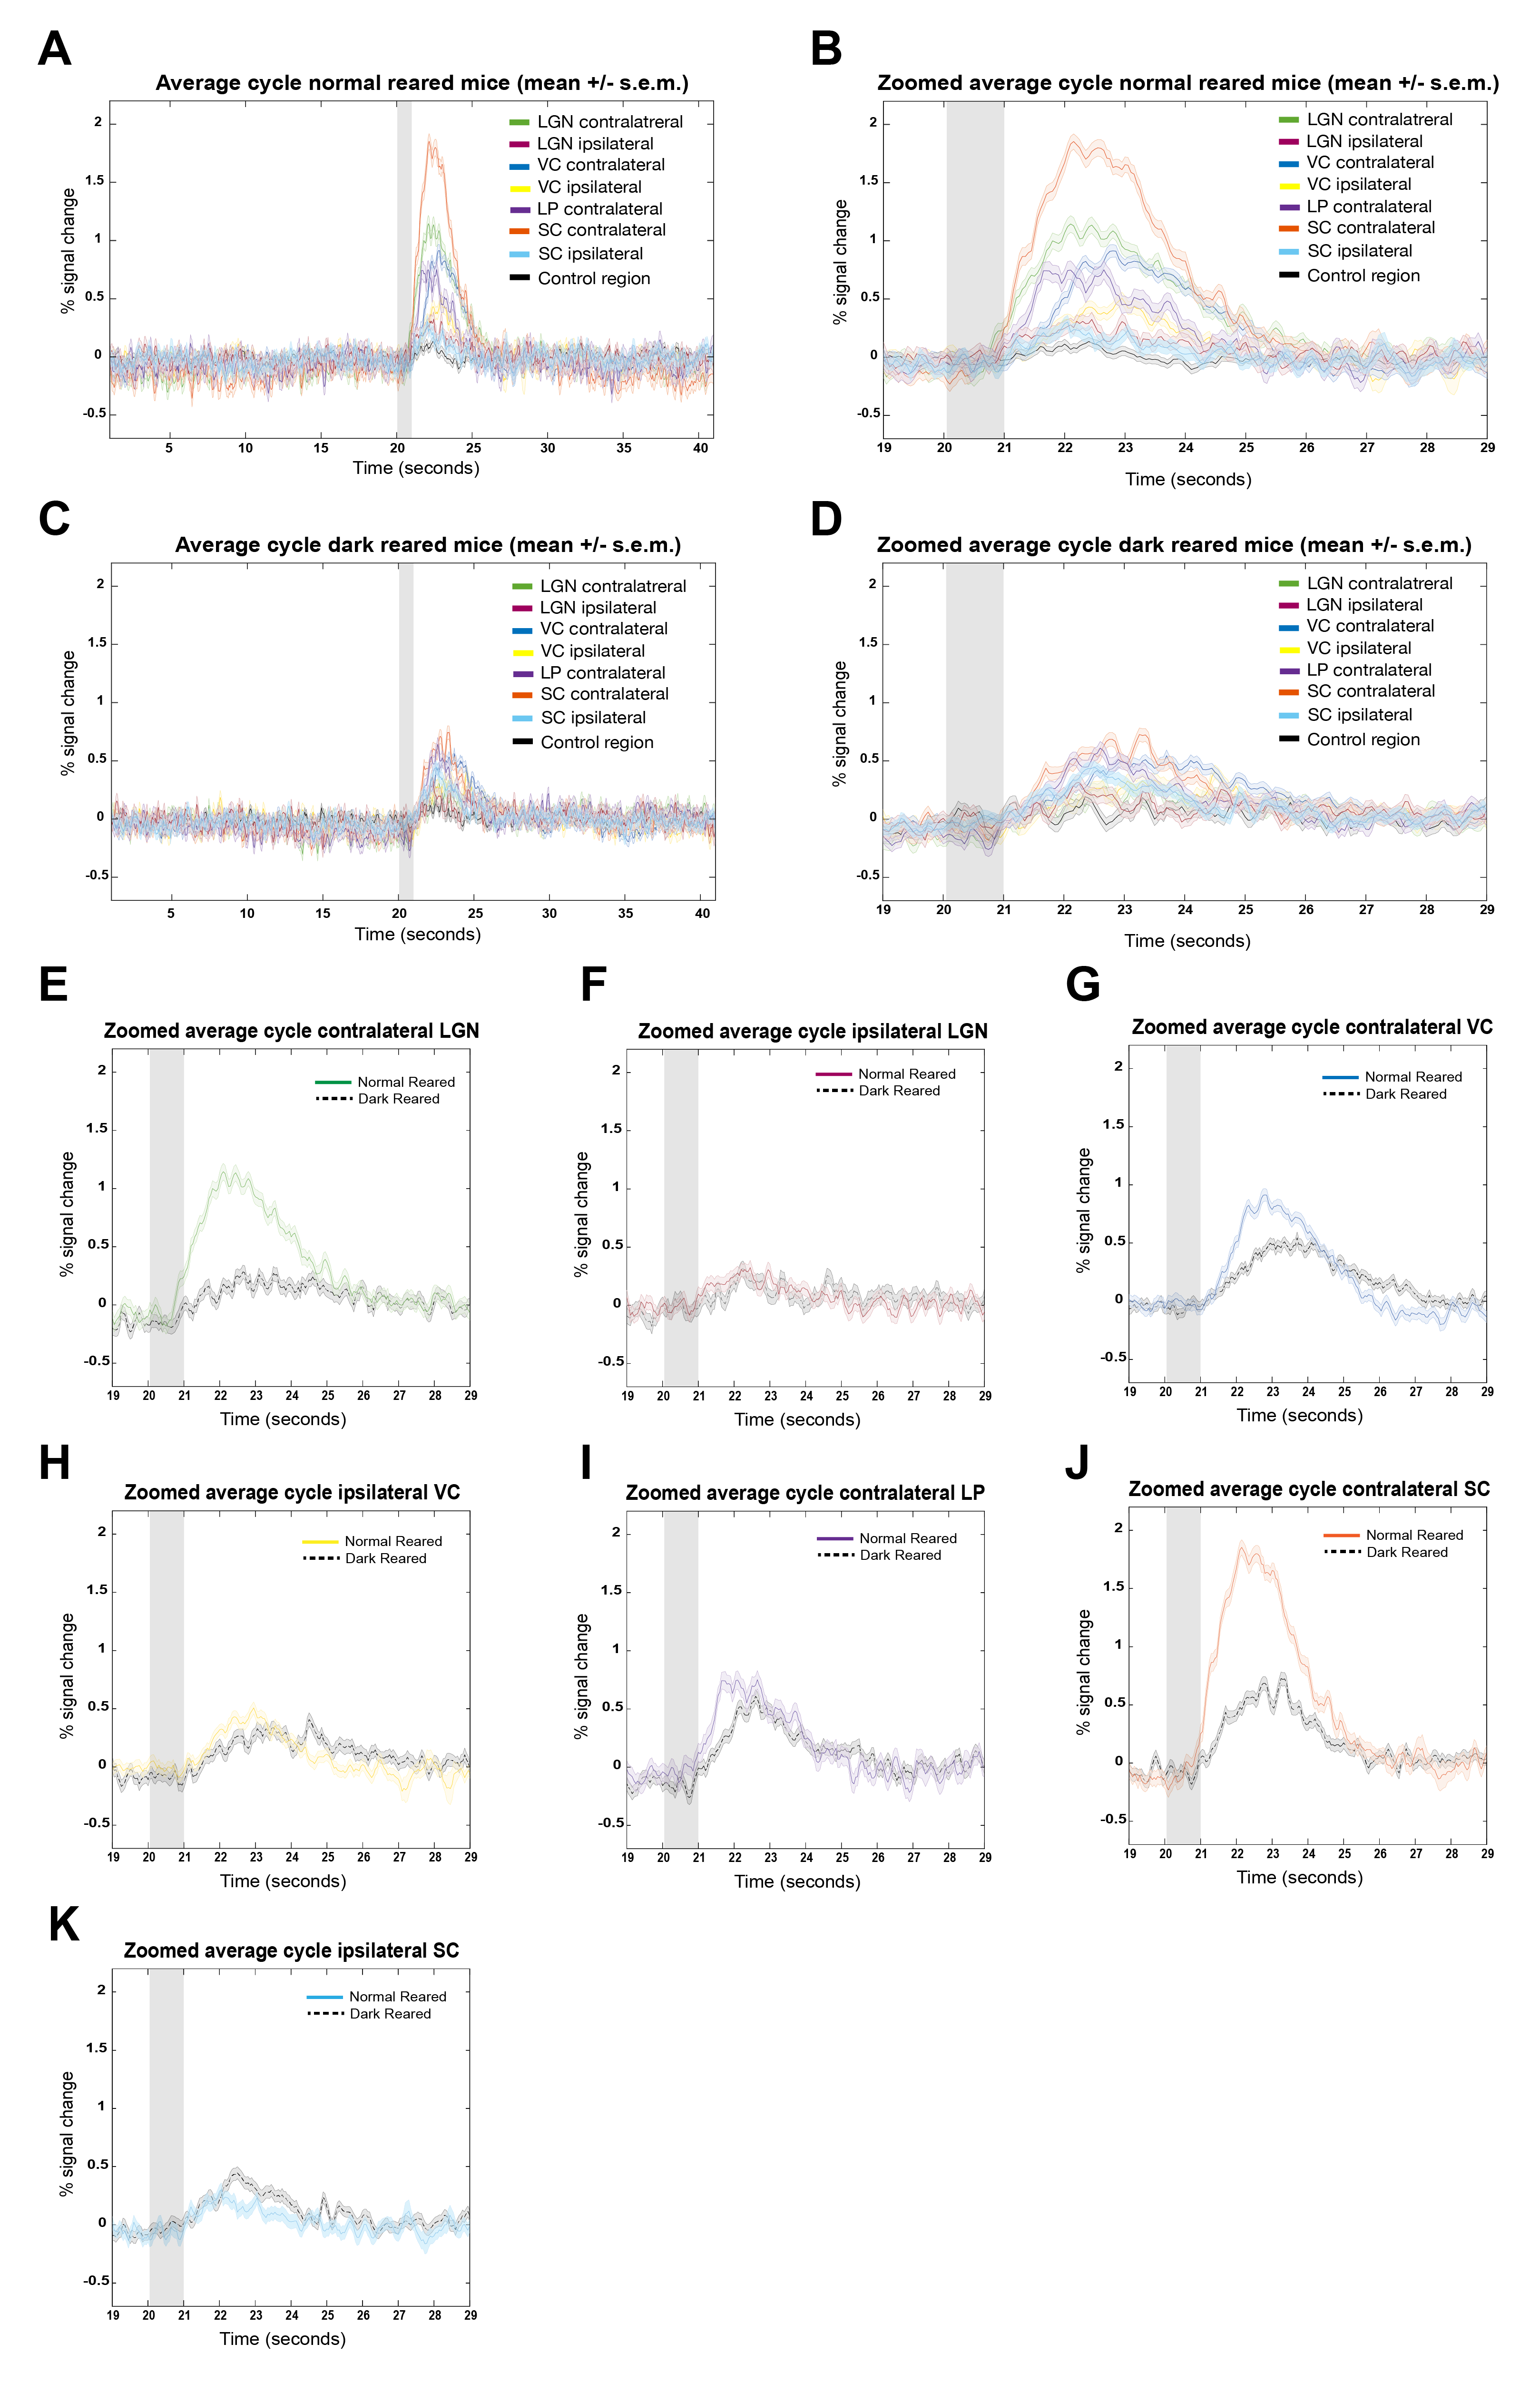
ROIs average cycles (Fig.5) corroborated the decreased DR-induced BOLD amplitudes with less differentiation of onset timings. Comparing each ROI separately (Fig.5E-K), confirms a slightly delayed response and decreased BOLD amplitude for all ROIs, with exception of ipsilateral LGN (Fig.5F), with similar NR and DR responses, and ipsilateral SC (Fig.5K), with increased DR responses.
Discussion
DR induces decreases in LGN and SC internuclear volume6, reduced retinal-ganglion cell responses1 and visual evoked potentials7,11, as well as reduced number of dendritic spines5, synaptic density and cortical thickness in VC10, suggesting dramatic changes in processing of visual information.Our findings suggest that BOLD responses are affected by DR, and the decreased amplitude in the DR group agrees with reported overall reduced flash neuronal responsiveness4. Results also suggest a plasticity effect involving the ipsilateral hemisphere as well as aberration in neural timings. The increased ipsilateral responses and similar onset times between areas probably reflect an immature, unorganized and unspecialized circuitry. Indeed, invasive methods showed absence of ocular dominance and direction/orientation tuning7,10, increased synaptic inhibition3 and intracortical excitatory/inhibitory deficits. The slight delay in subcortical onset times and the broader BOLD curves (delayed half-maximum and peak times), could reflect VC increased latency of off-responses4 and decreased vascular mass6.
Finally, our results indicate that ultrafast fMRI signals are sensitive enough to capture plastic DR effects on the visual pathway. This may assist to infer on the underlying global dynamics of plasticity in the future20-23.
Conclusions
We investigated DR-induced altered visual pathways dynamics, using ultrafast fMRI. Delayed, reduced, broader and less unilateral BOLD responses reflected an immature, unspecialized and untrained network. Results are in-line with invasive electrophysiological reports regarding DR effects1-11, highlighting the sensitivity of ultrafast fMRI to such plastic changes in the visual system.Acknowledgements
This study was supported by funding from the European Research Council (ERC) under the European Union’s Horizon 2020 research and innovation programme (Starting Grant, agreement No. 679058) and Fundação para a Ciência e Tecnologia (Portugal), project PD/BD/128297/2017. The authors acknowledge the vivarium of the Champalimaud Centre for the Unknow, a facility of CONGENTO which is a research infrastructure co-financed by Lisboa Regional Operational Programme (Lisboa 2020), under the PORTUGAL 2020 Partnership Agreement through the European Regional Development Fund (ERDF) and Fundação para a Ciência e Tecnologia (Portugal), project LISBOA-01-0145-FEDER-022170.References
[1] Tian, Ning, and David R. Copenhagen. "Visual deprivation alters development of synaptic function in inner retina after eye opening." Neuron 32.3 (2001): 439-449.
[2] Kannan, Madhuvanthi, et al. "Visual deprivation during the critical period enhances layer 2/3 GABAergic inhibition in mouse V1." Journal of Neuroscience 36.22 (2016): 5914-5919.
[3] Kreczko, Alicja, et al. "Visual deprivation decreases somatic GAD65 puncta number on layer 2/3 pyramidal neurons in mouse visual cortex." Neural plasticity 2009 (2009).
[4] Benevento, L. A., et al. "The effects of dark-rearing on the electrophysiology of the rat visual cortex." Brain research572.1-2 (1992): 198-207.
[5] Valverde, Facundo. "Rate and extent of recovery from dark rearing in the visual cortex of the mouse." Brain research 33.1 (1971): 1-11.
[6] Gyllensten, Lars, Torbjörn Malmfors, and Marie‐Louise Norrlin. "Effect of visual deprivation on the optic centers of growing and adult mice." Journal of Comparative Neurology 124.2 (1965): 149-160.
[7] Pizzorusso, Tommaso, et al. "Temporal aspects of contrast visual evoked potentials in the pigmented rat: effect of dark rearing." Vision research 37.4 (1997): 389-395.
[8] Morales, Bernardo, Se-Young Choi, and Alfredo Kirkwood. "Dark rearing alters the development of GABAergic transmission in visual cortex." Journal of Neuroscience 22.18 (2002): 8084-8090.
[9] Morales, Bernardo, Se-Young Choi, and Alfredo Kirkwood. "Dark rearing alters the development of GABAergic transmission in visual cortex." Journal of Neuroscience 22.18 (2002): 8084-8090.
[10] Gross, Charles G., and R. Jung. "Handbook of sensory physiology." (1973): 451-482.
[11] Chen, Guang, et al. "Experience-dependent emergence of beta and gamma band oscillations in the primary visual cortex during the critical period." Scientific reports 5 (2015): 17847.
[12] Noppeney, Uta, et al. "Early visual deprivation induces structural plasticity in gray and white matter." Current Biology15.13 (2005): R488-R490.
[13] Yu, X. et al. Direct imaging of macrovascular and microvascular contributions to BOLD fMRI in layers IV-V of the rat whisker-barrel cortex. Neuroimage 59, 1451–1460 (2012).
[14] Silva, A. C. & Koretsky, A. P. Laminar specificity of functional MRI onset times during somatosensory stimulation in rat. Proc. Natl. Acad. Sci. U. S. A. 99, 15182–7 (2002).
[15] Yu, X., Qian, C., Chen, D., Dodd, S. J. & Koretsky, A. P. Deciphering laminar-specific neural inputs with line- scanning fMRI. Nat. Methods 11, 55–8 (2014).
[16] Niendorf, Thoralf, et al. "Advancing cardiovascular, neurovascular and renal magnetic resonance imaging in small rodents using cryogenic radiofrequency coil technology." Frontiers in pharmacology 6 (2015): 255.
[17] Baltes, Christof, et al. "Micro MRI of the mouse brain using a novel 400 MHz cryogenic quadrature RF probe." NMR in Biomedicine: An International Journal Devoted to the Development and Application of Magnetic Resonance In vivo22.8 (2009): 834-842.
[18] Nunes, Daniel, Andrada Ianus, and Noam Shemesh. "Layer-specific connectivity revealed by diffusion-weighted functional MRI in the rat thalamocortical pathway." NeuroImage 184 (2019): 646-657.
[19] Paxinos, G; Franklin, K. Mouse Brain in Stereotaxic Coordinates. 4th Edition. (2012).
[20] van Meer, Maurits PA, et al. "Extent of bilateral neuronal network reorganization and functional recovery in relation to stroke severity." Journal of Neuroscience 32.13 (2012): 4495-4507.
[21] Dijkhuizen, Rick M., et al. "Correlation between brain reorganization, ischemic damage, and neurologic status after transient focal cerebral ischemia in rats: a functional magnetic resonance imaging study." Journal of Neuroscience 23.2 (2003): 510-517.
[22] Dijkhuizen, Rick M., et al. "Functional magnetic resonance imaging of reorganization in rat brain after stroke." Proceedings of the National Academy of Sciences 98.22 (2001): 12766-12771.
[23] van der Zijden, Jet P., et al. "Longitudinal in vivo MRI of alterations in perilesional tissue after transient ischemic stroke in rats." Experimental neurology 212.1 (2008): 207-212.
Figures