2009
Dynamic response profiling of periaqueductal grey during a bladder filling protocol using 7T functional MRI1Scannexus Ultra-High Field MRI Center, Maastricht, Netherlands, 2Department of Cognitive Neuroscience, Maastricht University, Maastricht, Netherlands, 3Department of Urology, Maastricht University, Maastricht, Netherlands, 4Department of Urology, Maastricht University Medical Center (MUMC+), Maastricht, Netherlands
Synopsis
The periaqueductal grey (PAG) is a brainstem nucleus involved in storage and voiding of urine. We developed a novel method for creating dynamic response profiles for PAG, which requires three resting state ultra-high resolution fMRI datasets to be acquired: the first when the participant has an empty bladder, the second during filling of the bladder while subjective bladder sensations are recorded, and the third with a full bladder. PAG is functionally parcellated based on the full bladder scan, after which functional connectivity between the clusters is assessed for different states of bladder sensation.
Introduction
The periaqueductal gray (PAG) has been an area of great interest in the field of bladder function. The PAG is a brainstem area that is implicated to be involved in both storage and voiding of urine. The PAG is assumed to serve as a relay station projecting afferent information from the bladder to cortical and subcortical brain areas and as a gatekeeper projecting efferent information from cortical and subcortical areas to the pons and spinal cord [1, 2]. As such, its role in relation to symptoms of overactive bladder (OAB) is of high interest to both researchers and clinicians. We present a novel approach that generates a dynamic response profile for PAG as a function of bladder volume. This dynamic response profile, when established in healthy controls, can serve as a benchmark to which OAB patients’ response profiles can be compared.Methods
The development of this novel methodological approach is explained on basis of data from one healthy volunteer, but validated with data acquired from both healthy controls and OAB patients. For constructing a PAG DRP, three resting state fMRI scans are acquired at 7T (multiband echo-planar imaging sequence, acceleration factor = 2, MB-factor = 2, TR = 1400ms, TE = 22ms, resolution = 1.1 x 1.1 x 1.1mm, 40 slices covering the brain stem). The first scan (420 volumes) was acquired with an empty bladder, the second scan (length varies between participants, in this case: 213 volumes) during artificial filling of the bladder using a catheter until the participant indicated a strong urge to void, and the third scan (420 volumes) was run with a full bladder. During bladder filling, subjective bladder sensations were recorded using a custom Matlab script that could be controlled by a joystick during scanning. The participant continuously indicated its sensation of bladder fullness through a visual analogue scale, and the desire to void through a 4-point perception of intensity of urgency scale. Combined with the empty and full bladder runs, we had five states of interest: 1) empty bladder, 2) partially filled bladder without sensation of bladder filling, 3) first sensation of bladder filling, 4) first desire to void, 5) strong desire to void. Functional data were preprocessed using BrainVoyager 20.6. We drew an individual PAG mask, on which we computed a voxel-by-voxel correlation matrix based on the functional time course of each voxel during the full bladder scan. We then parcellated this matrix using the Louvain module detection algorithm (Fig. 1.A), which outputs clusters with stronger within-cluster connectivity than between-cluster connectivity [3]. Next, the correlations between the different clusters at the five different states of bladder sensation were calculated, which yields the dynamic response profile. We fitted a second degree polynomial to the data points, and statistically tested the amplitude of the polynomial using a non-parametric permutation test.Results
The modularity Q value resulting from our parcellation of the full bladder scan using the Louvain module detection algorithm was above 0.4, which is an indicator of a modular underlying data structure. The parcellation procedure on the representative subject used in the figures yields a subdivision of the PAG into three distinct clusters. The change in functional connectivity as a function of bladder state between PAG clusters 2 and 3 was significant (p = 0.016) after correcting for multiple comparisons using a false discovery rate (q = 0.05). The patterns of connectivity between clusters 1 & 2, and 1 & 3 did not reach statistical significance (Fig. 1.B).Discussion
Our results indicate that parcellating PAG based on resting state measurements in a full bladder state yields distinct sub clusters, which in turn show distinct dynamic connectivity patterns between each other when different sensory states of bladder filling are considered. These dynamic response patterns can be seen as intrinsic 'fingerprints' of PAG's specific role in overall bladder control. These response patterns can potentially serve as indicators of pathology. This in turn opens new possibilities to investigate the effects of treatments of lower urinary tract symptoms on signal processing in the PAG.Acknowledgements
No acknowledgement found.References
1. Fowler, C.J., D. Griffiths, and W.C. de Groat, The neural control of micturition. Nat Rev Neurosci, 2008.9 (6): 453-66.
2. Zare, A., Jahanshahi, A., Rahnama’i, M. S., Schipper, S., & van Koeveringe, G. A. (2018). The Role of the Periaqueductal Gray Matter in Lower Urinary Tract Function. Molecular neurobiology, 1-15.
3. Fortunato, S. (2010). Community detection in graphs. Physics reports, 486(3), 75-174.
Figures
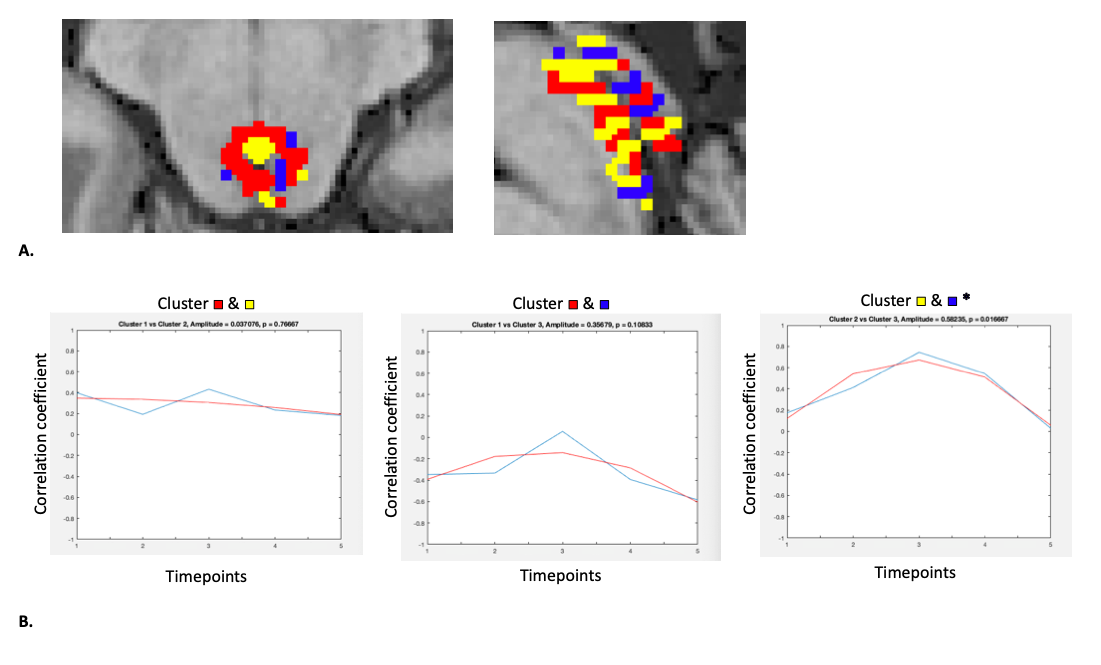
Figure 1.A: Transversal and sagittal view, respectively, of the clusters identified using the Louvain module detection algorithm in the full bladder resting state MRI scan of the participant.
B: Timepoints are as follows: 1 = empty bladder, 2 = no sensation of bladder filling, 3 = first sensation of bladder filling, 4 = first desire to void, 5 = high desire to void. In blue: The observed correlations between clusters for each timepoint. In red: the fitted curve. * = significant at the 0.05 level after correction for multiple comparisons (FDR, q = 0.05 ).