1996
Glutamatergic involvement of left DLPFC and left anterior insula in treatment resistant major depressive disorder1Imaging Institute, Cleveland Clinic, Cleveland, OH, United States, 2Radiology, Cleveland Clinic Lerner College of Medicine, CLEVELAND, OH, United States, 3Neurogolical Institute, Cleveland Clinic, Cleveland, OH, United States
Synopsis
Six subjects with treatment resistant major depressive disorder (MDD) were scanned with resting state functional connectivity (rsfMRI)and GABA/Glx editing protocol. rsFMRI between left dorsolateral prefrontal cortex (lDLPFC) and left anterior insula (lAI), two nodes of physiological importance in MDD, inversely correlated with Glx at DLPFC. No such association was observed between rsfMRI and GABA. lDLPFC-lAI rsfMRI, lDLPFC GABA or Glx levels did not correlate with disease severity. The results suggest a collective role of lDLPFC and lAI in MDD via a glutamatergic mechanism.
INTRODUCTION
Dorsolateral prefrontal cortex (DLPFC, associated with cognitive and executive functions) and left anterior insula (lAI, associated with sensory salient and emotional feelings) play important roles in the physiology of major depressive disorder (MDD).1,2 (i) Resting state functional connectivity (rsfMRI) between pregenual anterior cingulate cortex (pgACC) and AI, and (ii) glutamate+glutamine (Glx) at pgACC have been reported to be associated with depression severity, and to be inversely correlated with each other in MDD.3 Since left DLPFC (lDLPFC) is an effective site of application of transcranial magnetic stimulation therapy for MDD, and the role of lDLPFC Glx in treatment-resistant MDD,4,5 an investigation of (i) rsfMRI between lDLPFC and AI and (ii) lDLPFC Glx level in MDD and an association of the two metrics is required to better understand the role of excitatory neurotransmitter in rsfMRI in MDD. Inhibitory neurotransmitter GABA was also measured in this study but is not described in detail due to the focus of the study on Glx.METHODS
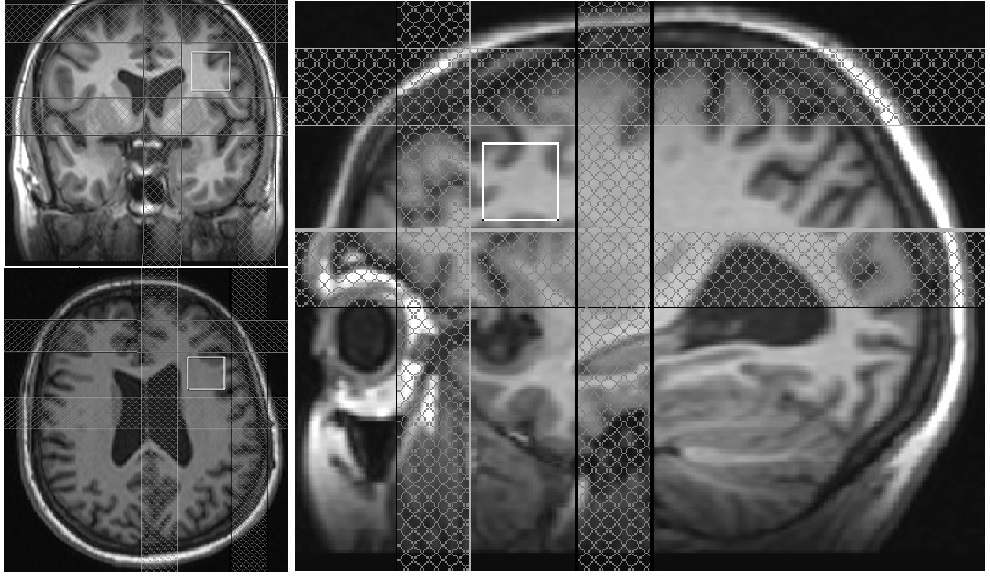
Motion free rsfMRI and spectroscopy data from six subjects (56±12 y, range 40-70 y, 1 male) with treatment-resistant MDD were obtained on a 3T whole body Siemens Prisma scanner (Siemens Healthineers, Erlangen, Germany) with a 20-channel head-neck coil under an institutional review board approved protocol. All subjects satisfied the DSM-IV-TR crietria for inadequately responsive MDD to a single antidepressant treatment despite an adequate dosage for at least 8 weeks and Hamilton Depression rating (HAM-D) score of >15). rsfMRI data were acquired with a 2D GRE echoplanar scan (TR/TE=2800/29 ms, 31 slices, slice thickness 4-mm, no gap, 128×128 matrix, 256-mm × 256-mm FOV, bandwidth 1954 Hz/pixel, 6/8 partial Fourier, 137 repetitions). Physiologic fluctuations were monitored with pulse plethysmograph and respiratory bellow. A 20×20×20 mm3 voxel at left DLPFC (Fig. 1) was scanned using a MEGA-PRESS6,7 sequence with the following parameters: TR=2.7 s, TE=68 ms, editing pu pulse frequencies = 1.9 (ON resonance) and 1.5 ppm (OFF resonance -- placed symmetrically across 1.7 ppm macromolecule (MM) resonance to minimize MM contamination8 of GABA) and editing pulsewidth = 44 Hz. A bite bar was used during all scans to minimize motion and all subjects were instructed to keep eyes closed during rsfMRI scans. rsfMRI data analysis comprised of: (i) rejection of 1st 4 data-points from timeseries, (ii) physiologic noise correction using RETROICOR,9 (iii) Volume- and slice-wise motion were corrected using SLOMOCO.10 , (iv) 2d spatial filtering in Fourier domain, followed by temporal filtering to remove all fluctuations above 0.08 Hz, (v) creating 9 voxel lDLPFC seed based upon maximum correlation with left ACC using InstaCorr routine of AFNI,11 (vi) creating whole brain correlation map with lDLPFC voxel as seed, (vii) converting the correlation to Student’s t, (viii) generating a whole-brain z-scored connectivity map by normalizing the Student’s t distribution to zero mean and unit variation,12 (ix) creating 9-voxel lAI target based upon maximum correlation with lDLPFC, and (x) computing the mean within the lAI ROI from the z-scored connectivity map. The seed selection was also guided by the connectivity-based brain atlas (rbmars.dds.nl/CBPatlases.htm). MEGA-PRESS data analysis using jMRUI software13 (version 4.0) consisted of (i) zero order phase correction with respect to residual water peak, (ii) frequency alignment, (iii) adding the ON and OFF resonance subspectra separately, (iv) applying a 5 Hz Gaussian apodization filter, (v) subtracting the OFF spectrum from the ON spectrum to obtain the edited spectrum. Motion during scan was assessed by tracking residual water signal as in Ref.14 Glx/Cr (also GABA/Cr) were calculated from ratios of the areas under the 3.75 ppm Glx (3.02 ppm GABA) resonance peaks in the edited spectrum and the 3 ppm creatine peak in the OFF resonance spectrum were calculated.RESULTS AND DISCUSSION
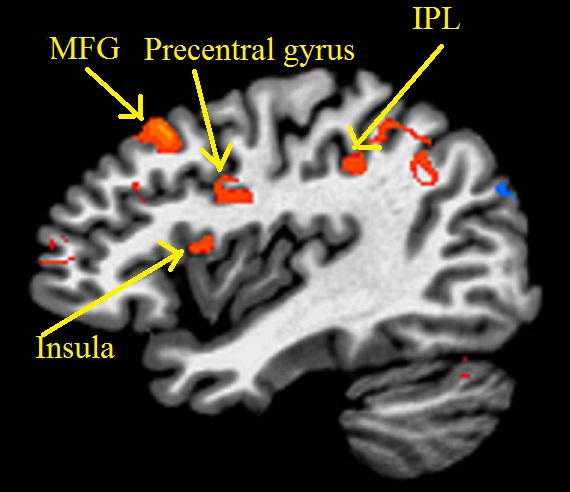
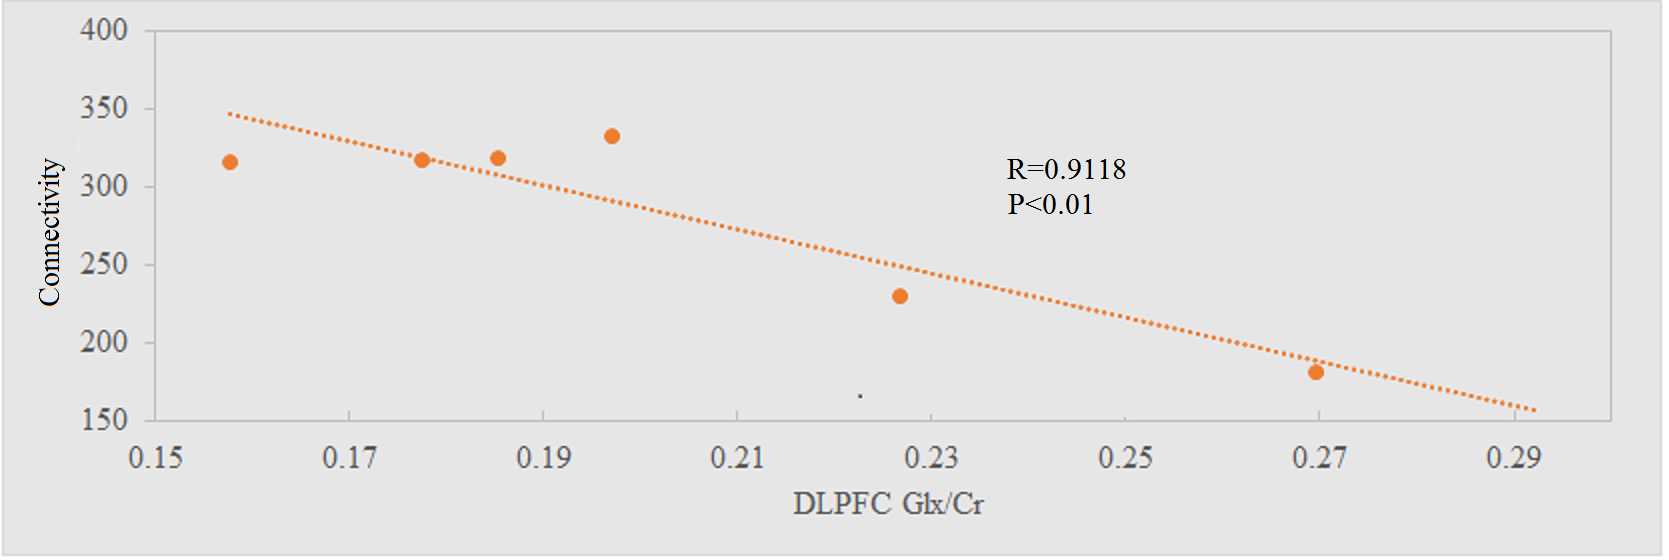
Representative single-subject z-scored rsfMRI map with lDLPFC seed (P<0.001) and edited spectrum are shown in Fig. 2 and 3 respectively. Glx/Cr and GABA/Cr ratios did not correlate with HAM-D. While significant inverse correlation (P<0.005) between Glx/Cr and rsfMRI was observed (Fig. 4), GABA/Cr showed no such association. The inverse correlation of lDLPFC Glx/Cr with lDLPFC and lAI connectivity is similar to previously reported correlation between pgACC Glx/Cr and pgACC-lAI connectivity.3 This validates the collective role of lDLPFC and lAI in MDD via a glutamatergic mechanism. However unlike pgACC-lAI connectivity, the lDLPFC-lAI connectivity did not show any association with HAM-D. Increased rsfMRI between lDLPFC and Moreover the results suggest that lDLPFC-lAI connectivity in MDD is not driven by the inhibitory neurotransmitter GABA.CONCLUSION
Resting state functional connectivity between lDLPFC and lAI in treatment-resistant MDD increases with a decrease in the glx (including the excitatory neurotransmitter glutamate) level at lDLPFC. However none of these metrics are associated with the severity of depression. The findings validate a glutamatergic involvement in the lDLPFC-lAI connectivity in MDD.Acknowledgements
We are grateful to Sineyob Ahn and Mark A Brown from Siemens Healthineers for their support with the MEGA-PRESS sequence used in this study.
FASTESTMAP sequence, used for shimming, was developed by Edward J. Auerbach and Malgorzata Marjanska and were provided by the University of Minnesota under a C2P agreement.
Cleveland Clinic Research Program Committee partially funded this project.
References
1. Koenigs M, Grafman J. The functional neuroanatomy of depression: distinct roles for ventromedial and dorsolateral prefrontal cortex. Behav Brain Res. 2009;201(2):239-243.
2. Sliz D, Hayley S. Major depressive disorder and alterations in insular cortical activity: a review of current functional magnetic imaging research. Front Hum Neurosci. 2012;6:323.
3. Horn DI, Yu C, Steiner J, et al. Glutamatergic and resting-state functional connectivity correlates of severity in major depression - the role of pregenual anterior cingulate cortex and anterior insula. Front Syst Neurosci. 2010;4.
4. Levitt JG, Kalender G, O'Neill J, et al. Dorsolateral prefrontal gamma-aminobutyric acid in patients with treatment-resistant depression after transcranial magnetic stimulation measured with magnetic resonance spectroscopy. J Psychiatry Neurosci. 2019;44(6):386-394.
5. Bhattacharyya PK, Altinay M, Anand A. Modulation of dorsolateral prefrontal cortex GABA and Glx (glutamate + glutamine) levels following repetitive magnetic stimulation therapy of major depressive disorder. Proc. Intl. Soc. Mag. Reson. Med. 2019;27:0191.
6. Mescher M, Merkle H, Kirsch J, Garwood M, Gruetter R. Simultaneous in vivo spectral editing and water suppression. NMR Biomed. 1998;11(6):266-272.
7. Terpstra M, Ugurbil K, Gruetter R. Direct in vivo measurement of human cerebral GABA concentration using MEGA-editing at 7 Tesla. Magn Reson Med. 2002;47(5):1009-1012.
8. Henry PG, Dautry C, Hantraye P, Bloch G. Brain GABA editing without macromolecule contamination. Magn Reson Med. 2001;45(3):517-520.
9. Glover GH, Li TQ, Ress D. Image-based method for retrospective correction of physiological motion effects in fMRI: RETROICOR. Magn Reson Med. 2000;44(1):162-167.
10. Beall EB, Lowe MJ. SimPACE: generating simulated motion corrupted BOLD data with synthetic-navigated acquisition for the development and evaluation of SLOMOCO: a new, highly effective slicewise motion correction. Neuroimage. 2014;101:21-34.
11. Cox RW. AFNI: software for analysis and visualization of functional magnetic resonance neuroimages. Comput Biomed Res. 1996;29(3):162-173.
12. Lowe MJ, Mock BJ, Sorenson JA. Functional connectivity in single and multislice echoplanar imaging using resting-state fluctuations. Neuroimage. 1998;7(2):119-132.
13. http://www.mrui.uab.es/mrui/.
14. Bhattacharyya PK, Phillips MD, Stone LA, Bermel RA, Lowe MJ. Sensorimotor cortex gamma-aminobutyric acid concentration correlates with impaired performance in patients with MS. AJNR Am J Neuroradiol. 2013;34(9):1733-1739.
Figures