1990
Dynamic characteristics of functional connectivity in the first-episode and treatment-naive patients with obsessive-compulsive disorder1The First Affiliated Hospital of Zhengzhou University, Zhengzhou, China, 2GE Healthcare, MR Research China, Beijing, China
Synopsis
Compared with task-activation studies, dynamics are potentially even more prominent during resting-state, when mental activity is unconstrained. To assess whole-brain dynamic functional connectivity of first-episode and treatment-naive patients with obsessive-compulsive disorder (OCD), we used a series of methods including independent component analysis, sliding windows and k-means clustering. Our results indicated that OCD groups displayed more transitions between different states than healthy controls. This change was positively correlated with clinical scale scores, potentially contributing to better understanding of the dynamic neural mechanism of OCD.
Introduction
Human brain is never in static state. A growing number of studies have indicated that the functional connectivity (FC) shows noticeable variations in the resting-state without external stimuli, and dynamic FC (dFC) captures the temporal variance of FC at shorter time windows compared to static FC (sFC). 1-4 To our knowledge, no functional magnetic resonance imaging (fMRI) studies have focused on the dynamics differences of the resting-state fMRI (rs-fMRI) in obsessive-compulsive disorder (OCD) yet. The purpose of this study was to assess whole-brain dFC of first-episode and treatment-naive OCD patients based on spatial independent component analysis (ICA), sliding time window correlation, and k-means clustering of windowed correlation matrices.Methods
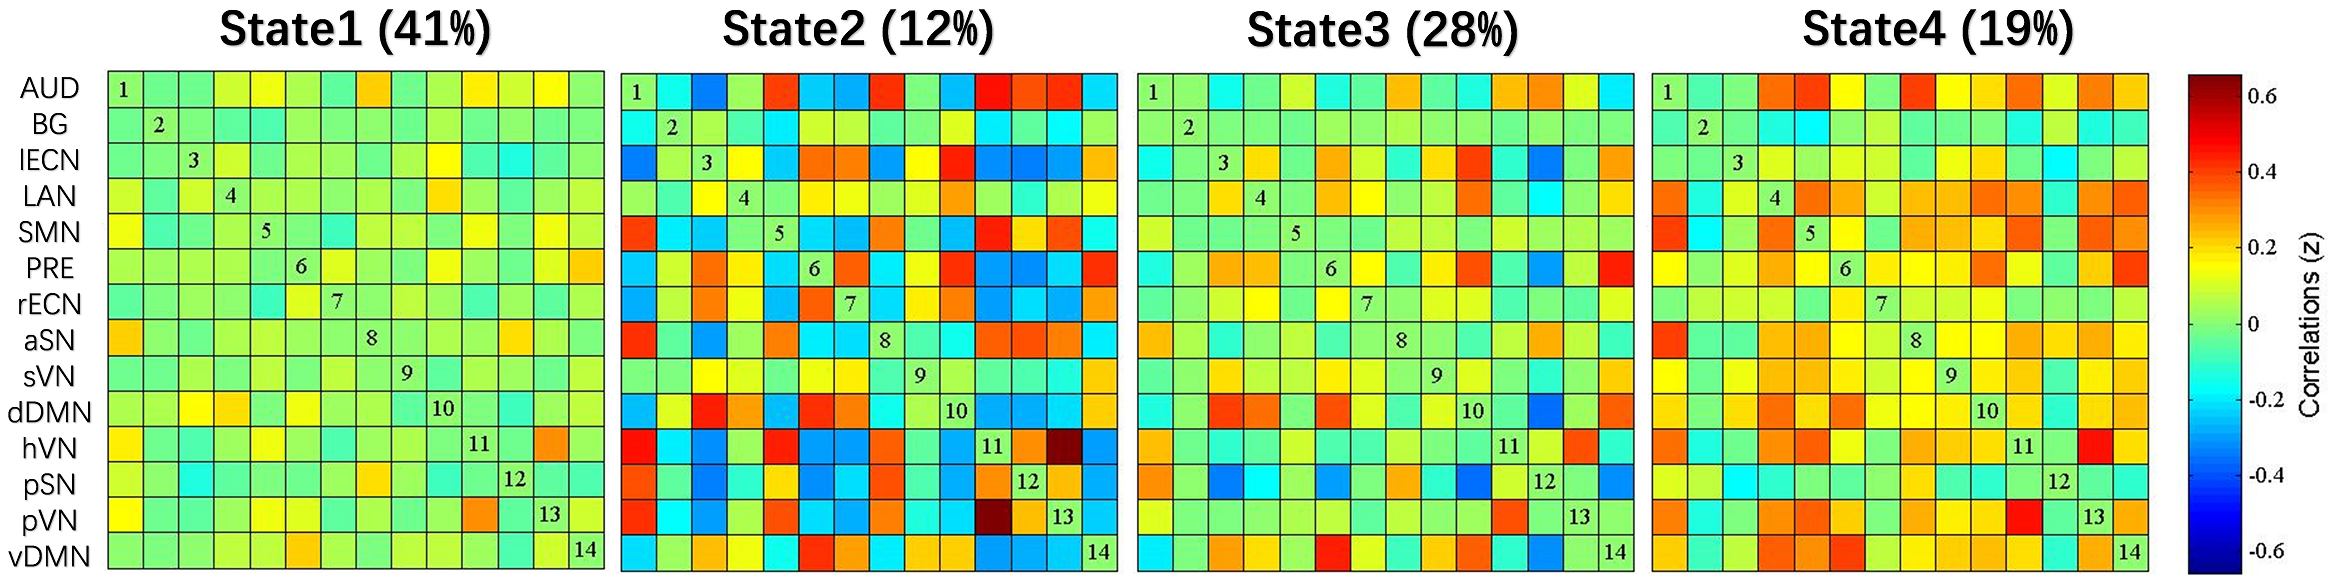
Twenty-nine patients in our hospital diagnosed as first-episode OCD according to the criteria of DSM-IV were recruited as the case group. Twenty-nine healthy controls (HCs), with matched age, gender, and education, were recruited by advertisements. The rs-fMRI scan was performed on a 3.0 Tesla MR scanner (Discovery MR750, General Electric, Milwaukee, WI, USA) at our hospital. The scanning consisted of 180 contiguous volumes, which were obtained using a gradient echo-planar imaging sequence using blood oxygen level dependent (BOLD) technique. Parameters for this sequence are as follows: repetition time = 2000 ms; echo time = 30 ms; slices = 32; thickness = 4 mm; resolution matrix =64 × 64; flip angle = 90º; field of view = 220 × 220 mm2; slice gap = 0.5 mm. The rs-fMRI images were preprocessed using the Data Processing Assistant for Rs-fMRI Advanced Edition (DPARSFA) 5 based on SPM8. Spatial ICA was performed to decompose all preprocessed data into 28 functional components (automatic estimation) using the GICA of fMRI Toolbox (GIFT).We subsequently evaluated group differences in functional network connectivity in a dynamic sense, which was computed by using sliding windows (20 TR in length) 6 and k-means clustering to characterize four discrete functional connectivity states (elbow criterion) (Figure 1). Then, three temporal metrics of connectivity state expression derived from each subject’s state vector 7 were calculated (Figure 2): (1) fraction of time spent in each state; (2) mean dwell time in each state; (3) number of transitions. Yale-brown obsessive–compulsive scale (Y-BOCS) was used to assess the severity of OCD symptoms. Because the distribution of the three temporal metrics was non-normal, spearman’s (rank) correlation was used to test the correlation between the behavioral score and connectivity state expression. Multiple comparisons were performed using the false discovery rate (FDR). We also validated our main results using different sliding window lengths (W = 22 TR).7Results
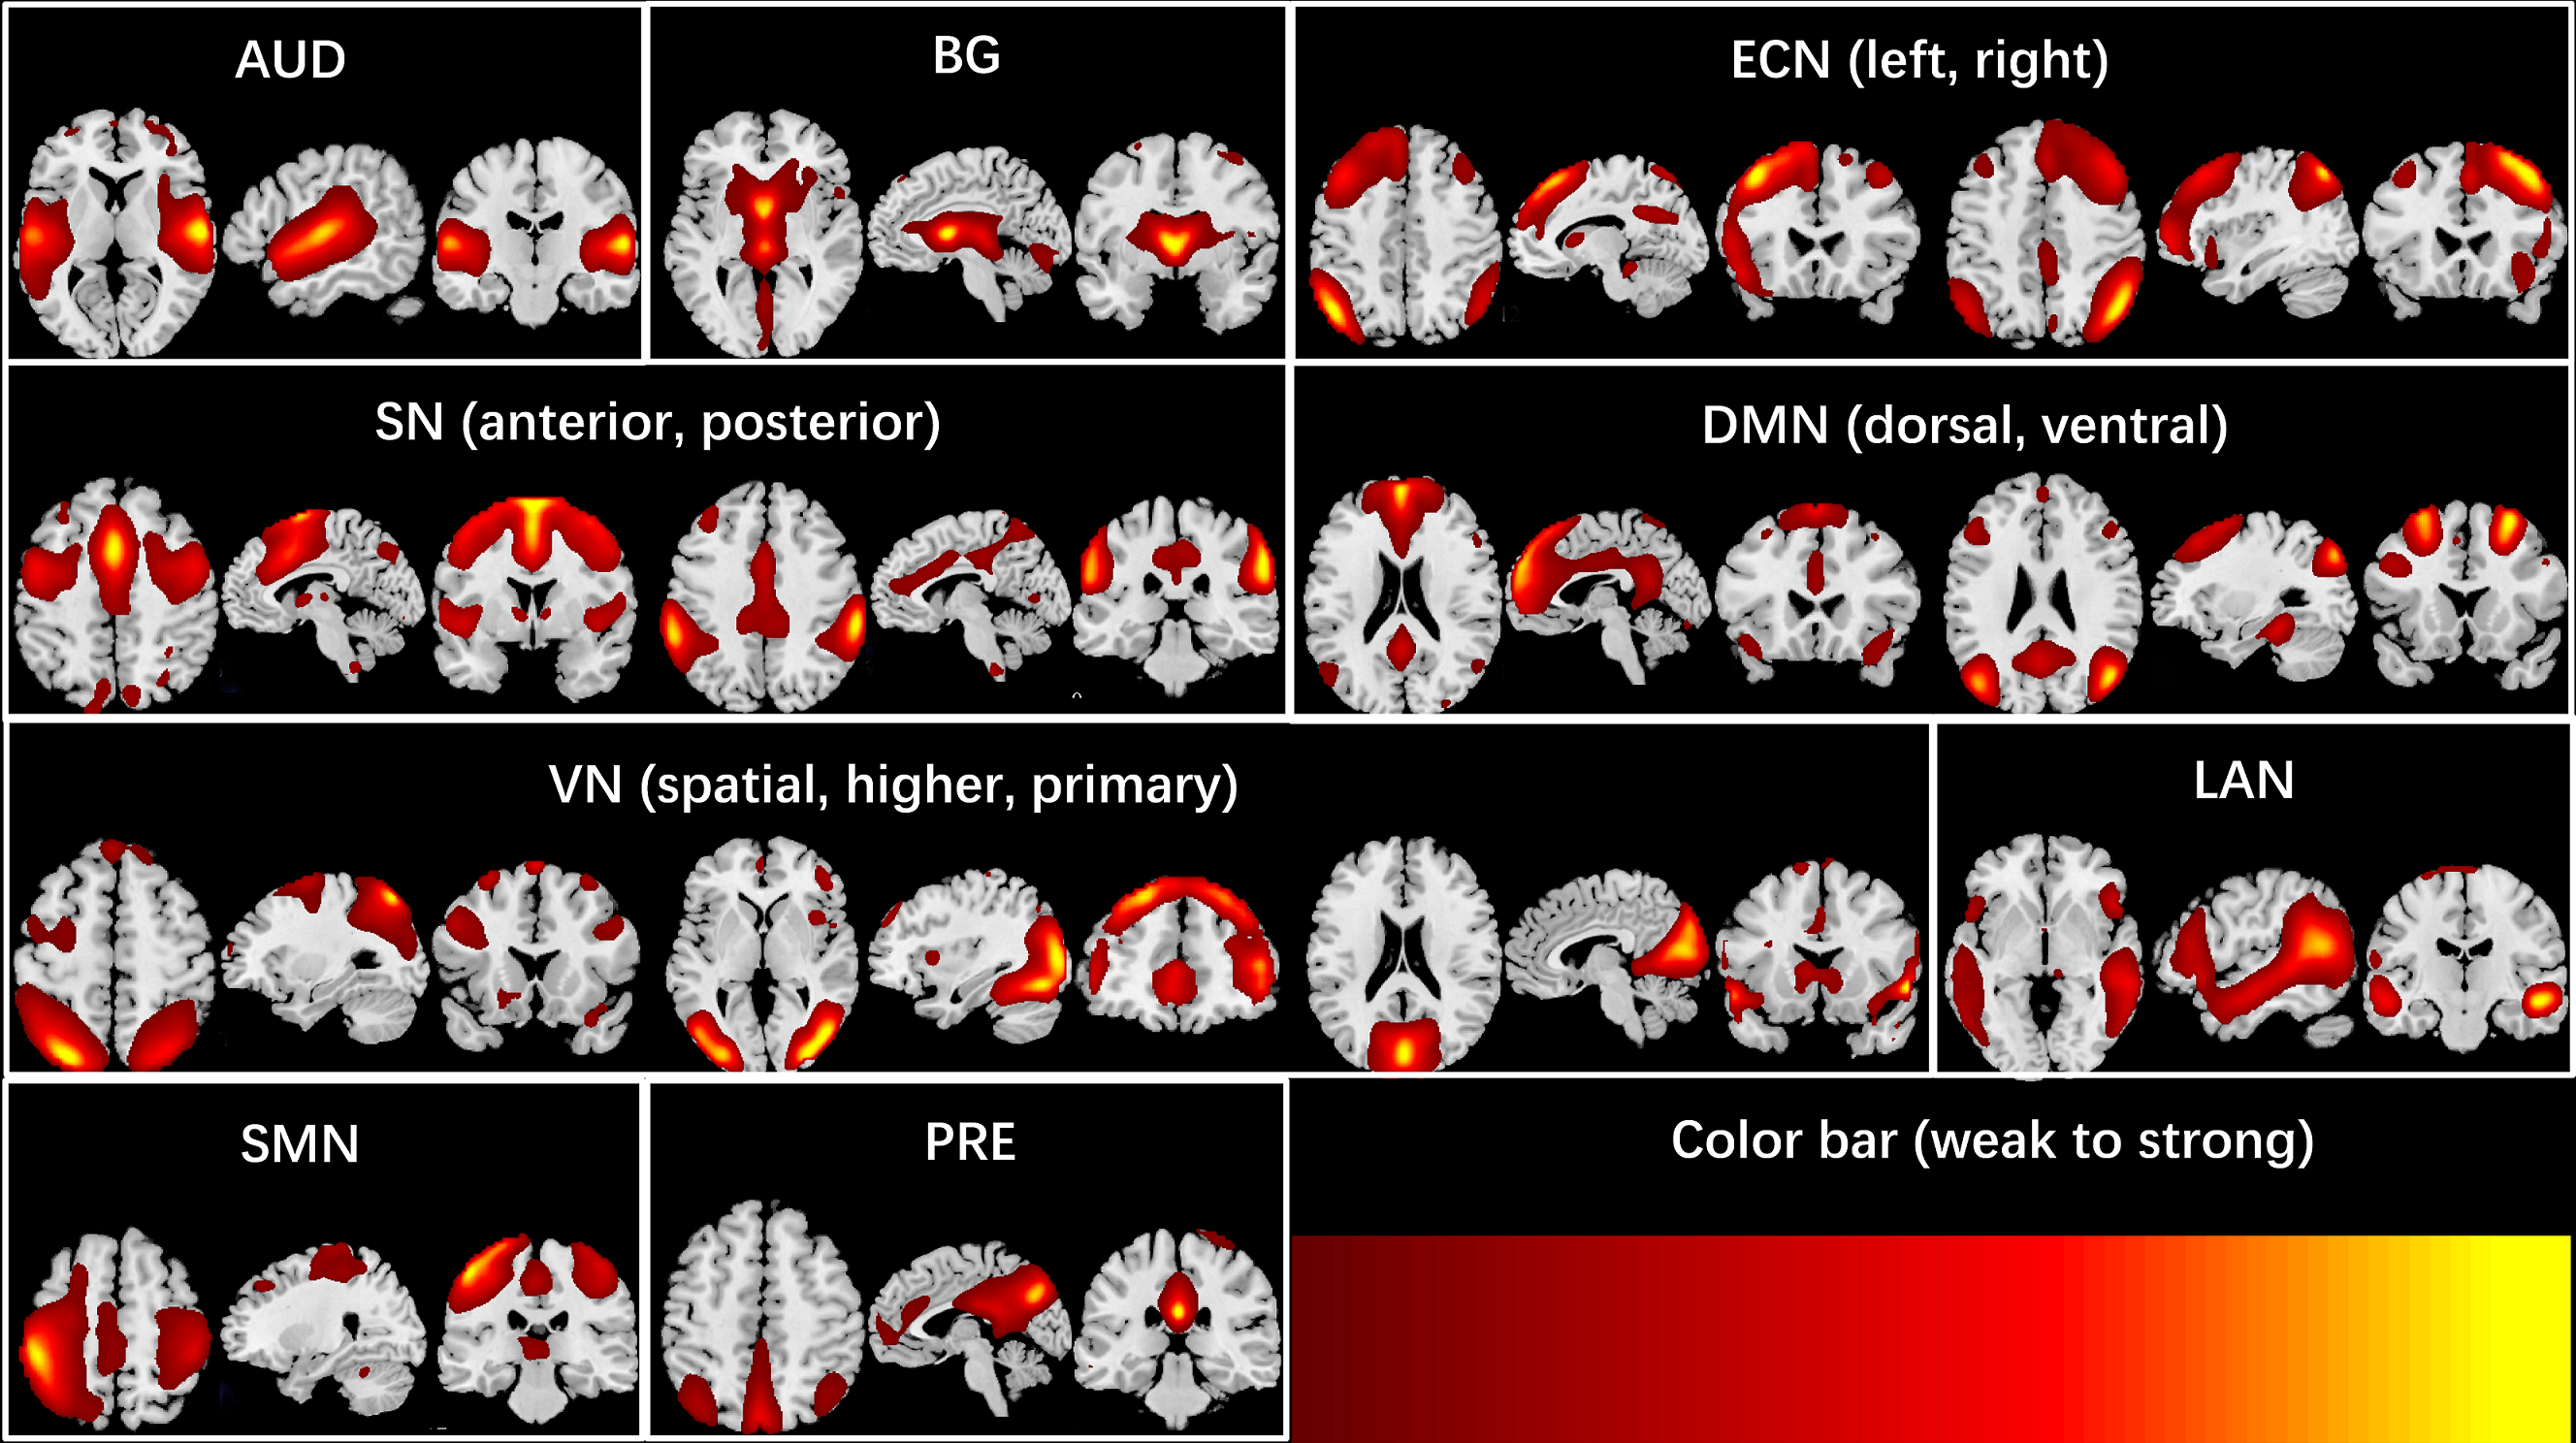
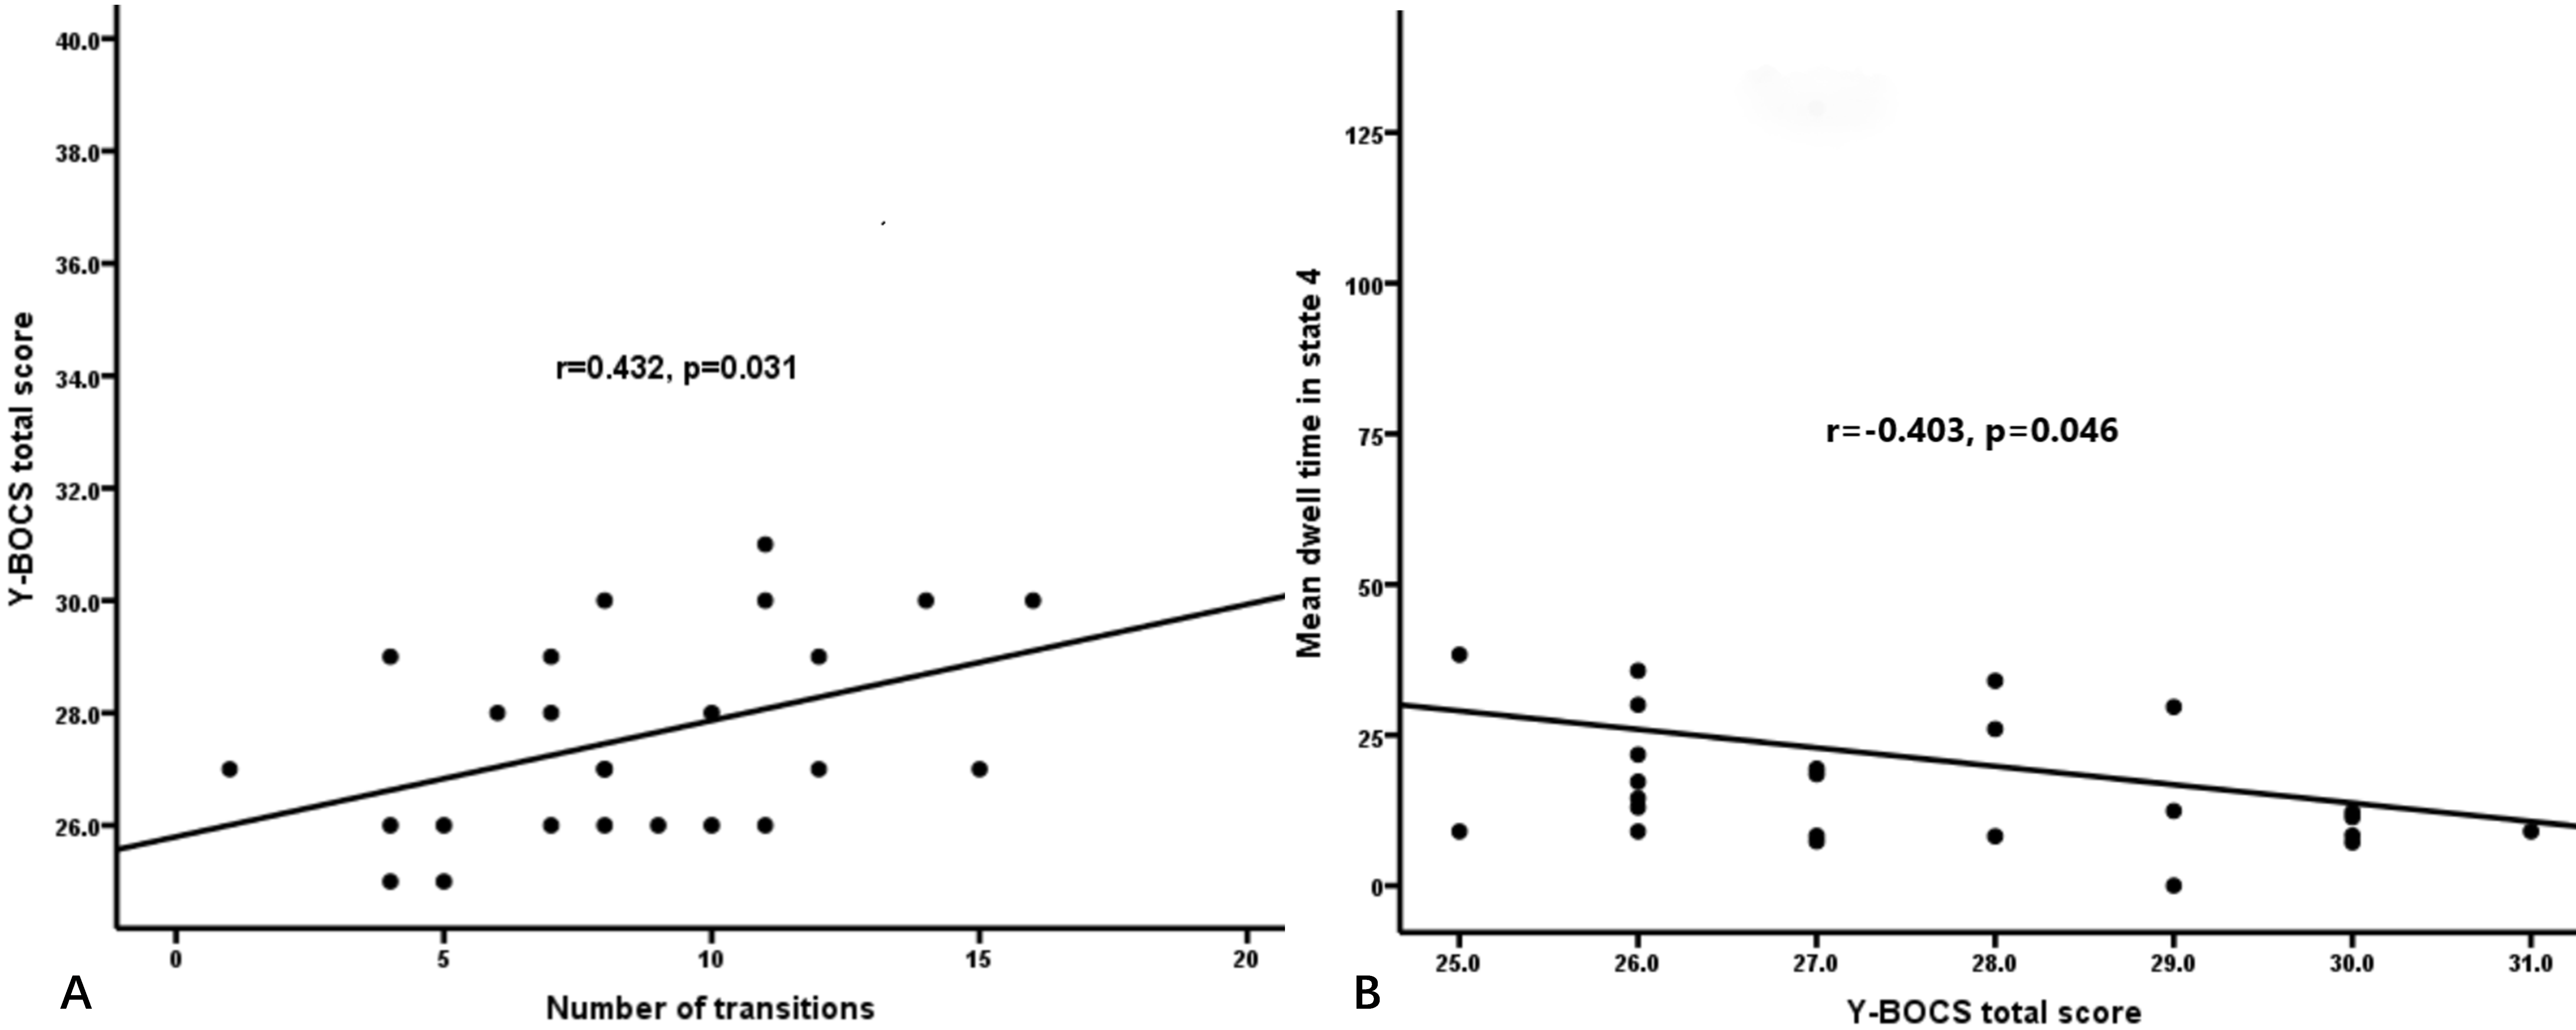
A total of 14 components were selected from 28 independent components, which were highly similar to the standard functional network template and located on the gray matter, less overlapping with ventricles and blood vessels. Relevant functional networks were the default mode network, salience network, auditory network, executive control network, visual network, language network, sensorimotor network, basal ganglia and precuneus (Figure 3). In the comparison of dynamic functional connectivity indicators, we found that there were significant differences in number of transitions among the four functional connectivity states, but no significant differences in fraction time and mean dwell time (Figure 4). Total Y-BOCS score was positively correlated with the number of transitions and negatively correlated with the mean dwell time in state 4 (Figure 5). In the validation analysis,when the size of the sliding window changed, there was still a significant difference in the number of transitions between OCD group and HC group.Discussion
The present study compared dFC between OCD group and HC group. Our results suggested that compared with HCs, OCD patients switched more times between different states. This may reflect that the functional network of OCD patients had lost its proper rhythm with time 8, showing the characteristics of instability 9. Our research provided new ideas and directions for exploring the neuropathological mechanism of OCD.Conclusion
The dynamic evolution of functional connection in patients with first-onset OCD has the characteristics of switching state frequently. The more transitions, the more severe the obsessive-compulsive symptoms.Acknowledgements
No acknowledgement found.References
1. Barttfeld P, Uhrig L, Sitt JD, et al. Signature of consciousness in the dynamics of resting-state brain activity. Proc Natl Acad Sci U S A. 2015;112(3):887-892.
2. Gonzalez-Castillo J, Hoy CW, Handwerker DA, et al. Tracking ongoing cognition in individuals using brief, whole-brain functional connectivity patterns. Proc Natl Acad Sci U S A. 2015:112(28):8762–8767.
3. Karahanoğlu FI, Van De Ville D. Transient brain activity disentangles fMRI resting-state dynamics in terms of spatially and temporally overlapping networks. Nat Commun. 2015;6:7751.
4. Tagliazucchi E, Laufs H. Decoding wakefulness levels from typical fMRI resting state data reveals reliable drifts between wakefulness and sleep. Neuron. 2014;82(3):695–708.
5. Chao-Gan Y, Yu-Feng Z. DPARSF: A MATLAB Toolbox for "Pipeline" Data Analysis of Resting-State fMRI. Front Syst Neurosci. 2010;4:13.
6. Li X, Zhu D, Jiang X, et al. Dynamic functional connectomics signatures for characterization and differentiation of PTSD patients. Human Brain Mapping. 2014;35(4):1761-1778.
7. Allen EA, Damaraju E, Plis SM, et al. Tracking whole-brain connectivity dynamics in the resting state. Cerebral Cortex. 2014;24(3):663–676.
8. Rabany L, Brocke S, Calhoun VD, et al. Dynamic functional connectivity in schizophrenia and autism spectrum disorder: Convergence, divergence and classification. Neuroimage Clin. 2019;24:101966.
9. Fiorenzato E, Strafella AP, Kim J, et al. Dynamic functional connectivity changes associated with dementia in Parkinson's disease. Brain. 2019;142(9):2860-2872.
Figures