1987
Disorder-specific alternations of intrinsic brain functional network dynamics in obsessive-compulsive disorder and schizophrenia1Huaxi MR Research Center (HMRRC), Functional and Molecular Imaging Key Laboratory of Sichuan Province, Department of Radiology, West China Hospital of Sichuan University, Chengdu, China, 2Psychoradiology Research Unit of Chinese Academy of Medical Sciences (2018RU011), West China Hospital of Sichuan University, Chengdu, China
Synopsis
Dynamic functional connectivity (dFC) analyses were used to compare the intrinsic brain functional network dynamics in patients with obsessive-compulsive disorder (OCD) and schizophrenia (SZ), by using resting-state functional MRI (rfMRI). We found that patients with OCD and SZ showed distinct disorder-specific alternations of brain dynamics and the higher fractional time in state 2 may indicate the more anxiety ratings in OCD patients.
Introduction
Though OCD and SZ have distinct typical symptoms, previous studies confirmed the partial polygenic overlap between OCD and SZ and comorbid OCD is diagnosed in 7.8%–26% of patients with SZ.1 However, few studies have explored the shared and disorder-specific brain function underlying the neural pathophysiology of the 2 disorders. Recent studies have shown that brain is a complex dynamic system and the dynamic properties of resting-state FC are changed in many neuropsychiatric disorders.2,3 The aim of the present study is to explore the abnormal characteristics of the dFC in OCD and SZ as well as the association between the dFC metrics and symptom severity.Methods
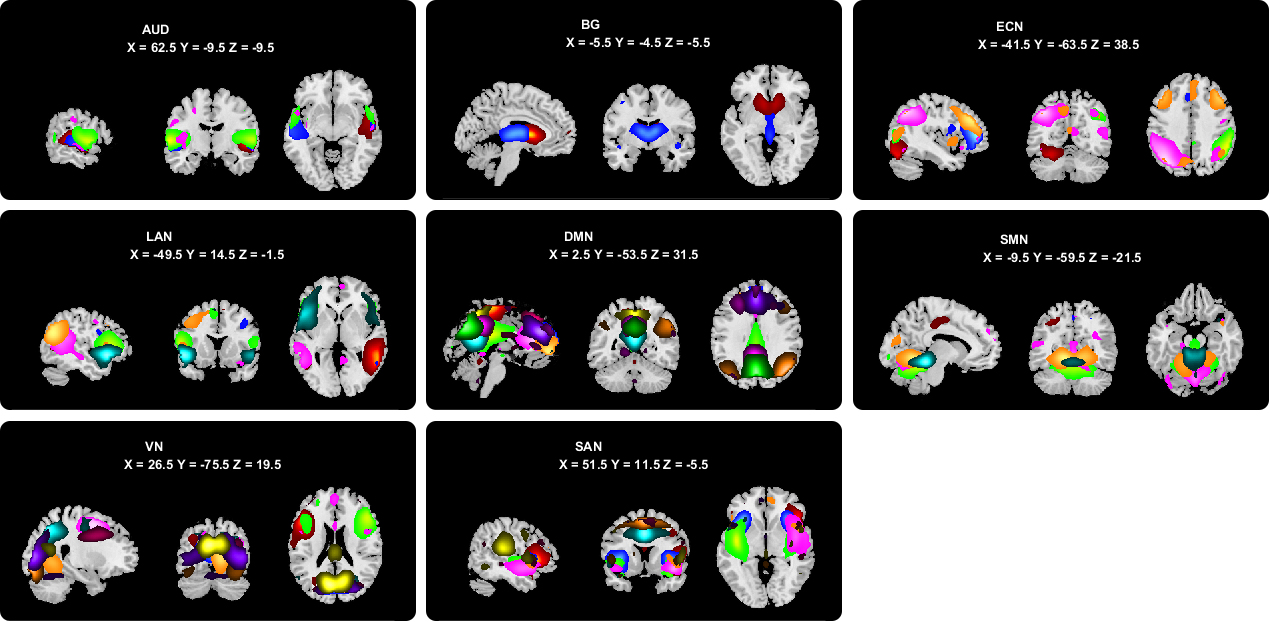
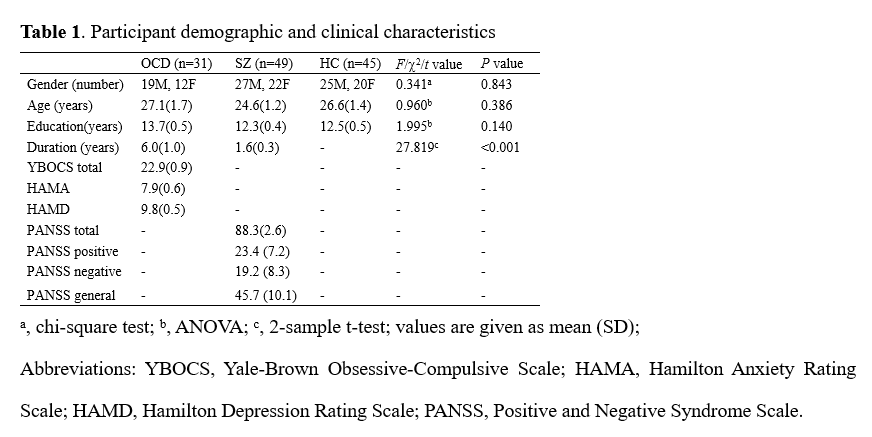
Thirty-one OCD patients, 49 SZ patients, and 45 healthy controls (HC) with matched age, sex, and education years participated in this study (Table 1). rfMRI were collected using a 3T GE scanner (TR/TE=2000ms/30ms, flip angle=90°, slice thickness=5mm with no gap, voxel size=3.75×3.75×5mm3). After data preprocessing, GIFT toolbox was used to conduct group independent component analysis and 55 independent components (ICs) were selected from 100 ICs and assigned to 8 intrinsic connectivity networks (Fig. 1). The sliding window approach was used to conduct the dFC analyses with a 22-TR window and slid in steps of 1 TR.4 To assess the reoccurring dFC states, k-means clustering was performed and the optimal number of states was determined to be 3 according to a cluster number validity analysis (gap statistic and silhouette). We calculated the modularity index Q and the mean FC within and between networks for each state. Then we assessed 3 different variables in the state transition vectors of subjects: fractional time, mean dwell time, and number of transitions. Kruskal-Wallis 1-way ANOVA and post-hoc tests were used to compare the group differences of the 3 vectors (non-normal distribution). We explored the correlation between the 3 vectors and clinical variables in patients controlling for age, sex, education. Significance was set at P<0.05 with false discovery rate (FDR) correction for all statistical analyses. We used the 30-TR window to repeat all the above steps for the reproducibility.Results
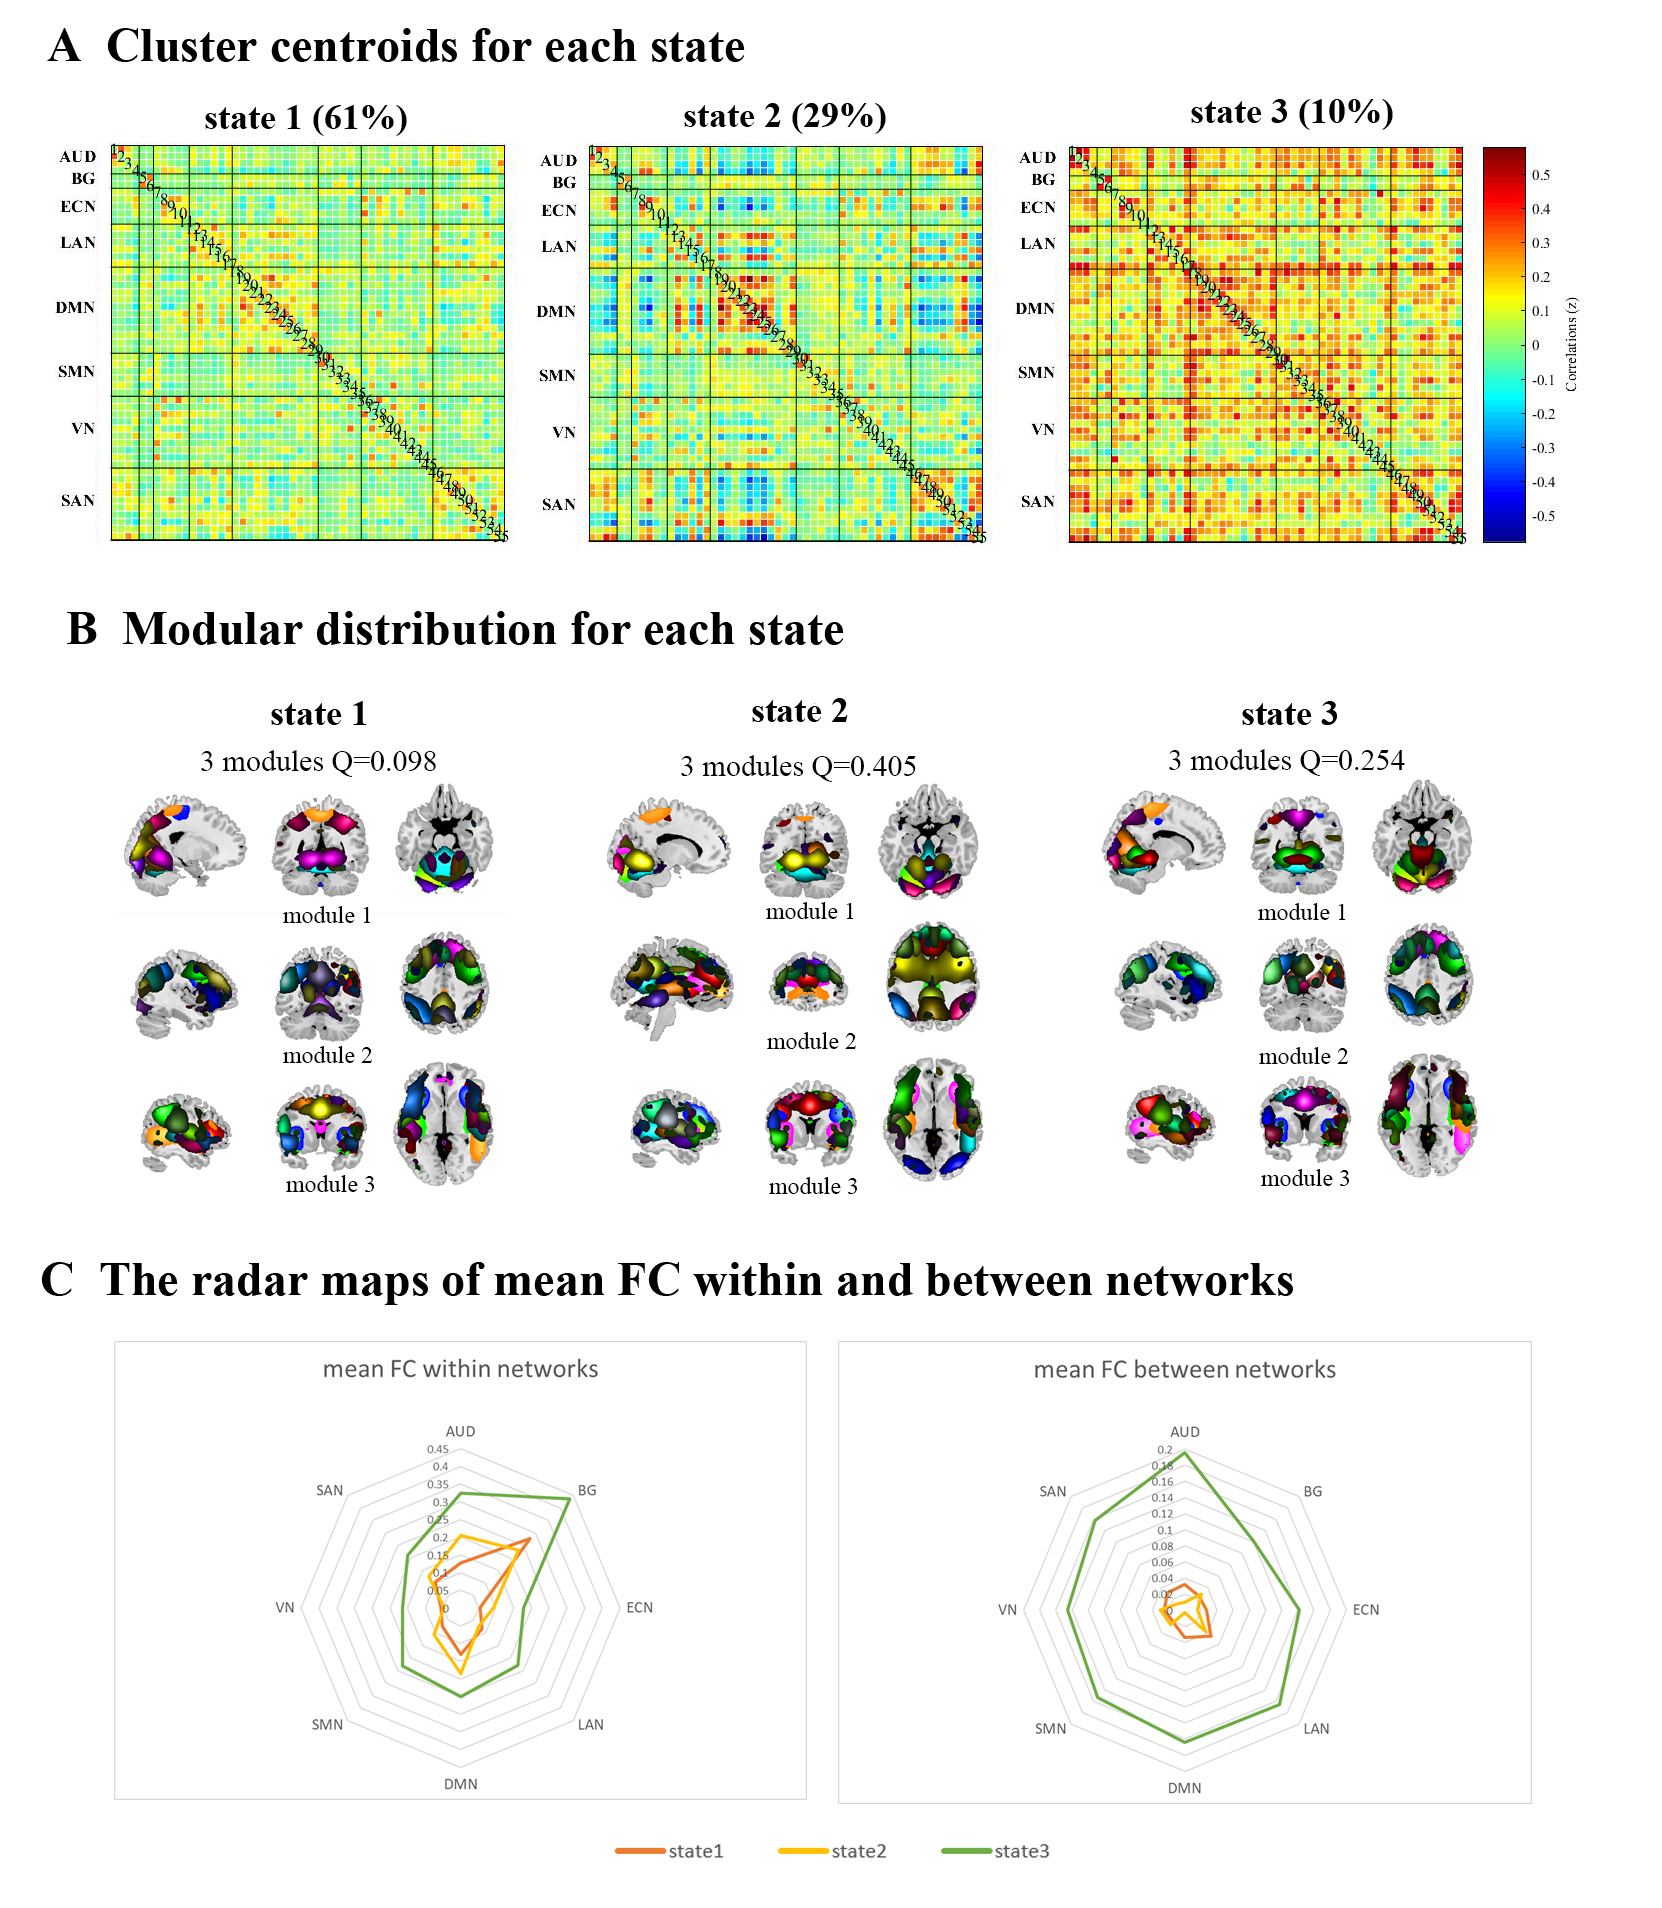
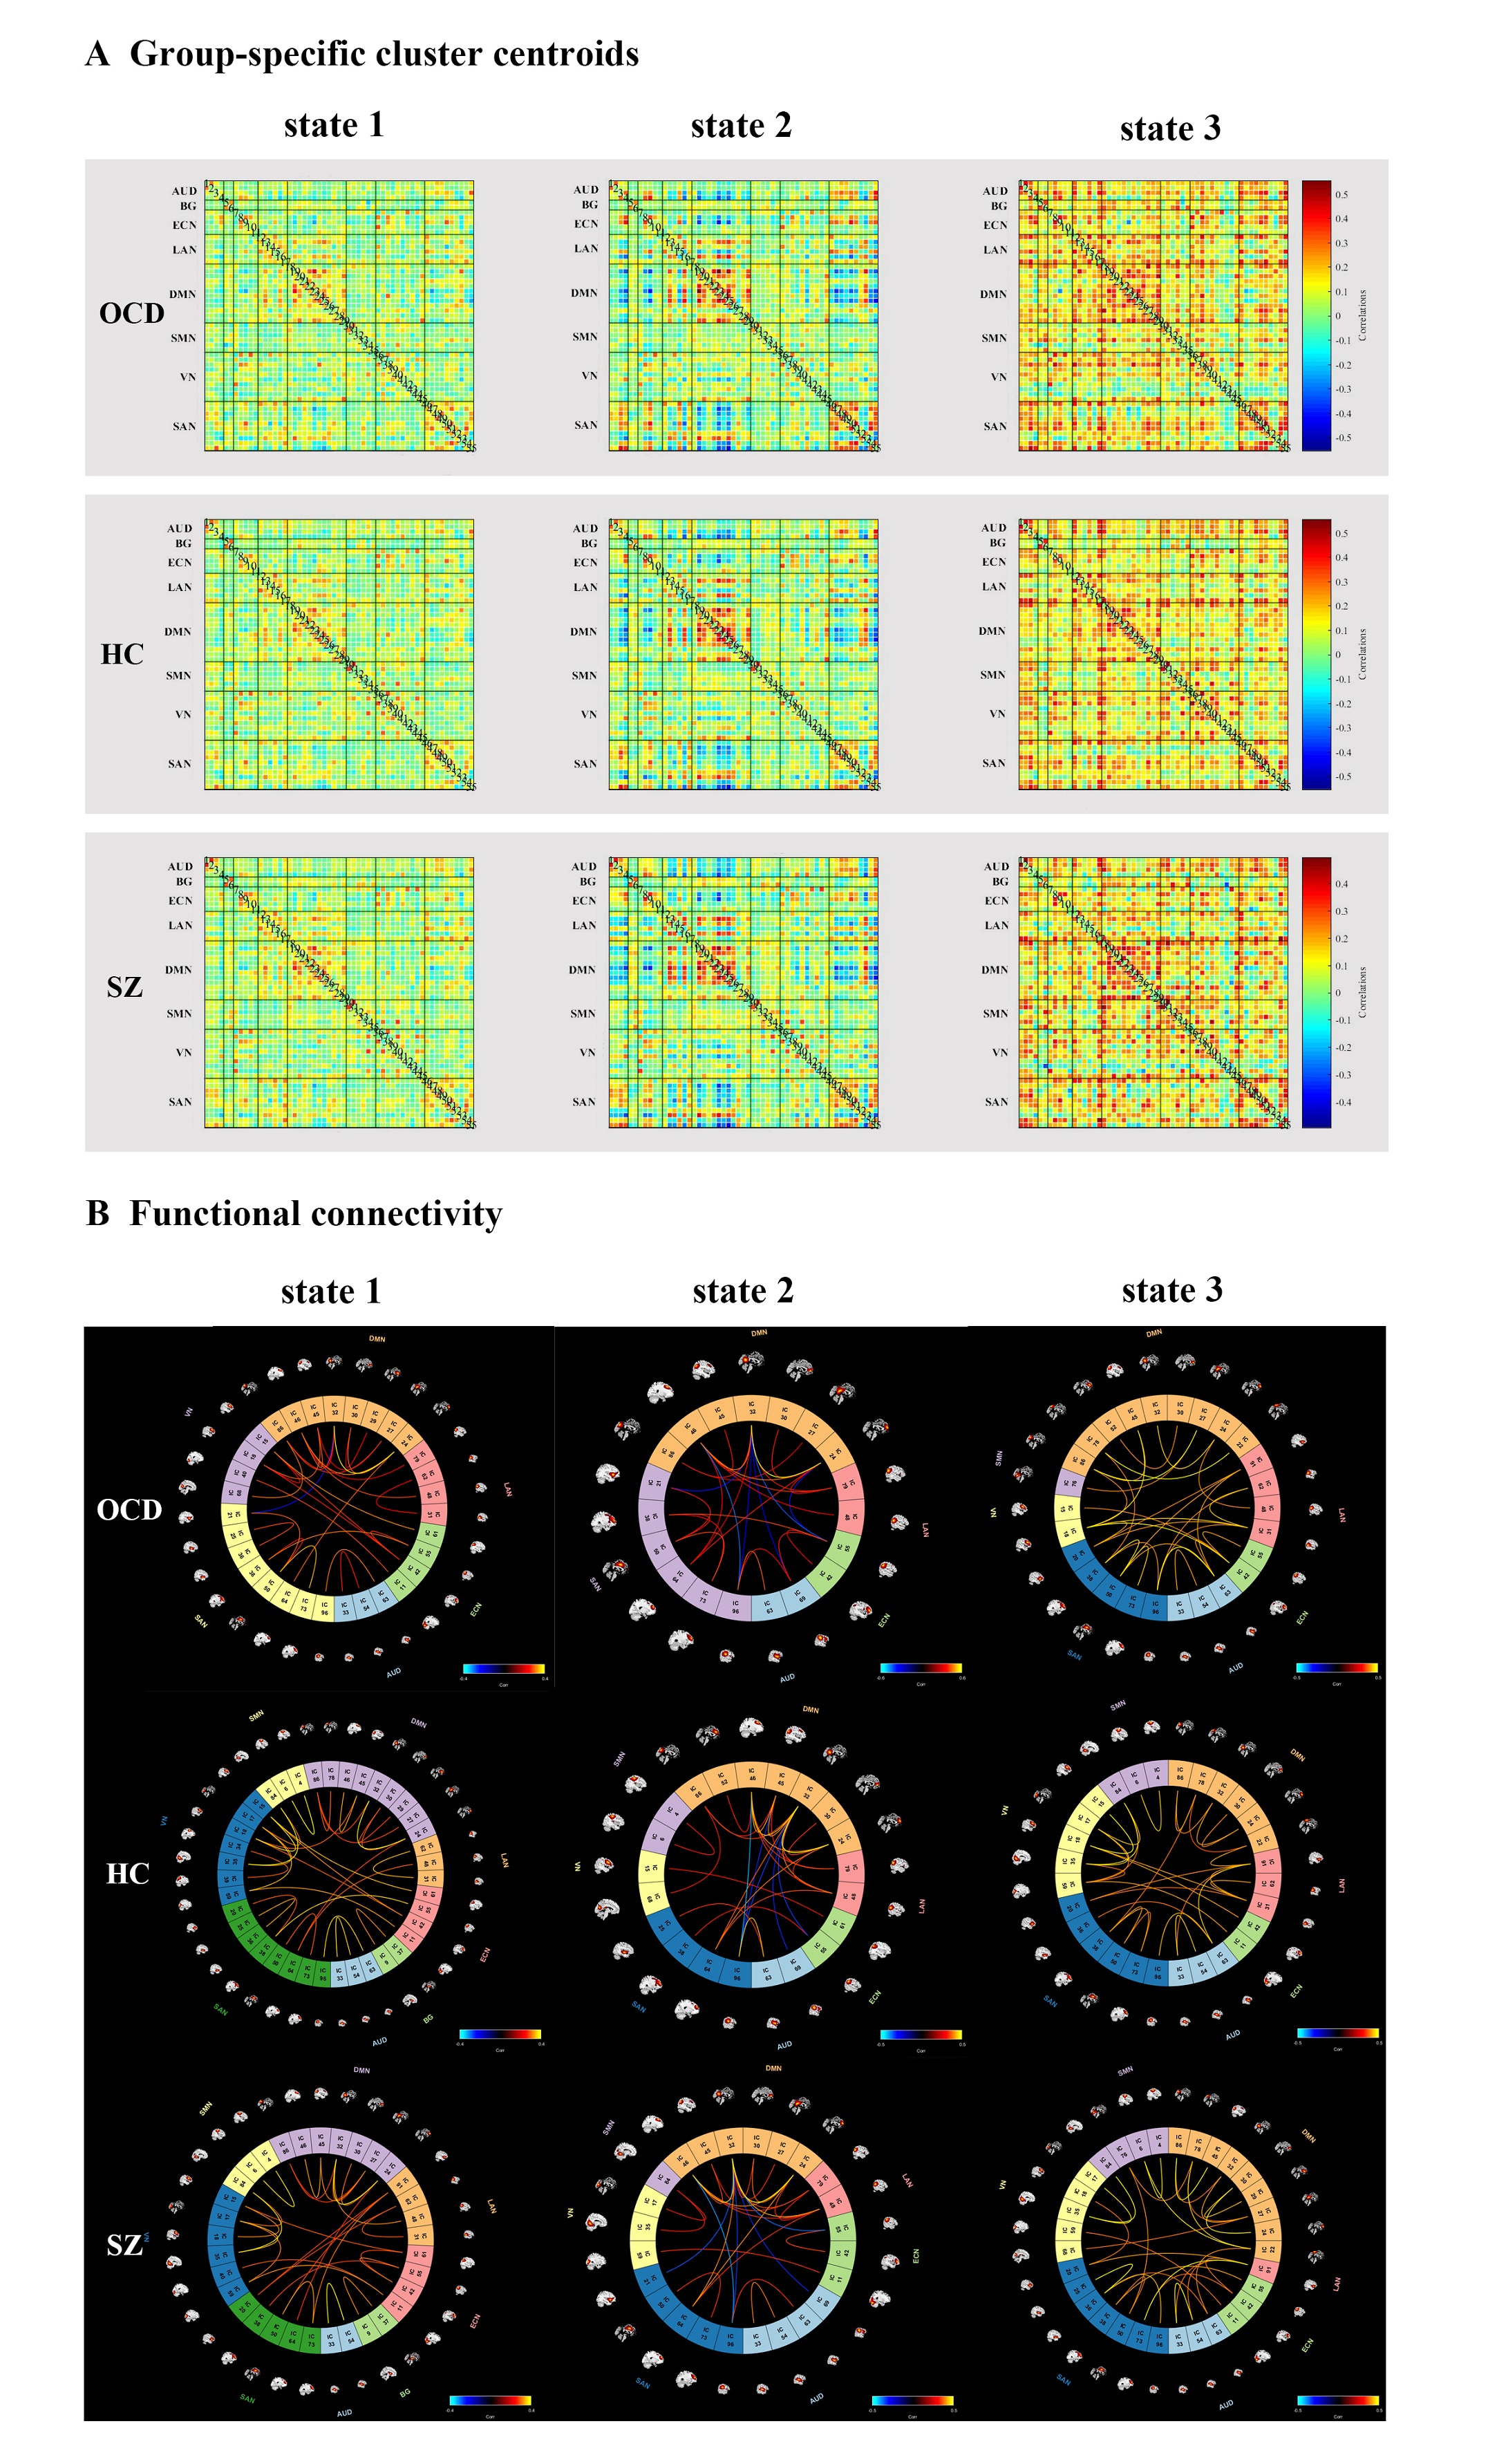
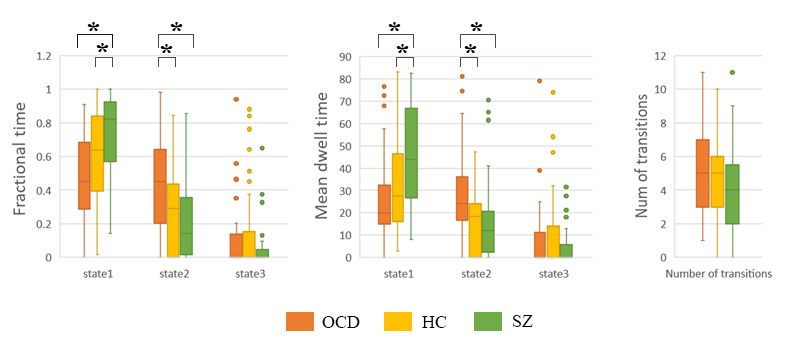
We found 3 dFC states: state 1 occurs most frequently (61%) with the lowest Q and shows weakest within-network FC and median between-networks FC; state 2 occurred in a moderate frequency (29%) with the highest Q and shows median FC within networks and weakest FC between networks due to the negative correlations between networks; state 3 occurs in a low frequency (10%) with a moderate Q and shows strongest FC within and between networks (Fig. 2). All 3 groups showed similar cluster centroids: in state 1, the top 2% FC located within networks with positive coupling, especially within DMN; in state 2, the FC mostly located between DMN and other networks, such as SAN, AUD, and ECN, with positive and negative coupling; in state 3, the FC mainly located both within and between networks with strongest positive coupling (Fig. 3).In state 1, patients with SZ showed both increased fractional time and mean dwell time than controls (P=0.047 and P=0.033) and OCD (P=0.001 and P=0.003). In state 2, patients with OCD showed both increased fractional time and mean dwell time than controls (P=0.032 and P=0.013) and SZ (P=0.005 and P=0.003) (Fig. 4). In OCD, the fractional time of state 2 was positively correlated with HAMA scores (r=0.535, P=0.021, FDR corrected). Validation analysis showed most of the main results were repeatable.
Discussion
Patients with OCD spent more time in state 2 at the expense of less time in state 1 compared with controls and SZ. With the highest modularity, state 2 was characterized by that the brain was more likely to aggregate into different functional modules consistent with our findings that the strongest connections of state 2 were mainly between DMN and other networks. A previous study using the static FC approach has also found that DMN showed hyper-connectivity in OCD.5 These findings suggest that the long duration in a state with extensive interaction between networks may be the characteristic alterations of brain dFC in OCD. The positive correlation between the increased fractional time of state 2 and HAMA scores in OCD suggested that the longer duration in state 2 may serve as a potential pathophysiological feature in OCD.Opposite to OCD, patients with SZ spent more time in state 1 compared with controls and OCD. State 1 had the lowest Q tending to integrate the brain into a generally connected and inseparable whole in line with the FC located mainly within DMN in state 1, the strength of which was lower than that in states 2 and 3. Previous studies have also found that patients with SZ spent more time in a state with diminished connections within DMN and tended to remain in a weak connected state.6,7 These findings may indicate that the long duration in a pervasive and weakly connected state may be the neurophysiology bases of SZ.
Conclusion
In conclusion, we investigated the abnormalities of brain functional dynamics in patients with OCD and SZ to unravel the neurobiological underpinnings of the 2 disorders and provided important novel insights into the disorder-specific altered dFC metrics underlying OCD and SZ.Acknowledgements
This study was supported by the Sichuan Science and Technology Program (2019YJ0098), Science and Technology Project of the Health Planning Committee of Sichuan (18ZD035), Technology Foundation for the Selected Returned Overseas Chinese Scholars (Sichuan Provincial Human Resources and Social Security Department, [2018]145-19), and Fundamental Research Funds for the Central Universities (2018SCUH0011).References
1. Meier S M, Petersen L, Pedersen M G, et al. Obsessive-compulsive disorder as a risk factor for schizophrenia: a nationwide study. JAMA psychiatry, 2014, 71(11): 1215-1221.
2. Kim J, Criaud M, Cho S S, et al. Abnormal intrinsic brain functional network dynamics in Parkinson’s disease. Brain, 2017, 140(11): 2955-2967.
3. Fu Z, Tu Y, Di X, et al. Characterizing dynamic amplitude of low-frequency fluctuation and its relationship with dynamic functional connectivity: an application to schizophrenia. Neuroimage, 2018, 180: 619-631.
4. Allen E A, Damaraju E, Plis S M, et al. Tracking whole-brain connectivity dynamics in the resting state. Cerebral cortex, 2014, 24(3): 663-676.
5. Fan J, Zhong M, Gan J, et al. Altered connectivity within and between the default mode, central executive, and salience networks in obsessive-compulsive disorder. Journal of affective disorders, 2017, 223: 106-114.
6. Rabany L, Brocke S, Calhoun V D, et al. Dynamic functional connectivity in schizophrenia and autism spectrum disorder: Convergence, divergence and classification. NeuroImage: Clinical, 2019, 24: 101966.
7. Du Y, Pearlson G D, Yu Q, et al. Interaction among subsystems within default mode network diminished in schizophrenia patients: a dynamic connectivity approach. Schizophrenia research, 2016, 170(1): 55-65.
Figures