1986
Disrupted Resting-State Functional Connectivity of Amygdala Subregions in Obsessive-Compulsive Disorder1Huaxi MR Research Center (HMRRC), Functional and molecular imaging Key Laboratory of Sichuan Province, Department of Radiology, West China Hospital, Sichuan University, Chengdu, China
Synopsis
Using seed based FC analysis, we investigated alterations in functional connectivity of amygdala subregions in OCD. Our findings (ⅰ) indicated OCD patients, relative to HC, have anomalous amygdala resting state network connections to brain regions that play a pivotal role in emotional processing; (ⅱ) identified CM/Astr-PCG hyperconnectivity and CM-cuneus hyperconnectivity, which were not detected when using the whole amygdala as a seed; (ⅲ) demonstrated FC measures of significant regions were correlated with illness duration and symptom severity. Besides, we found that functional aberrations were accompanied with anatomical changes in OCD. These findings may contribute to revealing the pathophysiology underlying OCD.
Introduction
While the prevailing pathophysiologic model of obsessive-compulsive disorder (OCD) have put emphasis on a disrupted cortico-striato-thalamo-cortical circuit (CSTC), accumulating evidence have indicated that the limbic regions, in particularly amygdala, may contribute to the pathophysiology of this disorder 1. The amygdala encompasses four main subregions, each of which contribute to distinct affective functions via their unique connectivity profiles2, 3. Little is known about whether there are alterations of amygdala subregional networks in patients with OCD. We address this gap by examining the differences in the resting-state functional connectivity (rsFC) of amygdala subregions in OCD patients versus healthy controls (HC). Additionally, we also examined the volumetric alterations in the whole amygdala to determine whether the functional aberrations were accompanied with anatomical changes.Materials & Methods
A total of 88 DSM-IV criteria diagnosed OCD patients and 88 sex- and age- matched HC participated in this study after giving written, informed consent. The Yale-Brown Obsessive-Compulsive Scale (Y-BOCS) was used to rate the severity of OCD symptoms, whereas the 14-item Hamilton Anxiety Scale (HAMA) and 17-item Hamilton Depression Scale (HAMD) were used to rate anxiety and depression symptoms, respectively. All participants were scanned using 3-Telsa GE magnetic resonance imaging (MRI) system with an 8-channel phase-array head coil to acquire resting-state functional MRI data and high-resolution structural MRI data.The preprocessing of resting-state functional images was performed using DPABI software (http://www.restfmri.net). Four distinct regions of the amygdala, including the basolateral (LB), centromedial (CM), amygdalostriatal transition area (AStr), and superficial (SF) amygdala, were created using cytoarchitectonically defined probabilistic maps of the amygdala.
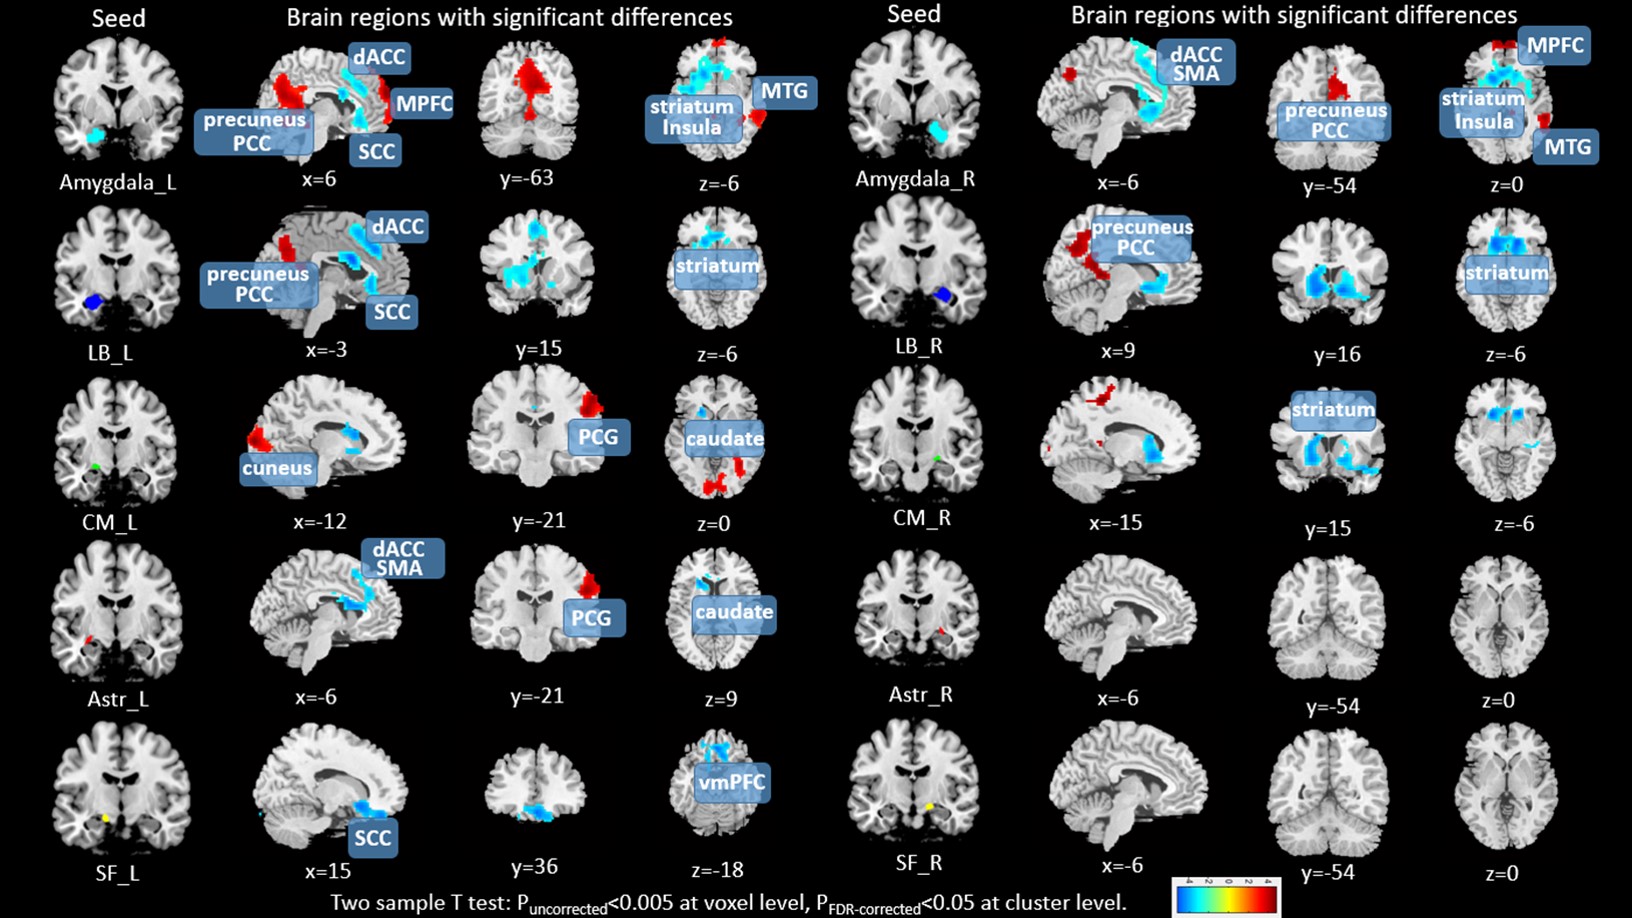
A 2 group (OCD and HC) ×2 hemisphere (left and right) ×4 subregion (LB, CM, Astr, SF) full factorial analyses of variance was performed. In order to comprehensively understand the functional brain networks of amygdala at a subregional level in OCD, we conducted a seed based FC analysis to compare rsFC of the whole amygdala and its four subregions between groups.The significance threshold was set to p<0.005 at the voxel level, and FDR correction at the cluster level to p<0.05. Regression analyses were carried out to investigate the association of amygdala rsFC abnormalities with symptom severity and illness duration.
Finally, the structural MRI data was automatically segmented using FreeSurfer software (http://surfer.nmr.mgh.harvard.edu/) and a multivariate analysis of covariance (MANCOVA) with age, gender and ICV as covariates was used to test for overall amygdala volume differences between groups. Correlations between rsFC and amygdala Volume were also examined within OCD group.
Results
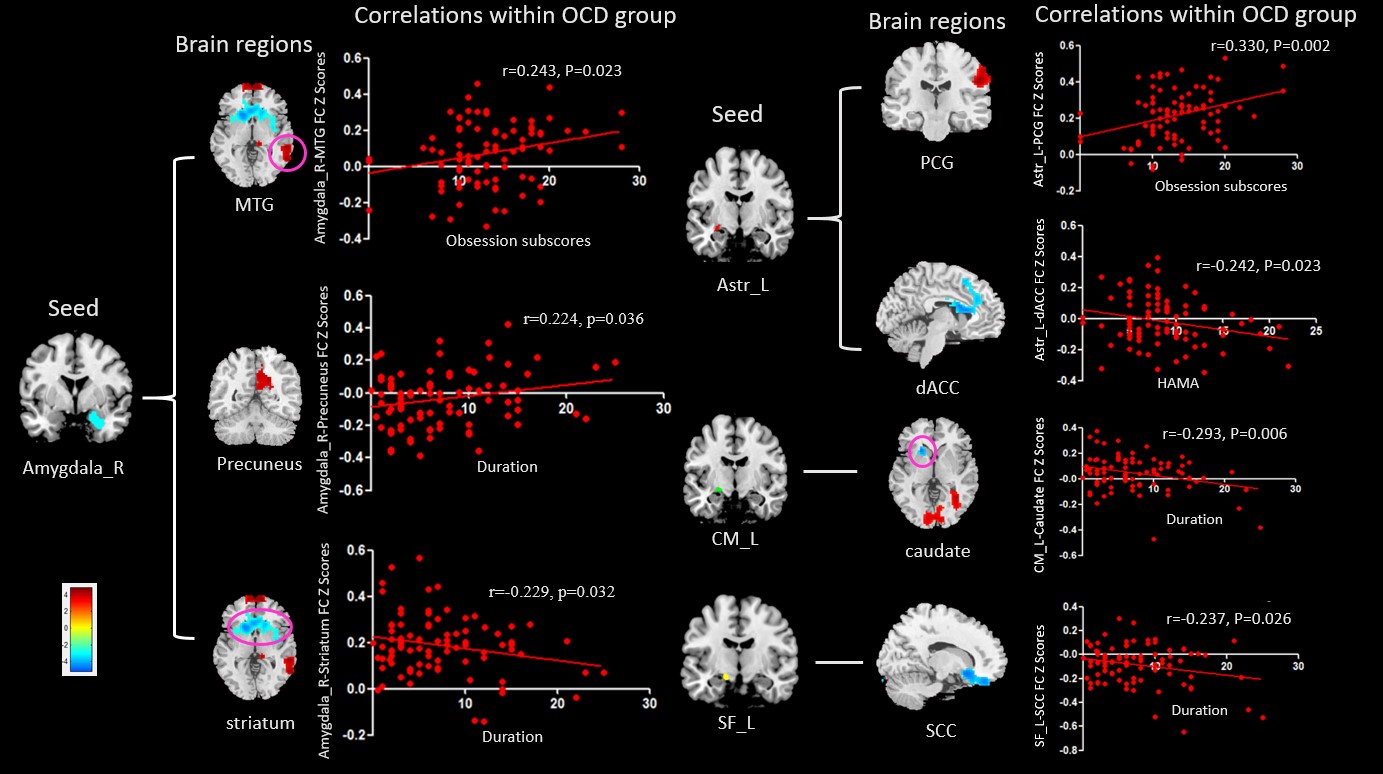
The demographic information and clinical characteristics of the subjects are shown in Table 1.Full factorial analyses of variance revealed significant interactions between group and subregions in several brain regions including precuneus, thalamus, insula, postcentral gyrus (PCG), middle temporal gyrus (MTG) and cuneus. Relative to HC, OCD patients exhibited increased rsFC in Amygdala with medial prefrontal cortex (MPFC), in Amygdala and LB with precuneus extend to the posterior cingulate cortex (PCC), in Amygdala with MTG, in left CM and Astr with PCG, and in CM with cuneus. Decreased rsFC was observed in Amygdala, LB, CM and left Astr with caudate/striatum, in Amygdala, left LB, Astr and SF with dorsal anterior cingulate cortex (dACC)/ subcallosal cingulate cortex (SCC), and in left SF with ventromedial prefrontal cortex (vmPFC) (Table 2 & Figure 1). Interestingly, these amygdala rsFC abnormalities were correlated with illness duration and symptom severity as measured by YBOC and HAMA scores within the OCD group (see Figure 2 for more details).
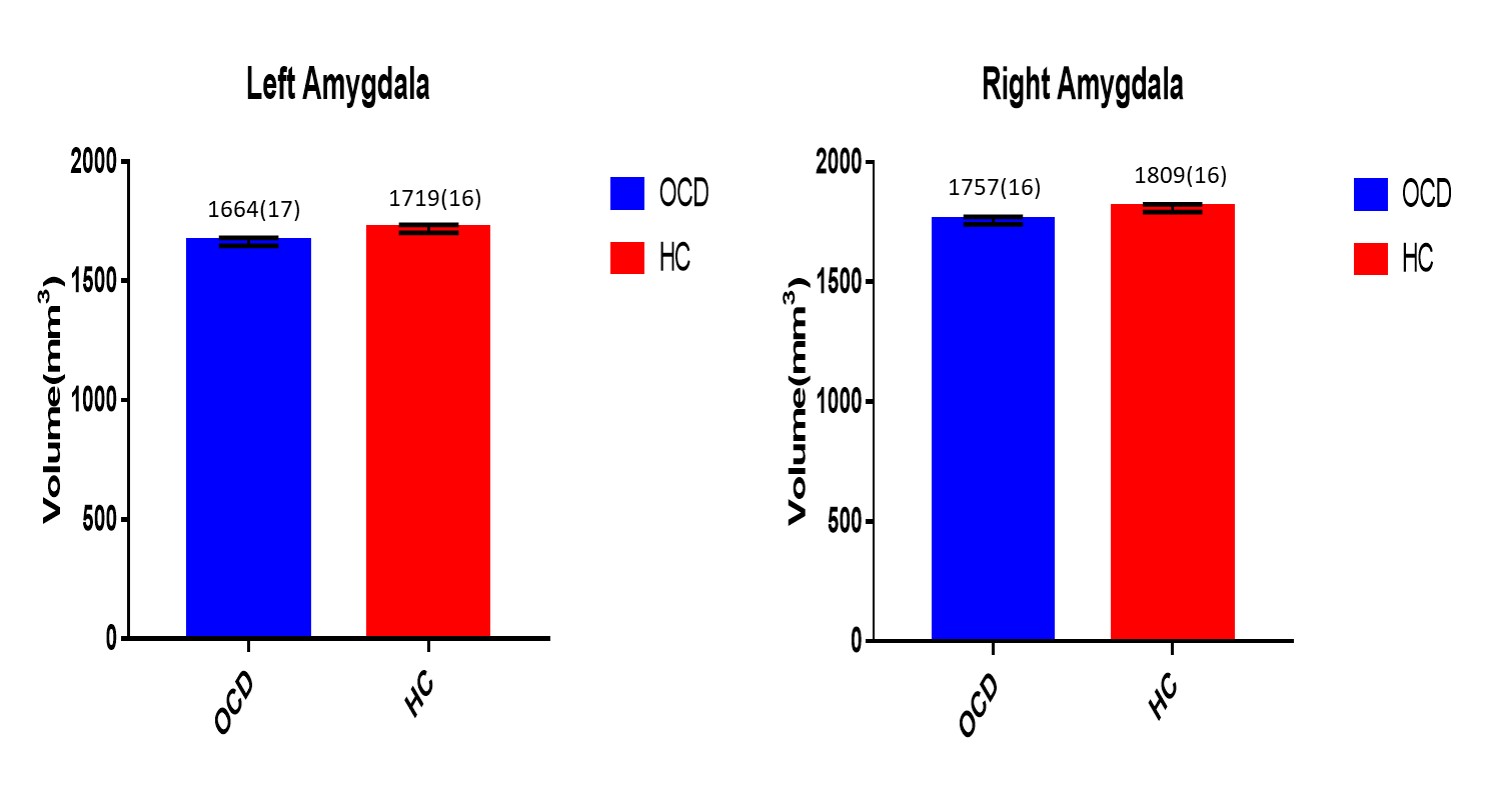
In addition, the structural imaging analyses identified that volume of the whole amygdala was significantly reduced bilaterally in patients with OCD (left, p=0.018; right, p=0.023) (Figure 3). And there was no significant correlation between the rsFC of the amygdala or any of its subregions and amygdala volume.
Discussion & Conclusion
The current study suggested that analyses at the subregional level revealed additional regions of disrupted connectivity comparing analyses using the whole amygdala as a seed. Hyperconnectivity in CM and Astr with PCG, which were not detected when using the whole amygdala as a seed, may be associated with the heighted cognitive arousal (e.g., intrusive thoughts) as demonstrated by the association it has with obsession subscores. Cuneus is a portion of the occipital lobe, involved in visual processing, and hyperconnectivity in CM with cuneus may reflect increased visual attention towards irrelevant detail and an excessive need for symmetry which characterizes the ordering symptom of OCD 4. More importantly, for the patients with OCD, greater changes in functional connectivity of right amygdala with precuneus and striatum, left CM with caudate, and left SF with SCC were correlated with longer illness duration, pointed to a connectivity-based pathophysiologic process in OCD. Beyond that, we found that the functional aberrations of amygdala were accompanied with amygdala volumetric changes.Acknowledgements
This study was supported by National Nature Science Foundation (Grant NO. 81671669), Science and Technology Project of Sichuan Province (Grant NO. 2017JQ0001)References
1. Milad, M.R. and S.L. Rauch, Obsessive-compulsive disorder: beyond segregated cortico-striatal pathways. Trends Cogn Sci, 2012. 16(1): p. 43-51.
2. Etkin, A., et al., Disrupted amygdalar subregion functional connectivity and evidence of a compensatory network in generalized anxiety disorder. Arch Gen Psychiatry, 2009. 66(12): p. 1361-72.
3. Qin, S., et al., Immature integration and segregation of emotion-related brain circuitry in young children. Proc Natl Acad Sci U S A, 2012. 109(20): p. 7941-6.
4. Hashimoto, N., et al., Distinct neuropsychological profiles of three major symptom dimensions in obsessive-compulsive disorder. Psychiatry Res, 2011. 187(1-2): p. 166-73.
Figures
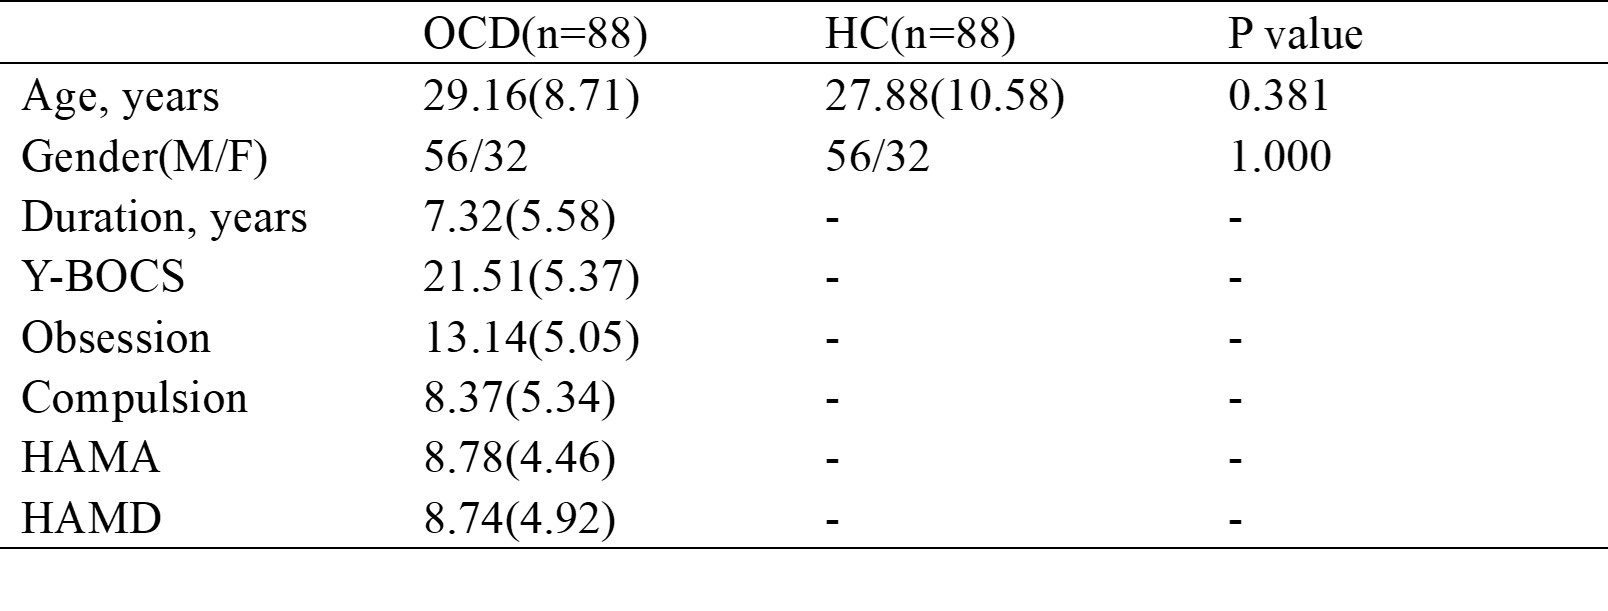
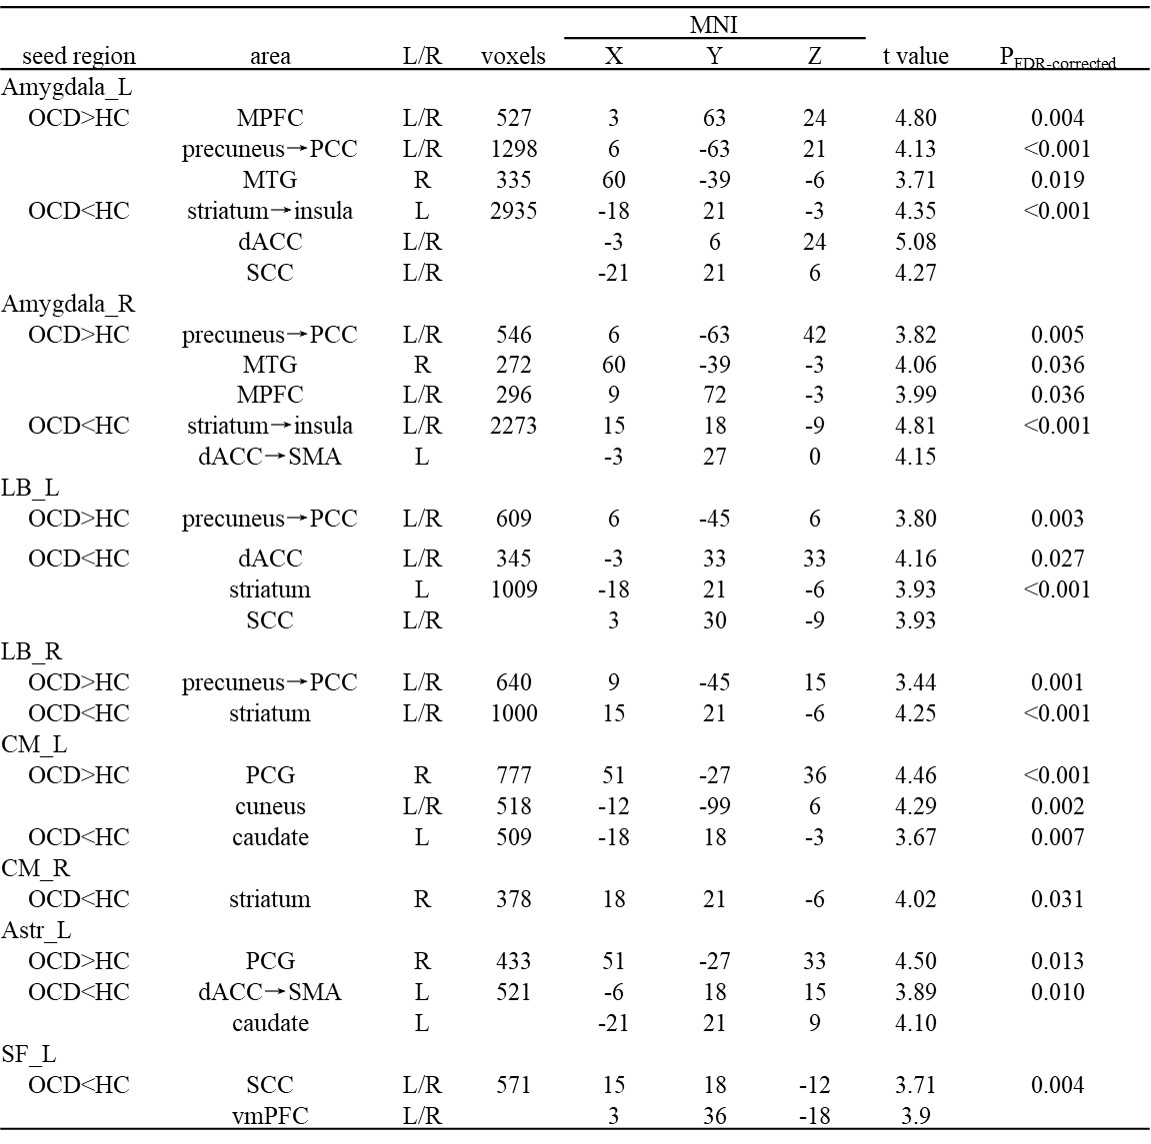
Table 2 Brain regions with significant differences in rsFC between patients with obsessive-compulsive disorder(OCD) and healthy controls(HC). MNI, Montreal Neurological Institute.