1985
Identifying the brain network underlying symptom improvement following neuromodulation in Obsessive Compulsive Disorder.1University Health Network, Toronto, ON, Canada, 2Sunnybrook Health Sciences Centre, Toronto, ON, Canada, 3Department of Psychiatry, Yonsei University College of Medicine, Seoul, Republic of Korea, 4Department of Neurosurgery, Yonsei University College of Medicine, Seoul, Republic of Korea
Synopsis
Neuromodulatory interventions have shown promise in the treatment of Obsessive-Compulsive Disorder (OCD). However, the nature of the aberrants circuits that cause the disease as well as the network changes that are the basis of improvement following treatment are not well understood. Here we analyzed OCD patients treated with either MRI-guided focused ultrasound capsulotomy or deep brain stimulation targeting the inferior thalamic peduncle. Using neuroimaging analysis and modeling techniques we found that a fronto-limbic network (DLPFC, dorsal ACC, and amygdala) predicts individual improvement across groups. These results provide new insight into OCD and how to possibly refine neuromodulatory therapies.
INTRODUCTION
Obsessive-Compulsive Disorder (OCD) is a debilitating psychiatric disorder characterized by intrusive thoughts and repetitive behaviors. The core features of the disease are believed to arise from aberrant processing within fronto-striatal [1]–[4] and fronto-limbic [2], [5], [6] networks. The exact role and involvement of these networks in the pathophysiology of OCD is still subject to debate [1]. We report a systematic mapping of two different functional neurosurgical interventions across two neuroanatomical targets: lesioning of the anterior limb of the internal capsule (ALIC) using MRgFUS and electrical stimulation of the inferior thalamic peduncle (ITP) using DBS. Imaging analysis across these two modalities provides a unique opportunity to scrutinize the neuronal systems underlying OCD pathophysiology and help identify the key circuits to modulate for symptom alleviation.METHODS
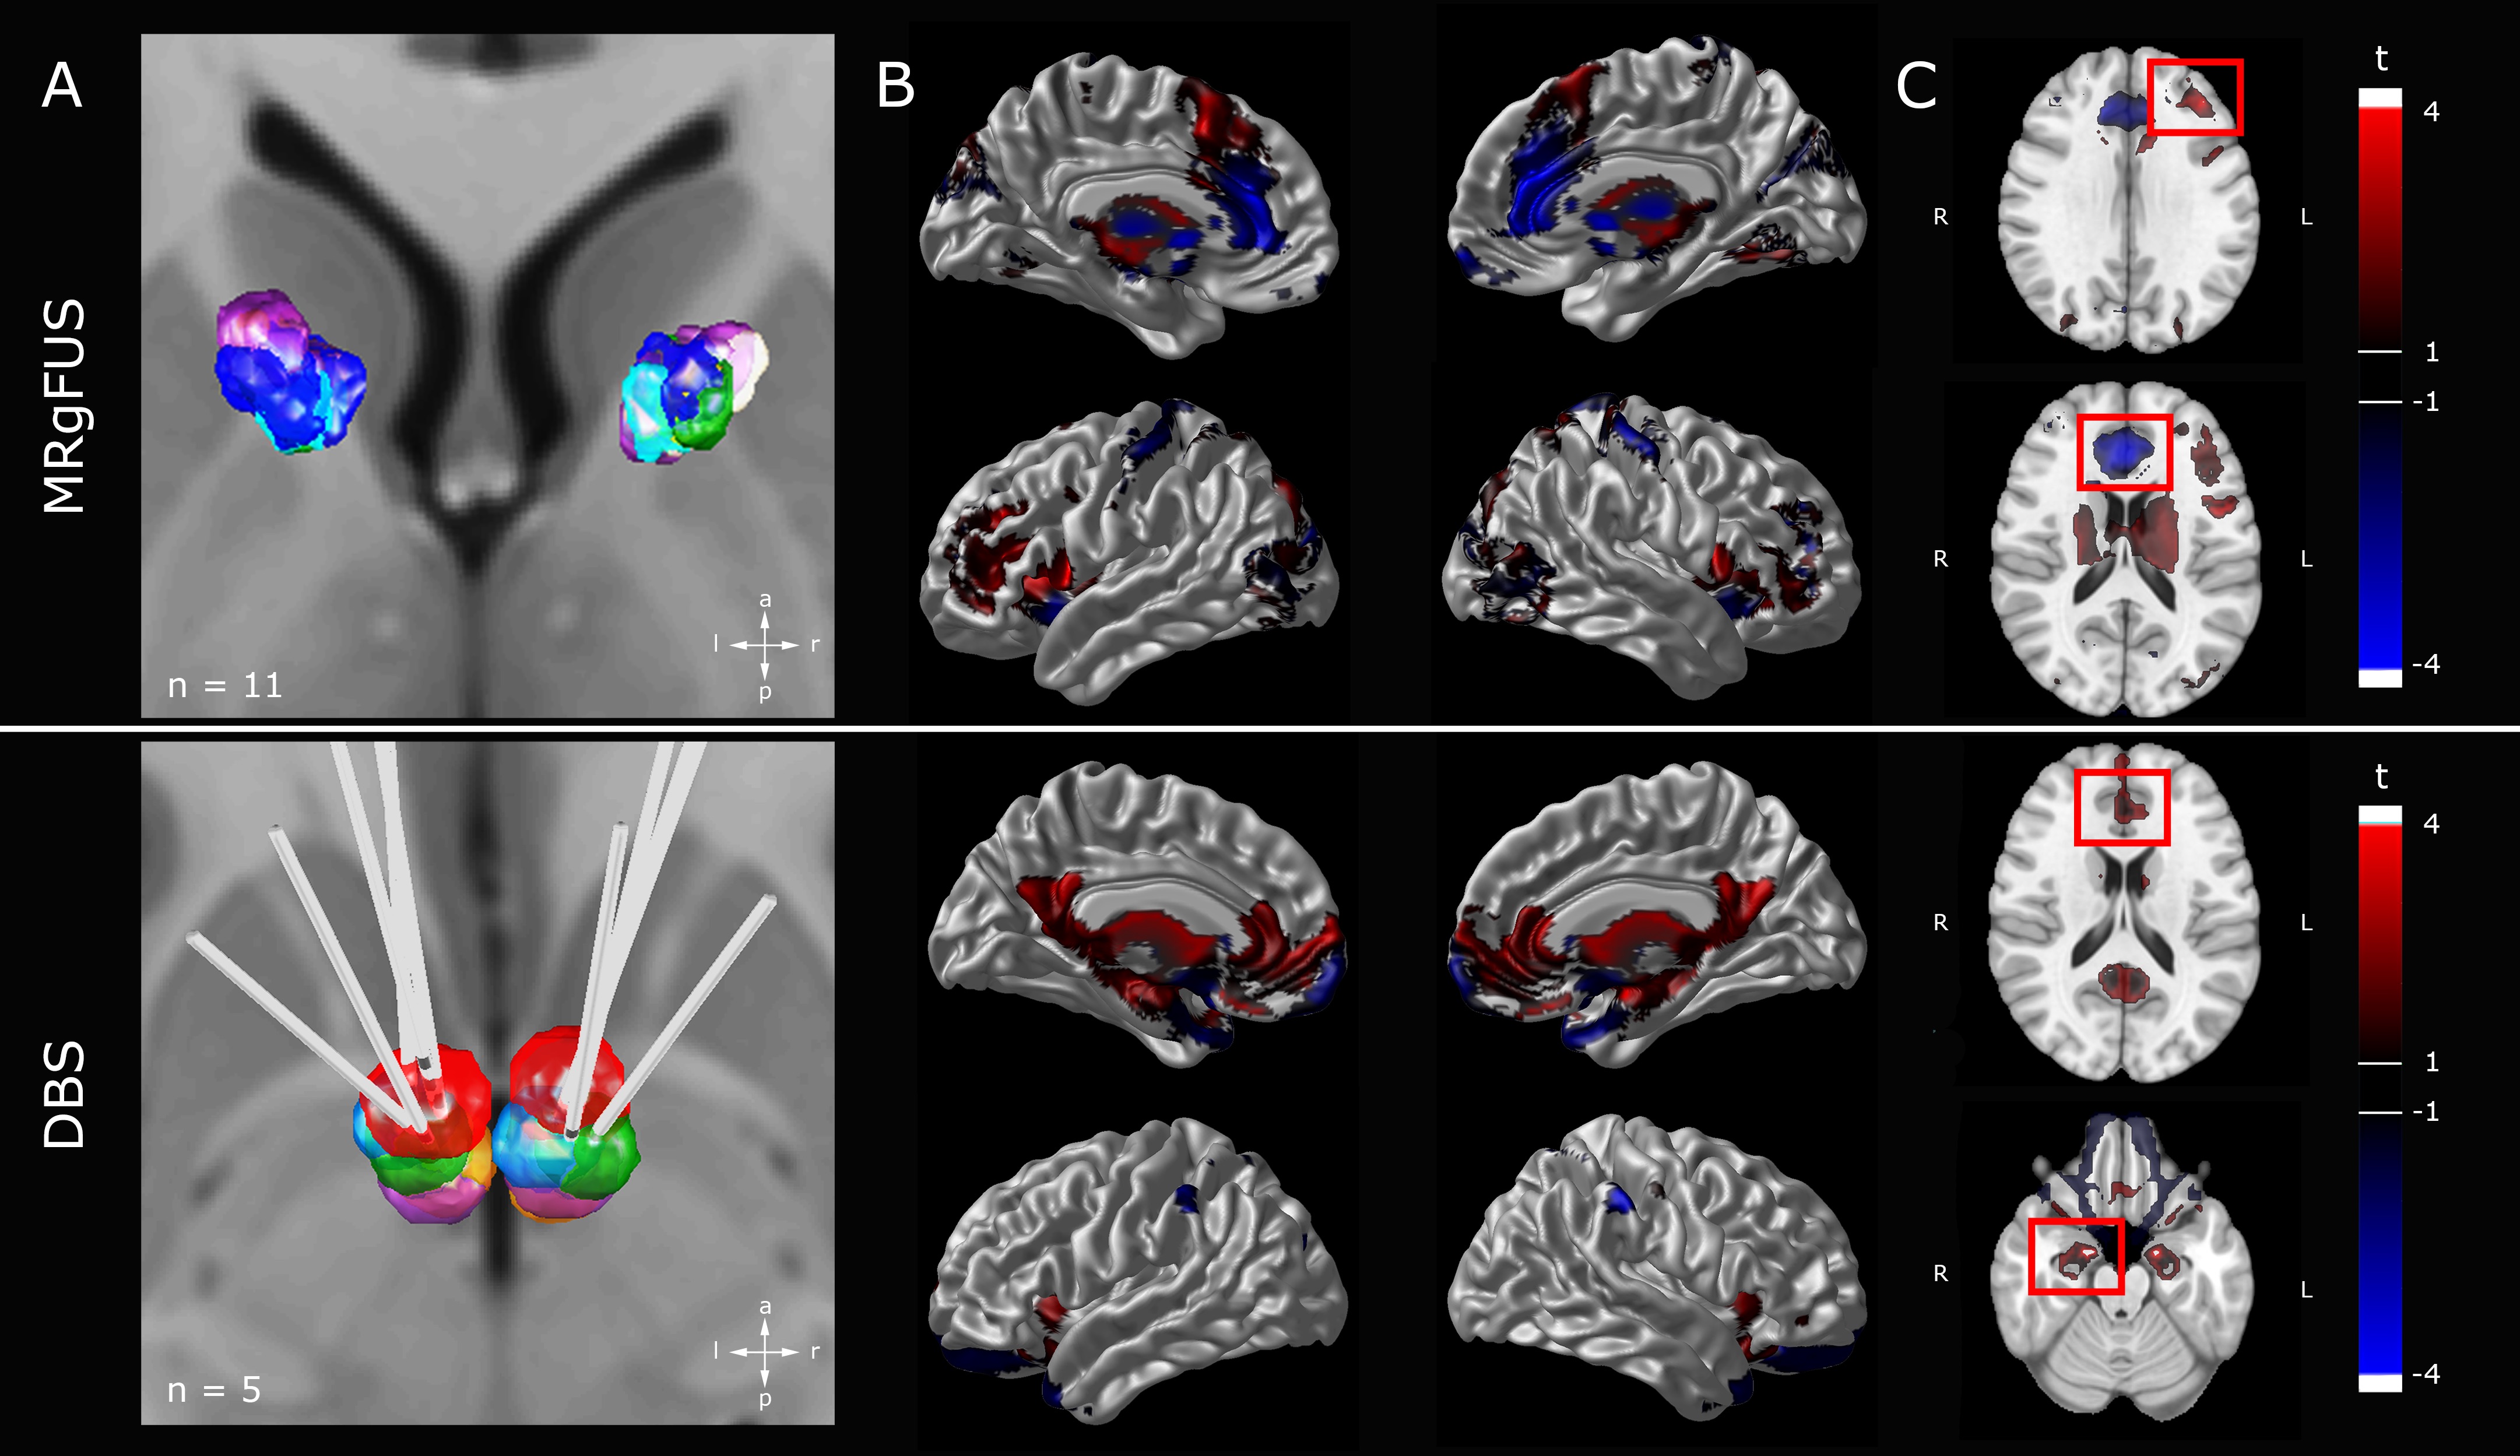
The present study expands on Lee and colleagues and Kim and colleagues [7], [8]. The DBS cohort consisted of five patients (3 females; age range: 25-48 years); the MRgFUS cohort of 11 patients (6 females; age range: 23-44 years). ITP was targeted 6.5 mm lateral, 3.0 mm posterior and 0.5 mm ventral to the anterior commissure (AC). Post-operatively, electrical stimulation was performed (frequency: 130 Hz; pulse width: 90 µs; voltage: 5.0 – 8.5 V). The target for MRgFUS was 7.0 mm rostral to AC and extended 2.0 – 3.0 mm along ALIC at AC-PC level (lesion diameter: 51.37 ±41.52 mm; number of sonications: 29.27 ±5.26; duration: 206.27 ±95.39 min). In both cohorts, the primary outcome was improvement of OCD symptoms as assessed using the Y-BOCS (improvement range: 6.5-72.7%). Pre- and post-surgery structural MRI data were acquired using a General Electric Bravo 3T (MRgFUS; enhanced fast gradient echo 3-D acquisition, axial T1 weighted, voxel 0.43x0.43x1 mm, TR=7.6-8.6 ms, TE=3 ms, flip angle=120°) or General Electric Signa Excite 1.5T scanner (DBS, 3-D spoiled gradient echo, axial T1 weighted, voxel size 1×1×1 mm, TR=12.4 ms, TE=5.3 ms, flip angle=20°). Lesions were delineated the using post-operative structural MR images (1 week post-surgery). Images were normalized to standard space (ICBM 2009b NLIN asymmetric) in a two-step process: 9 DOF linear registration (FLIRT) [9] followed by nonlinear registration (ANTS) [10]. DBS electrode localization and volume of tissue activated (VTA) modelling was performed with Lead-DBS 2 (https://www.lead-dbs.org/). Bilateral VTAs associated with the 12 month post-operative settings were modelled. Subsequently, the electric field was simulated and a binary VTA generated (thresholding at 0.2 V/mm). Patterns of functional connectivity associated with patient lesions and VTAs were explored using normative data constructed from the 1000-subject resting state fMRI Brain Genomics Superstruct Project dataset (http://neuroinformatics.harvard.edu/gsp)[11]. Each lesion mask and VTA pair were utilized as seed and whole-brain, voxel-wise connectivity r-maps were obtained (in-house MATLAB script, The MathWorks, Inc., Version R2017b. Natick, MA, USA)[12]. All statistical analyses were performed using R (R 3.4.4, https://www.r-project.org) and RMINC (https://github.com/Mouse-Imaging-Centre/RMINC) software. A whole-brain voxel-wise linear regression testing the relationship of magnitude of functional correlation and symptom improvement was performed for each group to identify key regions. Using extracted individual correlation values for the identified regions, a linear model was used to predict symptom improvement based on the key regions alone and the model was subsequently validated (leave-one-out cross-validation (LOOCV) and train (MRgFUS)-test(DBS) validation).RESULTS
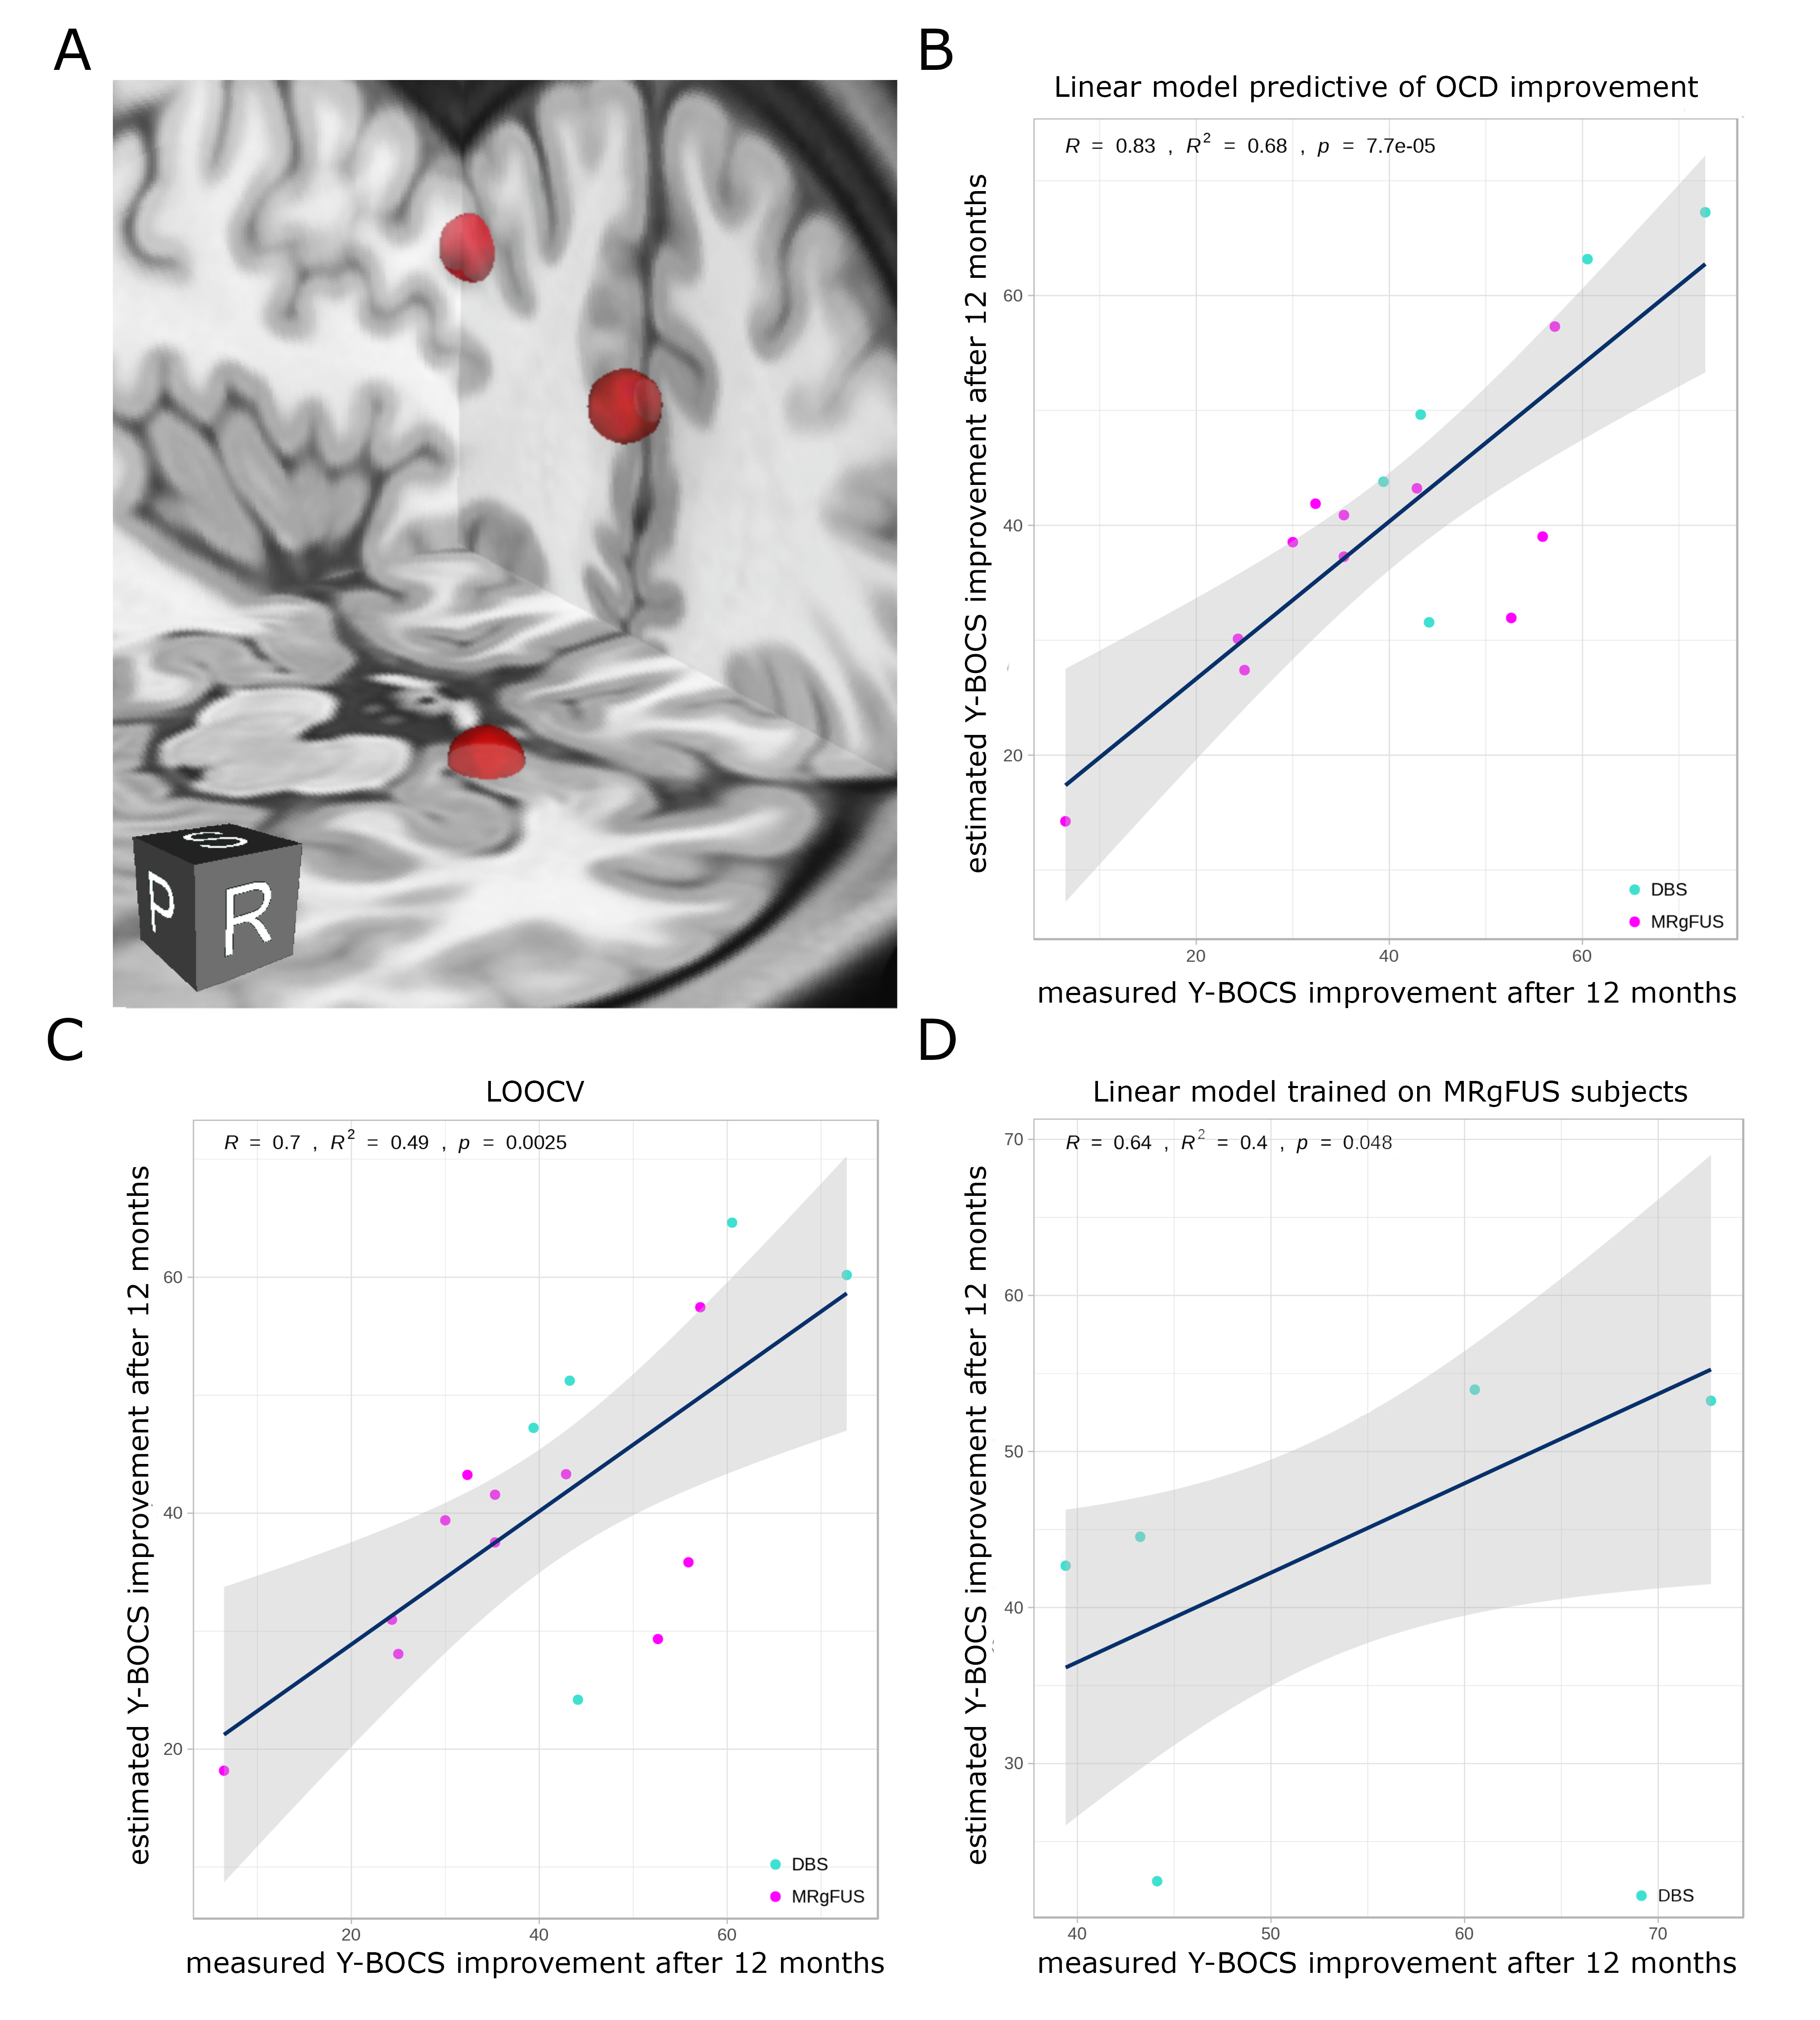
Across the two groups, three distinct peaks were prominent: dorsal anterior cingulate cortex (dACC, area 24, 0/32/18); left dorsolateral prefrontal cortex (DLPFC, area 46, -40/36/30); right amygdala (16/-6/22) (Figure 1). Clinical benefits (Y-BOCS improvement at 12 months) could be predicted with high accuracy using a linear model of these three nodes: R=0.83 (R2=0.68). LOOCV (R=0.7 (R2=0.49), p=0.0025 ) and translation from MRgFUS (training data) to DBS (test data) (R=0.64 (R2=0.4), p=0.048) validated the model (Figure 2).DISCUSSION
In the present study, the use of normative connectomics allowed the identification of key components of a putative distributed brain network that successfully predicted symptom improvement due to neuromodulation in OCD. Efficacy of both ALIC MRgFUS and ITP DBS depends on altering a network composed of three local brain regions, namely the left DLPFC, dorsal ACC, and the right amygdala. Engagement of these nodes accurately predicted treatment success, explaining 68% of the variance when using 12-month post treatment symptom improvement. Moreover, the three-node model was reliable and could be cross-validated across groups despite the different anatomical targets and techniques used to affect local tissue in each group.CONCLUSION
We show that, in two independent cohorts treated with different techniques targeting disparate brain regions, OCD symptom improvement can largely be explained by the extent to which modulated tissue is functionally connected to a tripartite network of specific brain regions: the left DLPFC, dorsal ACC, and the right amygdala. Furthermore, the efficacious brain areas characterized provide immediate guidance for surgical targeting refinement.Acknowledgements
This work was supported by the German Research Foundation (Deutsche Forschungsgemeinschaft, DFG NE 2276/1-1) (C.N.) and the Canada Research Chair in Neuroscience (A.M.L.).
Competing interests: A.M.L. is a co-founder of Functional Neuromodulation and a consultant for Medtronic, Boston Scientific, Abbott and Insightech.
References
[1] T. W. Robbins, M. M. Vaghi, and P. Banca, “Obsessive-Compulsive Disorder: Puzzles and Prospects,” Neuron, vol. 102, no. 1, pp. 27–47, Apr. 2019.[2] L. S. van Velzen et al., “Altered inhibition-related frontolimbic connectivity in obsessive-compulsive disorder,” Hum. Brain Mapp., vol. 36, no. 10, pp. 4064–4075, Oct. 2015.[3] K. Dunlop, B. Woodside, M. Olmsted, P. Colton, P. Giacobbe, and J. Downar, “Reductions in Cortico-Striatal Hyperconnectivity Accompany Successful Treatment of Obsessive-Compulsive Disorder with Dorsomedial Prefrontal rTMS,” Neuropsychopharmacology, vol. 41, no. 5, pp. 1395–1403, Apr. 2016.[4] B. C. G. Lisboa et al., “Initial findings of striatum tripartite model in OCD brain samples based on transcriptome analysis,” Sci. Rep., vol. 9, no. 1, p. 3086, Feb. 2019.[5] D. Simon, C. Kaufmann, K. Müsch, E. Kischkel, and N. Kathmann, “Fronto-striato-limbic hyperactivation in obsessive-compulsive disorder during individually tailored symptom provocation,” Psychophysiology, vol. 47, no. 4, pp. 728–738, Jul. 2010.[6] X. He, E. Steinberg, M. Stefan, M. Fontaine, H. B. Simpson, and R. Marsh, “Altered frontal interhemispheric and fronto-limbic structural connectivity in unmedicated adults with obsessive-compulsive disorder,” Hum. Brain Mapp., vol. 39, no. 2, pp. 803–810, Feb. 2018.[7] D. J. Lee et al., “Inferior thalamic peduncle deep brain stimulation for treatment-refractory obsessive-compulsive disorder: A phase 1 pilot trial,” Brain Stimul., vol. 12, no. 2, pp. 344–352, Mar. 2019.[8] S. J. Kim, D. Roh, H. H. Jung, W. S. Chang, C.-H. Kim, and J. W. Chang, “A study of novel bilateral thermal capsulotomy with focused ultrasound for treatment-refractory obsessive-compulsive disorder: 2-year follow-up,” J. Psychiatry Neurosci., vol. 43, no. 4, p. 170188, May 2018.[9] M. Jenkinson, C. F. Beckmann, T. E. J. Behrens, M. W. Woolrich, and S. M. Smith, “FSL,” NeuroImage, vol. 62, no. 2. pp. 782–790, 2012.[10] B. B. Avants, N. J. Tustison, G. Song, P. A. Cook, A. Klein, and J. C. Gee, “A reproducible evaluation of ANTs similarity metric performance in brain image registration,” Neuroimage, vol. 54, no. 3, pp. 2033–2044, Feb. 2011.[11] B. T. T. Yeo et al., “The organization of the human cerebral cortex estimated by intrinsic functional connectivity,” J. Neurophysiol., vol. 106, no. 3, pp. 1125–1165, Sep. 2011.[12] M. D. Fox, R. L. Buckner, H. Liu, M. M. Chakravarty, A. M. Lozano, and A. Pascual-Leone, “Resting-state networks link invasive and noninvasive brain stimulation across diverse psychiatric and neurological diseases,” Proc. Natl. Acad. Sci. U. S. A., vol. 111, no. 41, pp. E4367–75, Oct. 2014.Figures