1984
MRI Brain Morphometry in Heterosexual Men and Women, Gay Men, and Transgender Women: A Preliminary Study1Radiologic Technology, Chiang Mai University, Chiang Mai, Thailand, 2Radiology, Chiang Mai University, Chiang Mai, Thailand, 3Psychology, University of Toronto Mississauga, Mississauga, ON, Canada, 4Research Institute for Health Sciences, Chiang Mai University, Chiang Mai, Thailand
Synopsis
This study investigated brain bases of sexual and gender diversity. Heterosexual men and women, gay men, and transgender women underwent structural MRI. Regional volumes and cortical thickness were examined. Heterosexual sex differences were replicated. Men had greater gray and white matter volumes and women had thicker cortices. Overall, transgender women had a brain pattern that more closely reflected that of heterosexual women, whereas gay men were more similar to heterosexual men. Yet, transgender women also showed some volume and cortical thickness similarities to heterosexual men. These findings help identify brain regions related to gender identity.
Pupose
Transgender people are associated with strong feelings of incongruence between their physical sex and experienced gender. Cisgender (i.e., non-transgender) individuals are those who gender identity match with their assigned sex. 1Transgender or transsexual individuals who suffer from their condition can be diagnosed with gender dysphoria (GD) or gender identity disorder(GID) leading to hormone therapy. 2Transsexualism is subsumed under the category of gender identity disorders by World Organization, and coded as F64.0. 3-5Studies show that structural brain pattern is associated with transgenderism and sexual orientation. We aim to find the relation of brain morphology including WM and GM volumes and cortical thickness to transgender women (i.e., assigned male at birth, sexually oriented toward men, female gender), gay men (who are female-typical in their sexual preference but male-typical in their gender expression/identity), and heterosexual (males and females) as control groups. The key prediction is that the transgender women will show a structural brain pattern similar to that of cisgender women, whereas gay men will be intermediate between cisgender men and women.Materials and Methods
Four groups of volunteer participants were recruited: 19 men (M), 18 women (F), 18 gay men (G), and 16 transgender women (TG) (mean age of each group is 27.95 ± 4.86, 26.78±5.01, 26.8±5.82, and 24.19±4.43 years old respectively). The study was approved by a local institutional review board. All participants were HIV-negative and passed MRI safety screening. MRI of brains were acquired on a 1.5 Tesla, Ingenia, Philips, Netherland MR Scanner. Axial T1-weighted images with 3D FFE pulse sequence, repetition time (TR) 20 ms, echo time (TE) 4.6 ms, flip angle 30 ͦ and voxel size 0.94 x 0.94 x 1 mm3 were used for MRI acquisition. Segmentation of cortical regional structure volume and cortical mapping were done by FreeSurfer (FS) version 5.3 developed by Martinos Center for Biomedical Imaging (http://surfer.nmr.mgh.harvard.edu/). Brain volumes and cortical thickness were compared between groups: M&F, M&G, M&TG, TG&F, F&G, and TG&G.Results
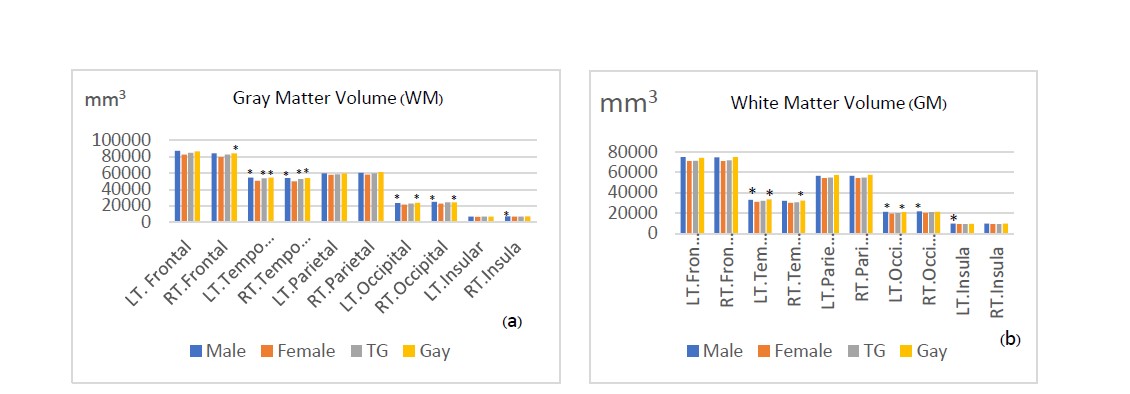
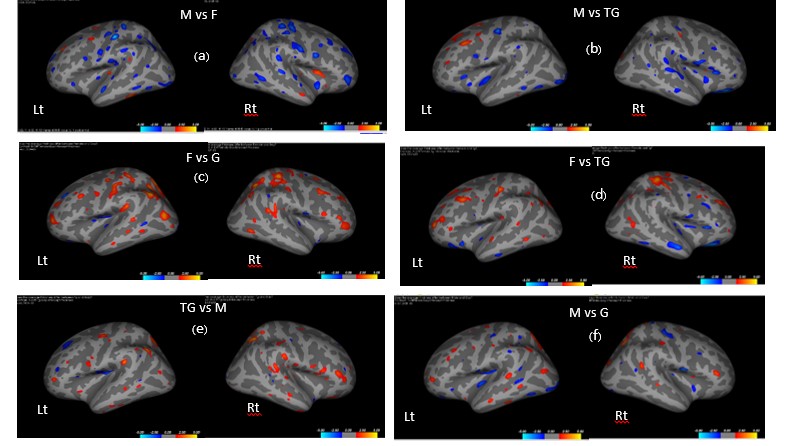
The results show higher volume of GM in M over F in all brain regions but only some regions had significantly higher volumes (p < 0.05), including: temporal lobes (M, G and TG > F), Rt frontal lobe (G>F), Rt insula (M>F), and occipital lobe (M and G > F) as in Fig 1(a). For the WM volume, M also showed greater volume than F, with significant differences including: Lt temporal (M and G > F), Rt temporal lobe (G > F), Lt occipital (M and G > F), Rt occipital (M > F), and Lt insula (M > F) as in Fig 1(b).Cortical thickness F showed the thickest cortical structures in most parts compared to other groups. M had thinner cortices in most parts compared to F and TG (blue mapping in Fig.2(a) and 2(b)). F had thicker cortices than G and TG (orange mapping in Fig.2(c), 2(d)). However, TG and F exhibit slightly mixed increases and decreases in cortical thickness on temporal lobes as in Fig. 2(d). There was significantly increased cortical thickness in TG compared to G in most parts, Fig 2(e). For comparisons of M and G, there is a scatter pattern of mixed regions with increased and decreased relative thickness, Fig 2 (f).
Discussion and conclusion
These preliminary data provide further evidence regarding brain sex differences, and help inform our understanding of the brain bases of sexual and gender diversity. Among cisgender heterosexual men and women, men showed greater GM and WM volumes in a number of regions and women showed thicker cortices. These findings are consistent with the idea that men and women show several differences in regional brain structure.4 With regard to comparisons among all four groups, the general patterns observed for the brain metrics considered here suggested that transgender women and gay men show somewhat different patterns of brain structure; transgender women showed thicker cortices than gay men in several regions. Further, in line with our prediction, transgender women were more similar to cisgender women than were gay men in terms of brain structure patterns overall. For occipital lobe GM and Rt and Lt temporal lobe WM, men and gay men had higher volumes than women, but transgender women did not differ from women in these regions. Similarly, for cortical thickness, heterosexual men had thinner cortices than heterosexual women and transgender women, whereas gay men had thinner cortices than transgender women and showed more of a mixed pattern relative to heterosexual men. That said, there were some regions in which heterosexual women had thicker cortices than transgender women and in which transgender women showed more male-typical GM volumes, suggesting transgender women do not show the exact same structural brain patterns as heterosexual women. Rather, transgender women might have a “mosaic” brain pattern that includes male-typical and female-typical brain features. Future work with larger sample sizes is needed to strengthen group comparisons further assess these possibilities. It will also be important to compare transgender women who do vs. do not use exogenous hormones, as many transgender women use such hormones (e.g., estrogen), which may influence their brain structure to be more female-typical.Acknowledgements
NSERCReferences
1. ES Smith, J Junger, B Derntl, U Habel, The transsexual brain – A review of findings on the neural basis of transsexualism, Neuroscience and Biobehavioral Reviews, 59 (2015) 251–266
2. World Health Organization, 2014. International Statistical Classification ofDiseases and Related Health Problems, 10th ed, Retrieved from: http://apps.who.int/classifications/icd10/browse/2014/en.
3. L Gooren, The biology of human psychosexual differentiation, Hormones and Behavior, 50 (2006), 589-601.
4. A Guillamon, Junque, C., & Gomez-Gil, E. A review of the status of brain structure in transsexualism. Archives of Sexual Behavior, 45 (2016), 1615-1648.
5. Meyer-Bahlburg, H. F. L., Transsexualism (“gender identity disorder”)—A CNS-limited form of intersexuality? Advances in Experimental Medicine and Biology, 707 (2011), 75-79.
Figures