1983
Subanesthetic ketamine infusion increases oxidative metabolism in human prefrontal cortex1Psychiatry, Connecticut Mental Health Center, Yale University, New Haven, CT, United States, 2VA Connecticut Health Care System, West Haven, CT, United States, 3Radiology and Biomedical Imaging, Yale University, New Haven, CT, United States, 4Psychology, Yale University, New Haven, CT, United States, 5Anesthesiology, Yale University, New Haven, CT, United States, 6Yale School of Public Health, Yale University, New Haven, CT, United States, 7Straun Health and Wellness, New Haven, CT, United States, 8Biomedical Engineering, Yale University, New Haven, CT, United States
Synopsis
We compared the effect of subanesthetic infusion of the NMDA receptor antagonist ketamine on metabolic activity to a similar volume of saline infusion in healthy volunteers. Since BOLD fMRI depends on neurovascular-neurometabolic couplings which can be confounded by pharmacological agents, we measured transverse relaxation rates (R2, R2*) and blood flow (CBF) to calculate oxidative metabolism (CMRO2) with calibrated fMRI. We found CBF and CMRO2 increased with ketamine infusion in nearly all Brodmann areas of the cortex. The CMRO2 increase was significant in prefrontal (0.16±0.06, p=0.026) and visual cortex (0.22±0.07, p=0.01), but not in sensorimotor cortex (0.17±0.14, p=0.258).
Introduction
Combining pharmaceutical agents with fMRI in humans can aid in translational research and expand our neuropsychological knowledge of key cognitive and emotional processes. Drugs can disrupt neurovascular-neurometabolic couplings hampering correct interpretation of observed effects but measuring cerebral metabolic rate of oxygen (CMRO2) by calibrated fMRI may solve these problems.In this study, we quantified CMRO2 during administration of the NMDA receptor antagonist ketamine during rest in the MRI magnet. NMDA receptor antagonists increase brain activation during rest as measured by positron emission tomography (PET) in humans1 and, in animals, increase cortical firing rate2 and elevate extracellular glutamate levels3. Ketamine safely produces temporary cognitive deficits and hallucinations resembling those in schizophrenia in healthy subjects4,5. Furthermore, earlier study has shown that subanesthetic dose ketamine decreases the cognitive responses during working memory measured by BOLD signal6.
We measured cerebral blood flow (CBF) and transverse relaxation rates with gradient-echo (R2*) and spin-echo (R2) sequences for CMRO2 calculation. We also measured performance and BOLD activation during a working memory task and rated subjects’ psychotomimetic experiences. These measures can be related to subjects’ CMRO2 values in relevant regions, such as prefrontal cortex (PFC). Our emphasis here is the sensitivity of CBF/CMRO2 to the ketamine intervention.
Methods
We measured CMRO2 in ten healthy volunteers (n=10) who each participated in two MRI sessions, one with saline infusion and one with a subanesthetic infusion of ketamine separated by at least two weeks. The study was double-blind and ketamine or saline was infused in the MRI scanner (Siemens Prisma 3.0T). Ketamine was infused in the MRI scanner starting with a bolus (0.23 mg/kg/min ketamine which was subsequently reduced to 0.58 mg/kg/hour ketamine for 30 min. After 30 minutes, the infusion was reduced to 0.29 mg/kg/hour to yield steady plasma ketamine levels throughout the session of ~145 ng/ml.During the session, we collected R2, R2* and arterial spin labeling (ASL) images to calculate R2’=R2*-R27 and CBF maps8, where R2’ and R2 represent the blood oxygenation-dependent reversible and irreversible relaxation components9. Based on previous experimental evidence, we estimated Grubb’s coefficient α as 0.2. This co-efficient allows cerebral blood volume (CBV) to be related to CBF by a power-law. We also estimated exponent β as 1.5 based on experimental evidence10. This exponent captures the BOLD signal’s dependencies on deoxyhemoglobin and relates CMRO2 to CBF. Using these imputed constants, R2’ and CBF maps, we calculated relative CMRO27 changes between saline and ketamine infusion: (CMRO2,Ketamine / CMRO2,Saline)β = (CBFKetamine / CBFSaline)α-β / (R2,Ketamine’ / R2,Saline’)
Before calculation data were motion corrected, registered and normalized to MNI space for group analysis by SPM12, AFNI11, and BioimageSuite12. Voxel-based morphometry was used to create a gray matter mask for each subject. Data were scrutinized and outliers13 were removed. We analyzed the data using Brodmann areas as described previously14, and we selected 3 regions for statistical comparisons: PFC, sensorimotor cortex (SM) and visual cortex (VC) (Figure 1) within the gray matter (GM).
Results
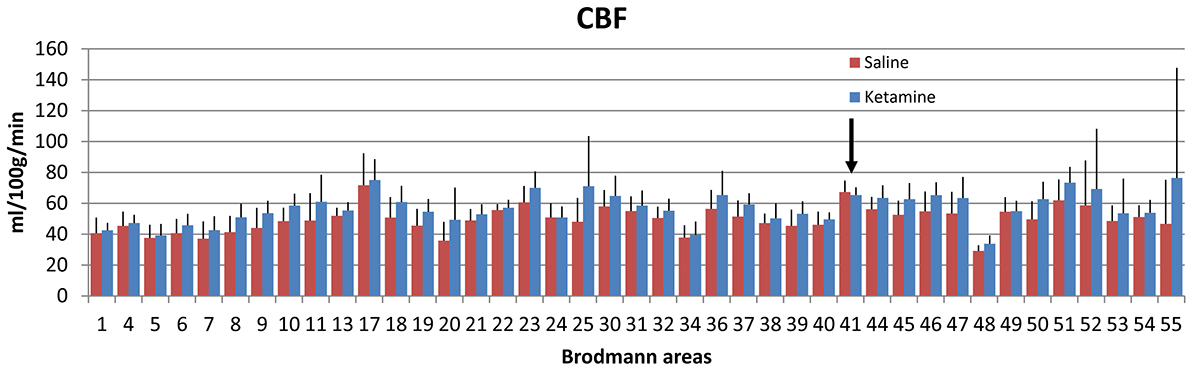
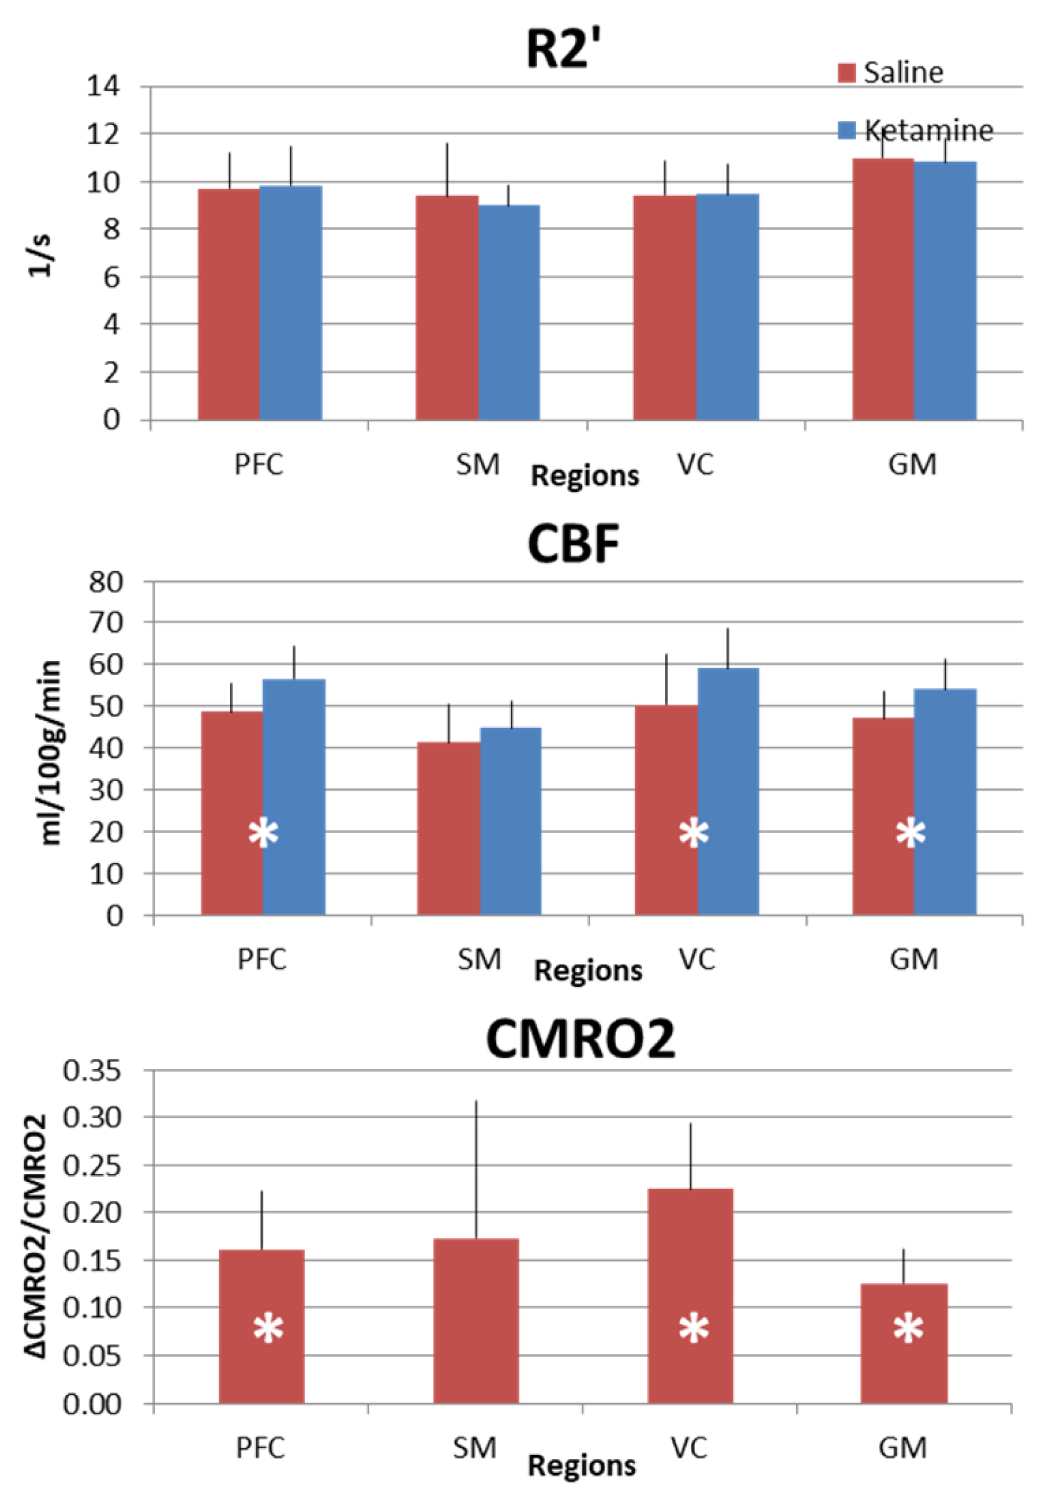
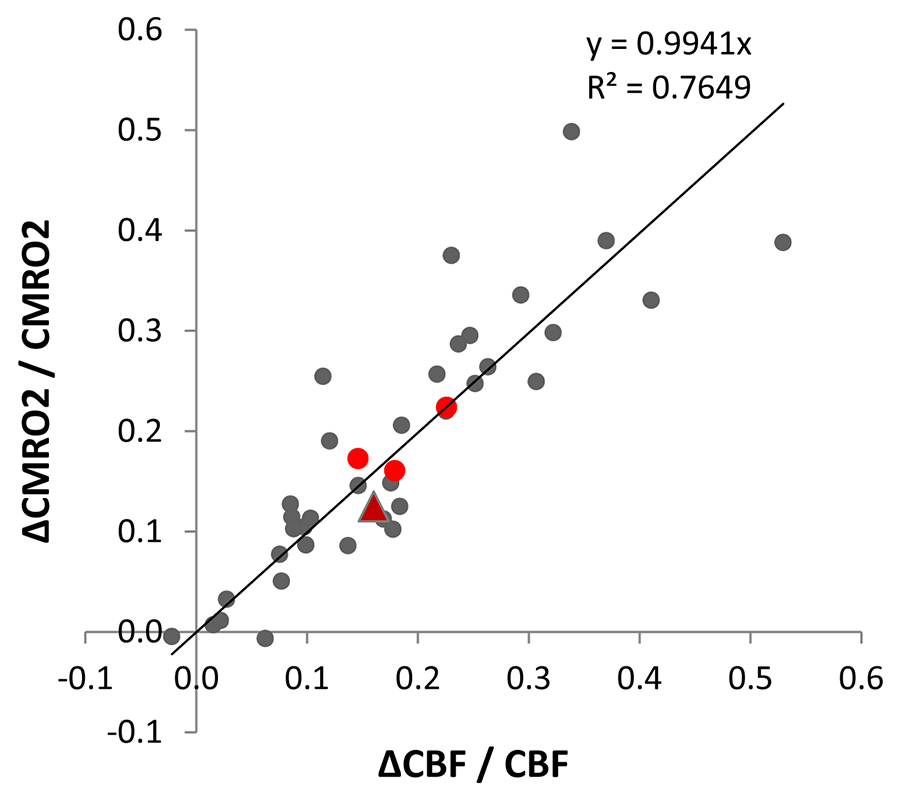
CBF and CMRO2 increases under ketamine were observed throughout the brain. Of the 41 Brodmann areas assessed, all showed increases in CBF except for one, primary and associative auditory cortex (Figure 2). In the areas with increase, the Cohen’s d15 effect size ranged from 0.06 to 1.04. Even at this small sample size (n = 10), 16 of the 41 areas attained statistically significant differences between ketamine and saline (paired t-test at alpha=0.05 with no correction for multiple comparisons). Similarly, all but three areas evidenced increased CMRO2 with effect sizes ranging from 0.038 to 1.16 and 7 areas attaining statistical significance. In contrast, effect sizes for R2’ were generally smaller with no areas reaching statistical significance.For further analysis, we quantified changes in all the grey matter voxels as well as changes in PFC, SM and VC. R2’ did not change significantly in GM between saline and ketamine infusion (10.96±1.31s-1 vs 10.81±1.01s-1), but there was a consistent tendency of lower R2’ values in the ketamine state (Figure 3). The CBF was significantly higher in the ketamine state in GM (47.1±6.52 vs. 54.01±7.11 ml/100g/min, p=0.013), in PFC (48.7±6.99 vs. 56.62±7.74 ml/100g/min, p=0.016), and in VC (50.41 ±12.22 vs. 59.11±9.34 ml/100g/min, p=0.04) and non-significant in SM (41.24±9.05 vs. 44.86±6.2 ml/100g/min, p=0.287). Since CMRO2 and CBF changes are almost linearly correlated in this range (Figure 4), the relative CMRO2 changes show similar results: we observed significant changes in GM, PFC and VC (0.12±0.04, p=0.008; 0.16±0.06, p=0.026; 0.22±0.07, p=0.01, respectively) and non-significant increase in SM (0.17±0.14, p=0.258). The Cohen’s d effect size is almost three times higher in PFC (0.86) than in SM (0.29).
Discussion
In a small sample size of ten subjects, CBF and CMRO2 were shown to be sensitive to ketamine. Increased CBF and CMRO2 were ubiquitous extending to almost all grey matter areas. Large effect sizes were obtained with statistical significance reached in visual and prefrontal cortices. CBF and CMRO2 were highly correlated and no difference in sensitivity to ketamine was observed. However, the two measures may differ in their ability to predict working memory dysfunction and psychotomimetic experiences under ketamine.Acknowledgements
This study was supported by the National Institutes of Health, USA (R21 MH110862, R01 MH067528), the National Center for Posttraumatic Stress Disorder, and CTSA Grant Number UL1 TR000142 from the National Center for Advancing Translational Science.References
1. Vollenweider FX, Leenders KL, Scharfetter C, et al. Metabolic hyperfrontality and psychopathology in the ketamine model of psychosis using positron emission tomography (PET) and [18F]fluorodeoxyglucose (FDG). Eur Neuropsychopharmacol, 1997. 7(1): 9-24.
2. Jackson ME, Homayoun H, and Moghaddam B. NMDA receptor hypofunction produces concommitant firing rate potentiation and burst activity reduction in the prefrontal cortex. Neuroscience, 2004. 101: 8467-8472.
3. Moghaddam B, Adams B, Verma A, et al. Activation of glutamatergic neurotransmission by ketamine: a novel step in the pathway from NMDA receptor blockade to dopaminergic and cognitive disruptions associated with the prefrontal cortex. J Neurosci, 1997. 17(8): 2921-7.
4. Driesen NR, McCarthy G, Bhagwagar Z, et al. Relationship of resting brain hyperconnectivity and schizophrenia-like symptoms produced by the NMDA receptor antagonist ketamine in humans. Mol Psychiatry, 2013. 18: 1199-1204.
5. Krystal JH, Bennett A, Abi-Saab D, et al. Dissociation of ketamine effects on rule acquisition and rule implementation: possible relevance to NMDA receptor contributions to executive cognitive functions. Biological Psychiatry, 2000. 47(2): 137-143.
6. Driesen NR, McCarthy G, Bhagwagar Z, et al. The impact of NMDA receptor blockade on human working memory-related prefrontal function and connectivity. Neuropsychopharmacology, 2013. 38(13): 2613-22.
7. Shu CY, Herman P, Coman D, et al. Brain region and activity-dependent properties of M for calibrated fMRI. Neuroimage, 2016. 125: 848-56.
8. Qiu M, Paul Maguire R, Arora J, et al. Arterial transit time effects in pulsed arterial spin labeling CBF mapping: insight from a PET and MR study in normal human subjects. Magn Reson Med, 2010. 63(2): 374-84.
9. Kida I, Kennan RP, Rothman DL, et al. High-resolution CMR(O2) mapping in rat cortex: a multiparametric approach to calibration of BOLD image contrast at 7 Tesla. J Cereb Blood Flow Metab, 2000. 20(5): 847-60.
10. Shu CY, Sanganahalli BG, Coman D, et al. Quantitative beta mapping for calibrated fMRI. Neuroimage, 2016. 126: 219-28.
11. Cox RW. AFNI: software for analysis and visualization of functional magnetic resonance neuroimages. Computers and Biomedical Research, 1996. 29(3): 162-73.
12. Papademetris X, Jackowski M, Rajeevan N, et al. BioImage Suite: An integrated medical image analysis suite. Section of Bioimaging Sciences, Dept. of Diagnostic Radiology, Yale School of Medicine, 1998.
13. Leys C, Ley C, Klein O, et al. Detecting outliers: Do not use standard deviation around the mean, use absolute deviation around the median. Journal of Experimental Social Psychology, 2013. 49(4): 764-766.
14. Hyder F, Rothman DL, and Bennett MR. Cortical energy demands of signaling and nonsignaling components in brain are conserved across mammalian species and activity levels. Proc Natl Acad Sci U S A, 2013. 110(9): 3549-54.
15. Cohen J, Statistical Power Analysis for the Behavioral Sciences. 1988: Routledge.
Figures
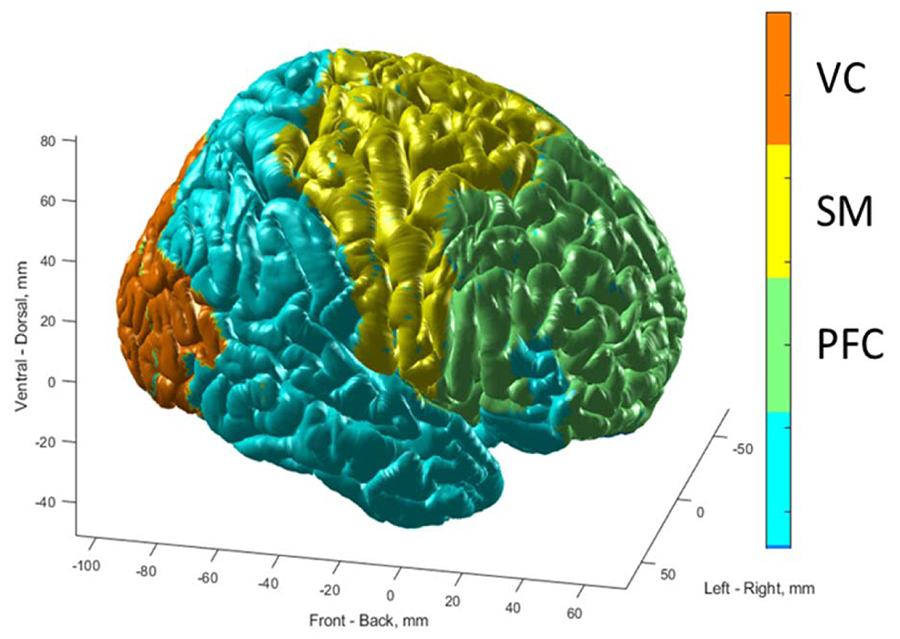
Figure 1. Localizations of prefrontal cortex (PFC), sensorimotor cortex (SM), visual cortex (VC) are shown on the surface of MNI brain. PFC includes Brodmann areas #8,9,10,11,13,24,25,32,44,45 and covers 17337 2x2x2 mm3 voxels. SM includes Brodmann areas #1,4,5,6 and covers 7742 2x2x2 mm3 voxels. VC includes Brodmann areas #17,18,19 and covers 8265 2x2x2 mm3 voxels. GM includes 76336 2x2x2 mm3 voxels.