1982
Quantitative volumetric and parametric alterations in patients suffering from anorexia nervosa1Medical Imaging Physics, Institute of Neuroscience and Medicine 4, Jülich, Germany, 2Institute of Neuroscience and Medicine 11, INM 11, JARA, Jülich, Germany, 3Department of Neurology, Faculty of Medicine, Aachen, Germany
Synopsis
Anorexia nervosa (AN) is an eating disorder characterized by severe weight loss due to a fear of gaining weight and obsessions relating to body shape. AN is a psychiatric illness, and although psychiatric co-morbidity in AN has already been extensively studied, the extent to which it can affect mortality is unclear. In this work, a quantitative and volumetric study to monitor the disease-related integrity of the brain tissue in a cohort of AN patients and healthy controls was performed. The preliminary results suggest that psychological treatment may be useful in terms of brain tissue integrity, even after only three months.
Introduction
The eating disorder anorexia nervosa (AN) is the most chronic psychiatric disease amongst adolescents,1,2 occurring more frequently in females than in males (8:1 ratio).3 It is characterized by severe weight loss and self-starvation due to a fear of gaining weight and has the highest ratio of mortality of all psychiatric illness.3 Although a number of behavioural3,4 and brain volumetric studies5-10 have been performed, the pathophysiology of AN is still poorly understood. Previous volumetric studies comparing AN patients with healthy controls (HC) reported a significant loss of the total brain volume, a reduction in grey matter (GM) volume and an increase in cerebrospinal fluid (CSF) in AN patients.5-10Quantitative MRI measures, e.g., cerebral free water content (FW) or tissue relaxation times (T1, T2*) are promising potential biomarkers to aid early detection and further treatment response monitoring of changes in the brain.11-14 The aim of this study was to evaluate quantitative parametric changes and volumetric changes in AN patients at two time points, namely before and after psychological treatment (short-term recovery period of three months).
Methods
A total of 31 female adolescent participants, 17 with AN with mean age of 15.06 (±1.47) years and 14 healthy controls (HC) with mean age of 15.5 (±1.74) years were scanned on a Siemens Magnetom Tim-Trio scanner using a gradient echo (GRE) sequence for mapping the cerebral water content as well as relaxation times.12,14 Patients undergoing psychological treatment and HC were scanned again after a short-term recovery period (3 months). T1-weighted MPRAGE images and quantitative maps were registered to a common MNI template (MNI152 1mm3) using the Automatic Registration Toolbox (http://www.nitrc.org/projects/art).15The normalized maps were further used to introduce the hybrid metric (H1), which is a linear combination of the three quantitative parameters normalized by the CSF values of the corresponding modalities. The null hypotheses H1(a,b,c) were then tested (no change, no decrease, no increase) for each metric. Finally, the raw p-values were analysed and the adjacent clusters of voxels rejecting the null hypothesis for the common p-value (0.05) were selected.
Voxel-based morphometry analysis was performed using the Computational Anatomy Toolbox (CAT12) (http://www.fil.ion.ucl.ac.uk/spm/software/spm12/). Region-of-interest (ROI) analysis was performed using the MNI-structural atlas, Harvard Oxford-cortical structural atlas, and the John-Hopkins University ICBM- white matter atlas.
Results
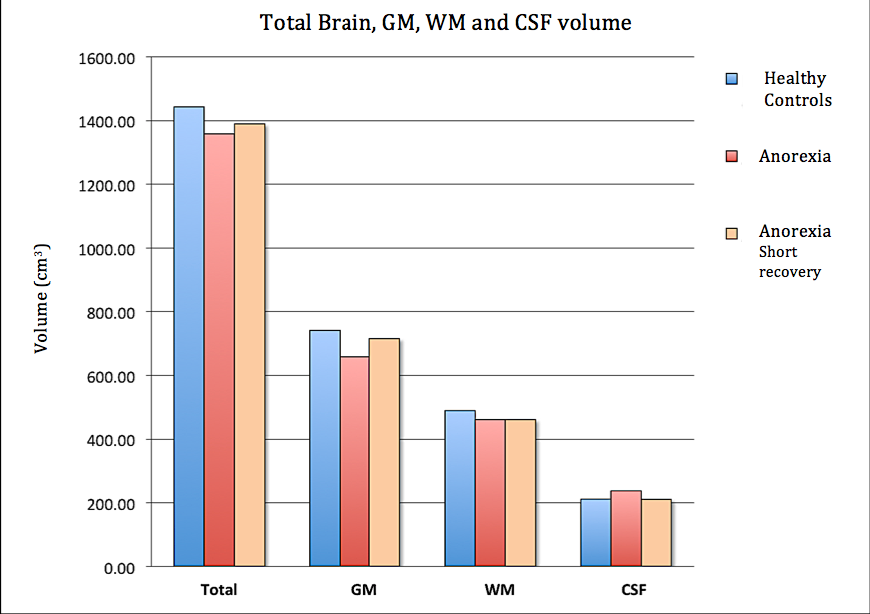
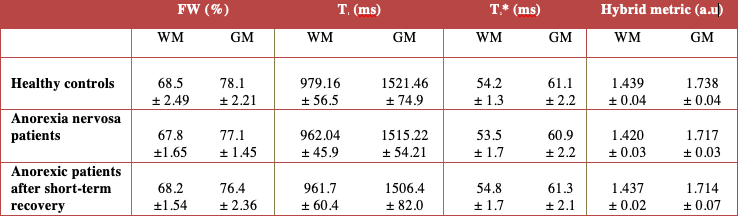
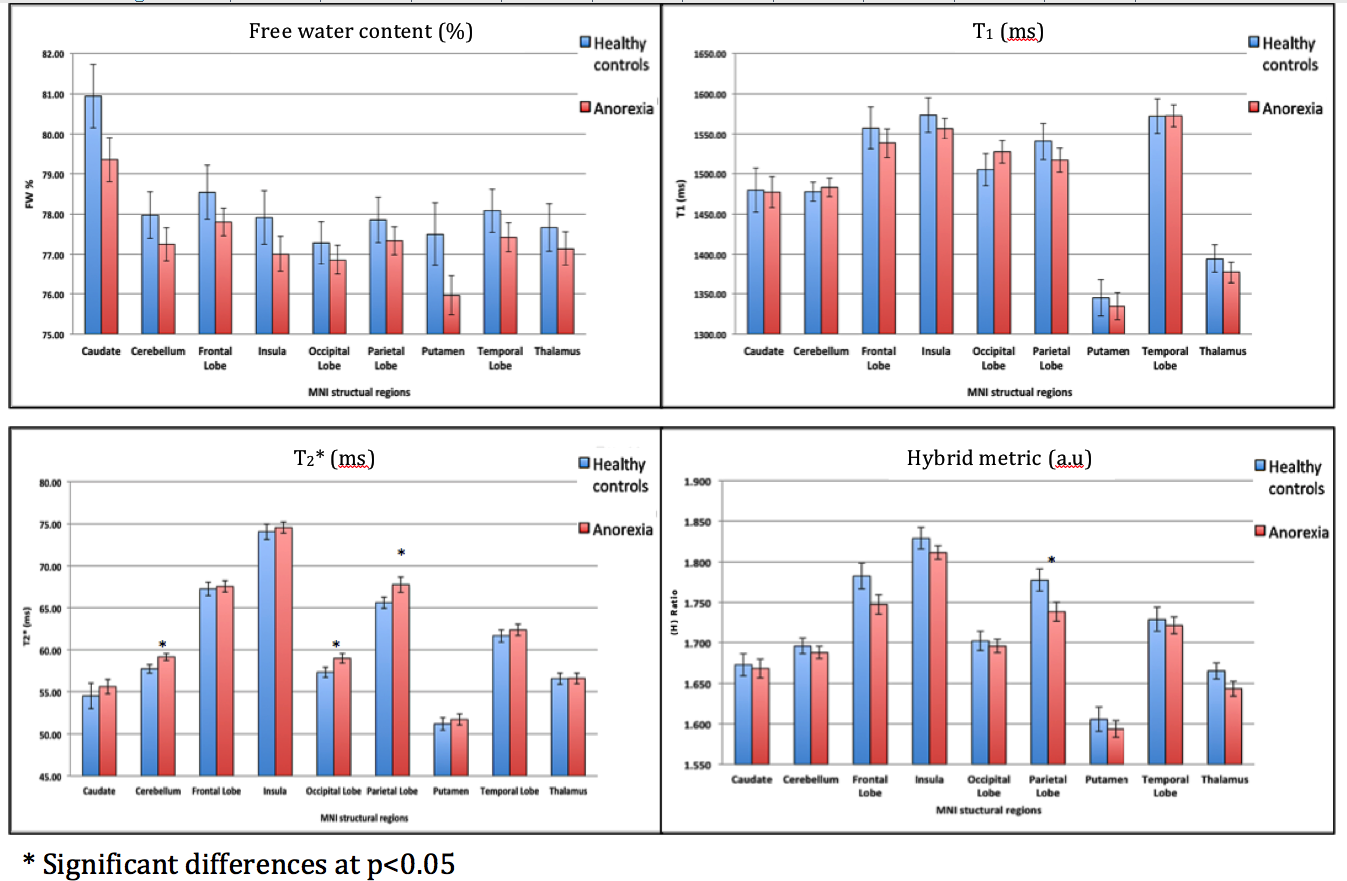
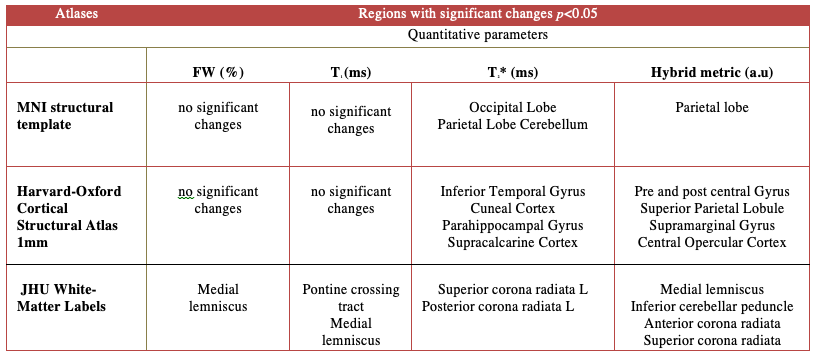
The AN patients undergoing psychological treatment gained significant weight (mean weight gain 5.17 KG) compared to HC (mean weight gain 1.12 KG) within three months. Volumetric analysis from the first time point revealed a significant reduction of the total brain volume, total GM volume, and gain in the CSF volume of the AN group compared to the HC group. Following short-term treatment, the GM volume tended to increase (however, non-significantly) and the CSF volume tended to reduce; nevertheless, no such changes in WM were observed, as shown in Figure 1.The global analysis of FW, T1 and T2* revealed non-significant differences between both groups at first time point, i.e., lower GM water content and T1 values in the AN group. This remained persistent even after short-term recovery (Figure 2). Higher T2* values in the AN group were found in the frontal, temporal, parietal and occipital GM, insula, putamen and cerebellum (Figure 3), compared to the HC group. These values are in line with the literature.16 Hybrid metrics analysis shows a non-significant reduction in WM and GM values for AN patients. The ROI-based analyses of the first time point for FW, T1, T2* and hybrid metrics values are reported in Figure 4. It shows the regions that have significant differences in AN patients as compared to HCs.
Discussion
This is the first in vivo, quantitative study based on quantitative water content estimation, revealing evidence of abnormal brain water content in AN patients. The observed weight loss in AN patients, compared to HCs, reportedly leads to the reduction of lipid content in the brain, which is eventually reflected in the loss of brain myelin content in AN patients and likely disrupts the normal neuro-developmental process of myelination during adolescence and early adulthood.17In Figure 4, the reported ROIs analysis from the AN study showing significant differences using T2* values and hybrid metrics validates previously reported findings using behavioural3,4 and functional MRI based studies.18-20 However, the biological or clinical explanations as to what causes the change in T2* (ms) in AN patients remains unclear.16 Further investigation is required to evaluate and interpret the disease causes in AN patients.
Conclusions
The present findings replicate and validate previous findings of reduced global cortical volume in adolescent AN patients. Quantitative analysis, i.e., the observed non-significant decrease in FW, T1 and significant changes in T2* values in some regions, contributing to the overall change in hybrid metric is most likely due to demyelination (neuronal cell death).16 The preliminary results suggest that psychological treatment may be useful even as a short-term treatment. The findings highlight the need for further investigation into the evaluation of water content analysis and further quantitative studies on this disease in order to gain a deeper understanding of the aetiology of WM and GM changes in AN.Acknowledgements
We thank Ms. Claire Rick for proof reading the manuscript.References
1. Nicholls D, Viner R. Eating disorders and weight problems. BMJ. 2005;330(7497):950-3
2. Olivo G, Wiemerslage L, Swenne I, et al. Limbic-thalamo-cortical projections and reward-related circuitry integrity affects eating behavior: A longitudinal DTI study in adolescents with restrictive eating disorders (vol 12, e0172129, 2017). Plos One. 2017;12
3. King JA, Frank GKW, Thompson PM, et al. Structural Neuroimaging of AnorexiaNervosa: Future Directions in the Quest for Mechanisms Underlying Dynamic Alterations. Biol Psychiat. 2018;83(3):224-34
4. Hadigan CM, Walsh BT, Buttinger C, et al. Behavioral and Neuroendocrine Responses to Metacpp in Anorexia-Nervosa. Biol Psychiat. 1995;37(8):504-11
5. Yue L, Wang Y, Kaye WH, et al. Structural alterations in the caudate nucleus and precuneus in un-medicated anorexia nervosa patients. Psychiat Res-Neuroim. 2018;281:12-8
6. Lazaro L, Bargallo N, Castro-Fornieles J, et al. Brain changes in children and adolescents with obsessive-compulsive disorder before and after treatment: A voxel-based morphometric MRI study. Psychiat Res-Neuroim. 2009;172(2):140-6.
7. Frank GKW, Shott ME, Hagman JO, et al. Localized Brain Volume and White Matter Integrity Alterations in Adolescent Anorexia Nervosa. J Am Acad Child Psy. 2013;52(10):1066-75
8. Swayze VW, Andersen AE, Andreasen NC, et al. Brain tissue volume segmentation in patients with anorexia nervosa before and after weight normalization. Int J Eat Disorder. 2003;33(1):33-44
9. Fujisawa TX, Yatsuga C, Mabe H, et al. Anorexia Nervosa during Adolescence Is Associated with Decreased Gray Matter Volume in the Inferior Frontal Gyrus. Plos One. 2015;10(6).
10. Bomba M, Riva A, Morzenti S, Grimaldi M, et al. Global and regional brain volumes normalization in weight-recovered adolescents with anorexia nervosa: preliminary findings of a longitudinal voxel-based morphometry study. Neuropsych Dis Treat. 2015;11:637-45
11. Shah NJ, Ermer V, Oros-Peusquens AM. Measuring the Absolute Water Content of the Brain Using Quantitative MRI. Methods Mol Biol. 2011;711:29-64
12. Neeb H, Ermer V, Stocker T, Shah NJ. Fast quantitative mapping of absolute water content with full brain coverage. Neuroimage. 2008;42(3):1094-109
13. Shah NJ, Neeb H, Kircheis G, et al. Quantitative cerebral water content mapping in hepatic encephalopathy. Neuroimage. 2008;41(3):706-17
14. Abbas Z, Gras V, Möllenhoff K, et al. Quantitative water content mapping at clinically relevant field strengths: A comparative study at 1.5T and 3T. Neuroimage. 2015;106:404-13.
15. Ardekani BA, Guckemus S, Bachman A, et al. Quantitative comparison of algorithms for inter-subject registration of 3D volumetric brain MRI scans. J Neurosci Methods. 2005;142(1):67-76.
16. Boto J, Askin NC, Regnaud A, et al. Cerebral Gray and White Matter Involvement in Anorexia Nervosa Evaluated by T1, T2, and T2*Mapping. J Neuroimaging. 2019;29(5):598-604.
17. Travis KE, Golden NH, Feldman HM, et al. Abnormal white matter properties in adolescent girls with anorexia nervosa. Neuroimage-Clin. 2015;9:648-59.
18. Esposito R, Cieri F, di Giannantonio M, et al. The role of body image and self-perception in anorexia nervosa: the neuroimaging perspective. J Neuropsychol. 2018;12(1):41-52.
19. Fuglset TS, Landro NI, Reas DL, et al. Functional brain alterations in anorexia nervosa: a scoping review. J Eat Disord. 2016;4:32.
20. McAdams CJ, Lohrenz T, Montague PR. Neural responses to kindness and malevolence differ in illness and recovery in women with anorexia nervosa. Hum Brain Mapp. 2015;36(12):5207-19.
Figures