1980
A 7T MRS study of Psilocybin administration in patients with major depressive disorder1Russell H. Morgan Department of Radiology and Radiological Science, The Johns Hopkins University, School of Medicine, Baltimore, MD, United States, 2F. M. Kirby Research Center for Functional Brain Imaging, Kennedy Krieger Institute, Baltimore, MD, United States, 3Center for Psychedelic and Consciousness Research, The Johns Hopkins University School of Medicine, Baltimore, MD, United States, 4Department of Psychiatry and Behavioral Sciences, The Johns Hopkins University School of Medicine, Baltimore, MD, United States, 5College of Social Work, The Ohio State University, Columbus, OH, United States, 6Department of Neuroscience, The Johns Hopkins University School of Medicine, Baltimore, MD, United States
Synopsis
Recent studies have shown that the administration of psilocybin may reduce depression severity. A role of glutamate was hypothesized in the antidepressant efficacy, however the exact neurobiological mechanisms remain unknown. Proton MR spectroscopy enables a valuable insight into glutamatergic metabolism and provides information about other important neuronal markers such as N-acetylaspartate. Here, we have utilized STEAM MR spectroscopy at 7T to observe the changes of cortical metabolites after psilocybin administration in patients with major depressive disorder. Two high dose sessions of psilocybin decreased glutamate and NAA levels of the anterior cingulate in the cohort.
Introduction
Recent reports have shown that a small number of psilocybin administrations (1-3 doses) under supportive conditions may greatly reduce depression severity for up to 6 months in patients with treatment resistant depression1 and patients with depression and anxiety secondary to a cancer diagnosis2,3. No other depression therapy, including therapy with the NMDA antagonist ketamine, has been shown to exert such profound and sustained effects with such a limited intervention. A role for glutamate in antidepressant efficacy was suggested by the rapid antidepressant effects of ketamine4,5, and recent proton magnetic resonance imaging studies have identified abnormalities in glutamatergic neurometabolite levels in patients with depression6. Preclinical evidence suggests that antidepressant effects of both ketamine and psilocybin may depend on glutamate-induced neuroplasticity7. However, neither a specific role for glutamate, nor more general underlying neurobiological mechanisms, of enduring antidepressant effects of psychedelics have been empirically studied in humans. The current study utilized proton magnetic resonance spectroscopy at 7T to test the hypothesis that cortical glutamate concentrations would change after psilocybin administration in a cohort of patients with major depressive disorder (MDD).Methods
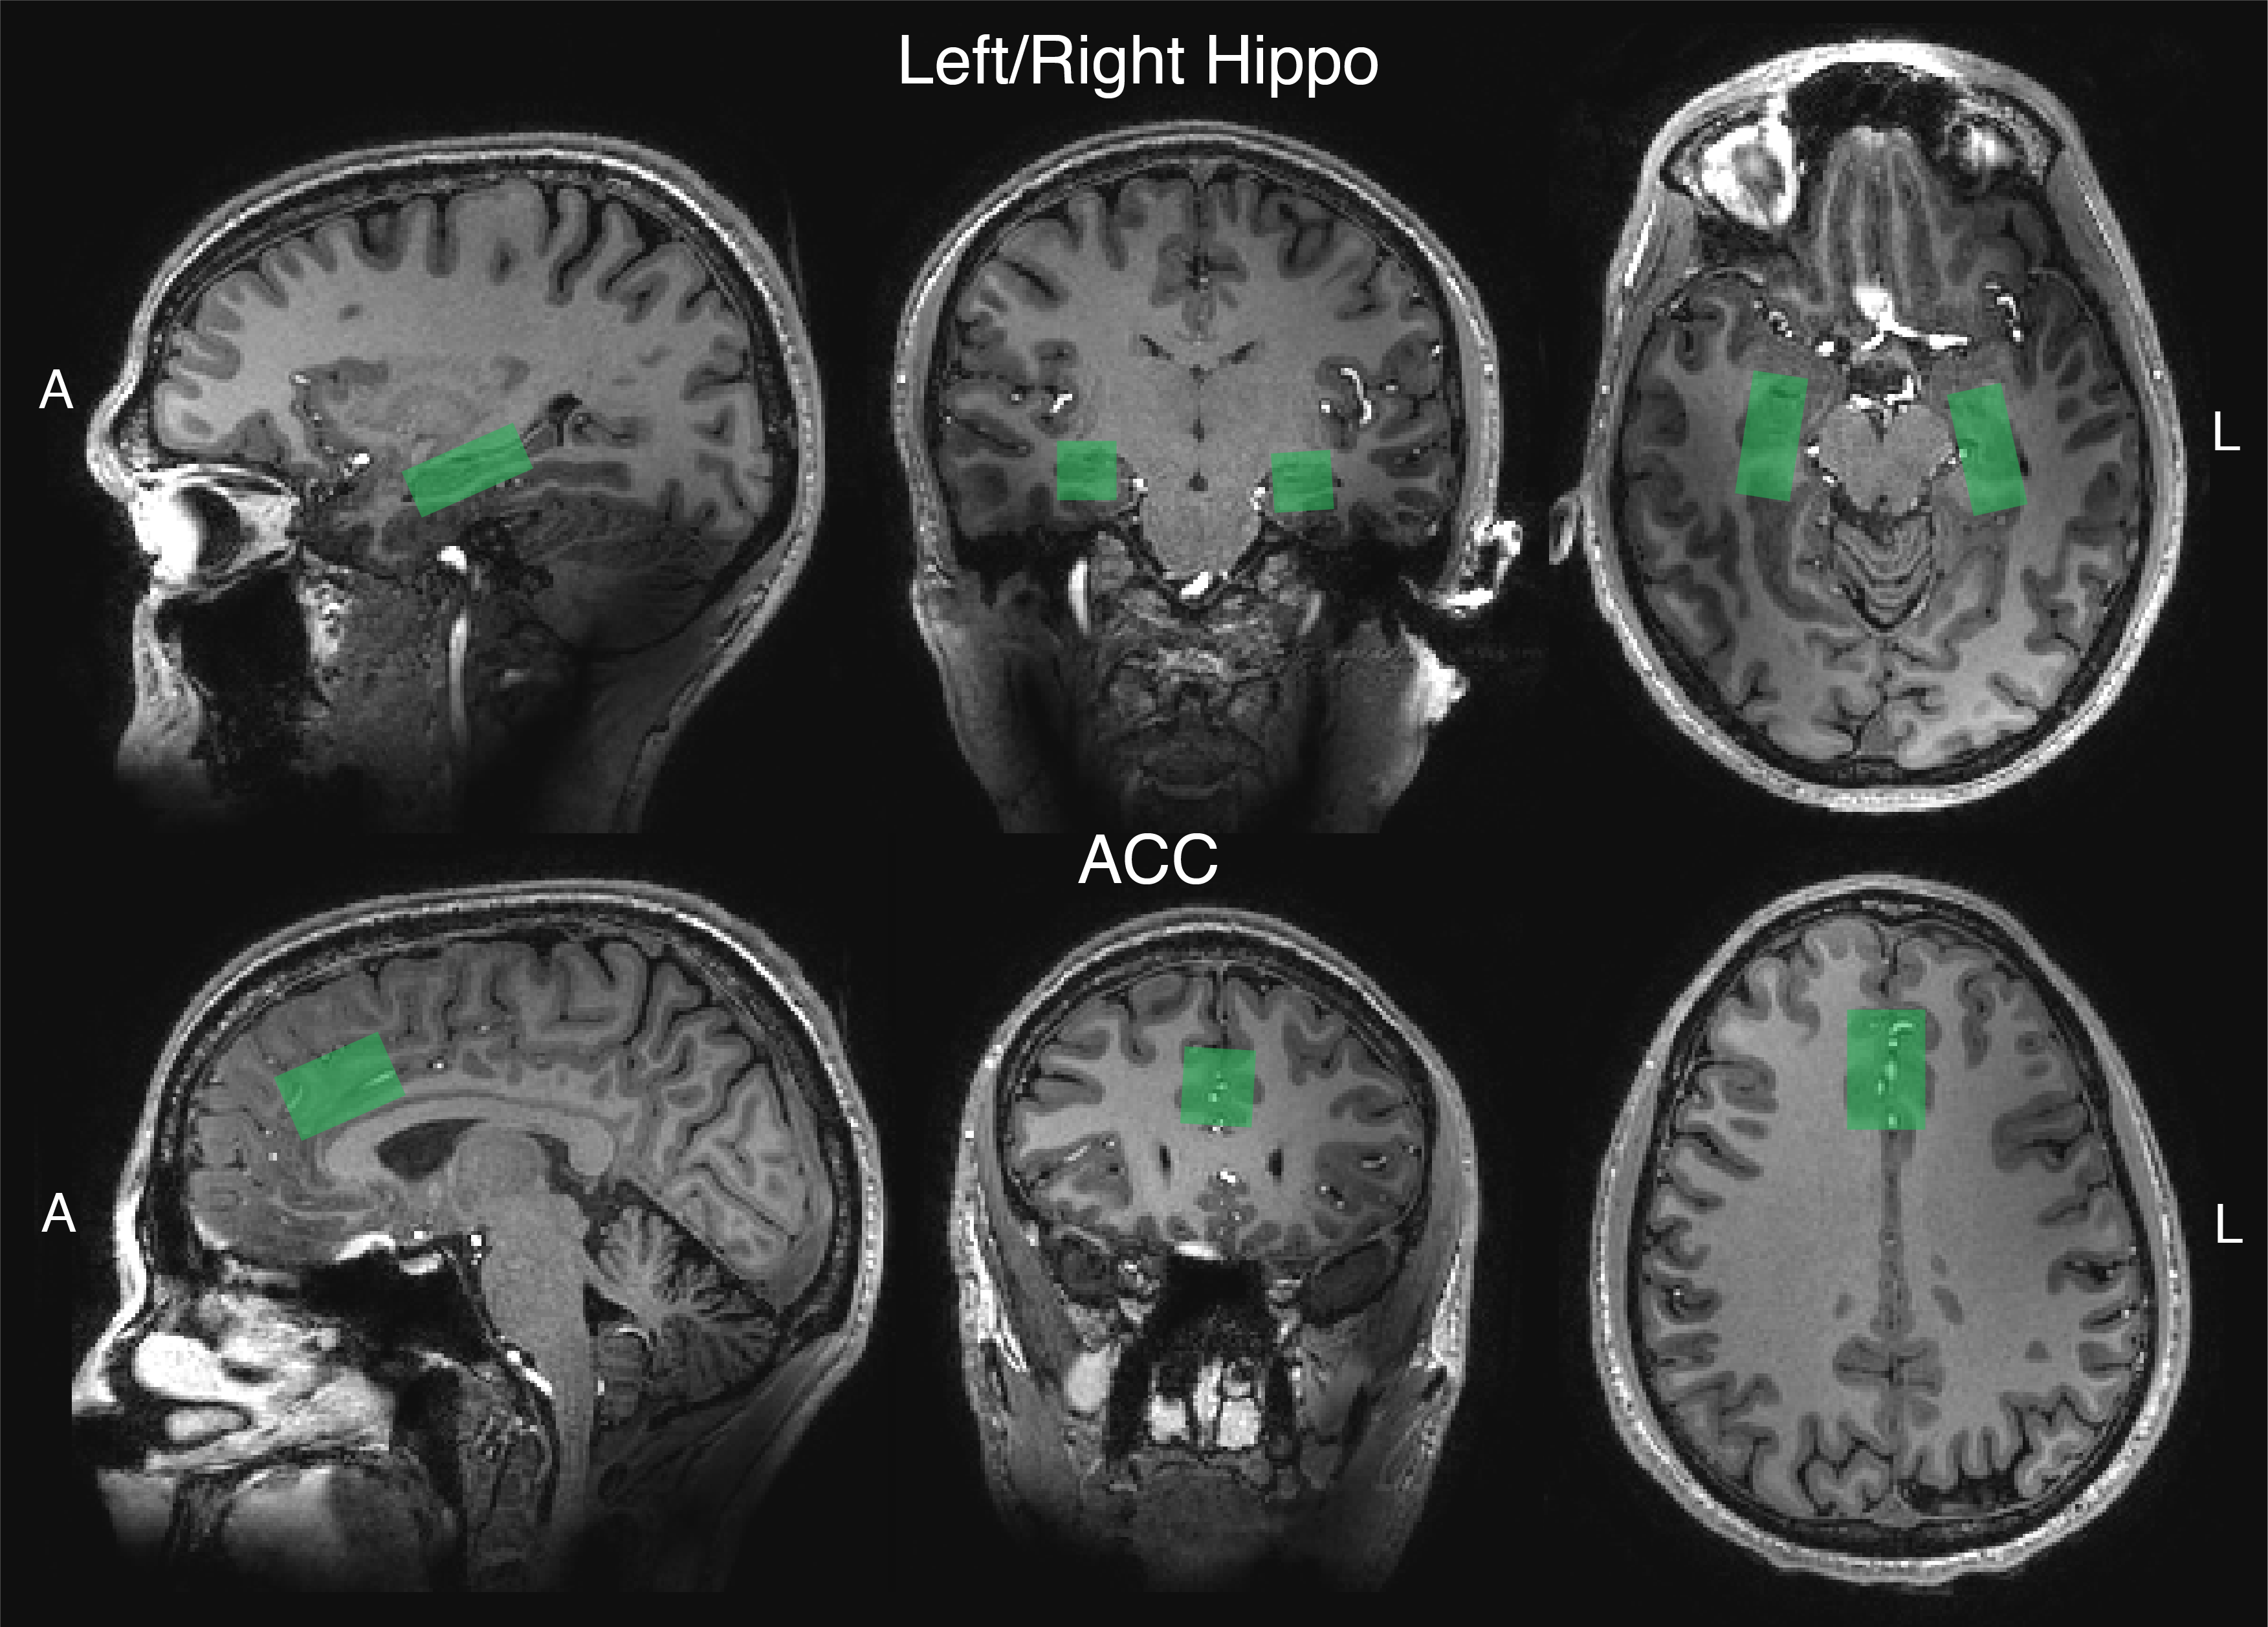
In a randomized, waitlist-controlled trial (ClinicalTrials.gov: NCT03181529), 24 patients diagnosed with MDD (16F/8M; mean age=40 [range=20-59]) completed two psilocybin administration sessions (20mg/70kg and 30mg/70kg; separated by approximately 2 weeks), under psychologically supportive conditions. Three weeks prior to the first session (pre-psilocybin) and one week after the second session (post-psilocybin), patients completed 1H-MRS scans on a 7 T Philips Achieva MR system with dual-transmit 32-channel receive array head coil using a short-TE STEAM sequence (TE/TR = 14ms/3s; NT = 128; bandwidth = 5000Hz; VAPOR water suppression). Water-unsuppressed spectra were acquired with similar parameters and NT=2. Separate measurements were made in three voxels (Fig.1): anterior cingulate (ACC; 30x20x20mm3), and left and right hippocampus (35x15x15mm3). Spectra were pre-processed using an in-house developed software based on FID-A8 and quantified with LCModel 6.39 modeling the spectrum from 0.5 to 4.2 ppm. Basis sets consisted of 20 metabolites generated using custom-built fully localized density matrix simulations10. Macromolecules were simulated in LCModel (NSIMUL=12). Signal of total creatine was used as an internal standard. The ratios of glutamate to creatine and NAA to creatine were compared between time points using paired T tests.Results
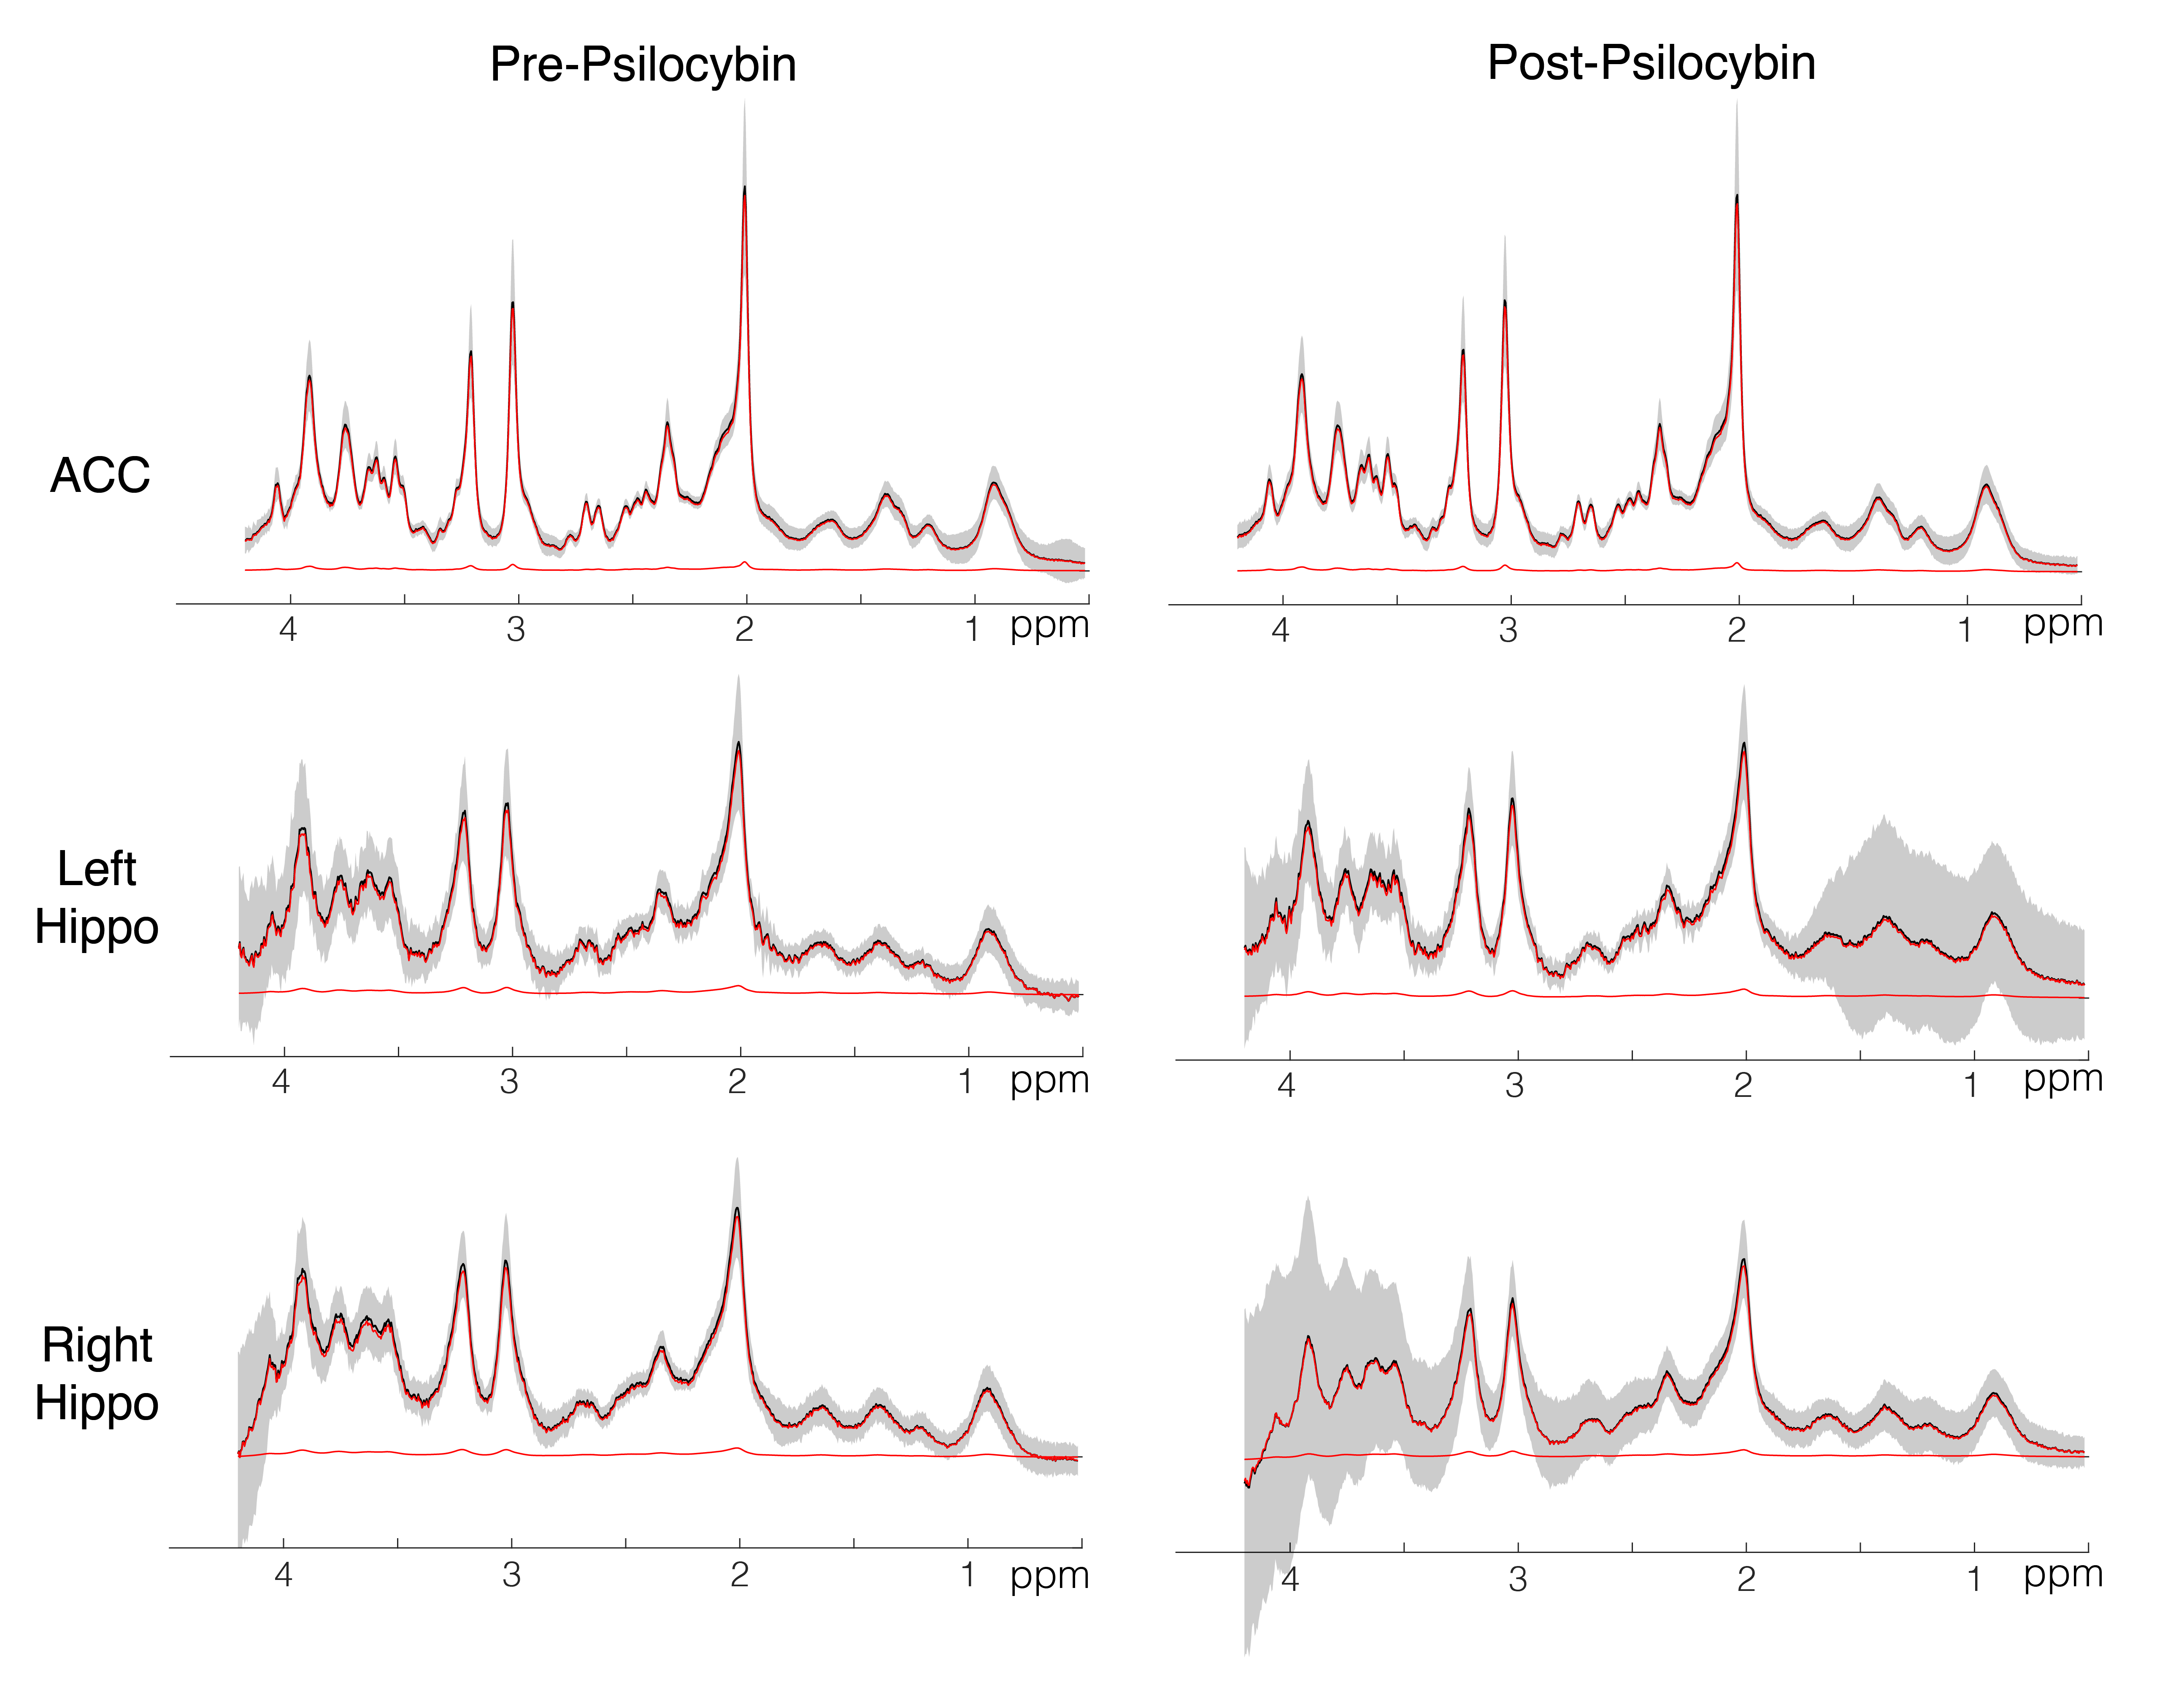
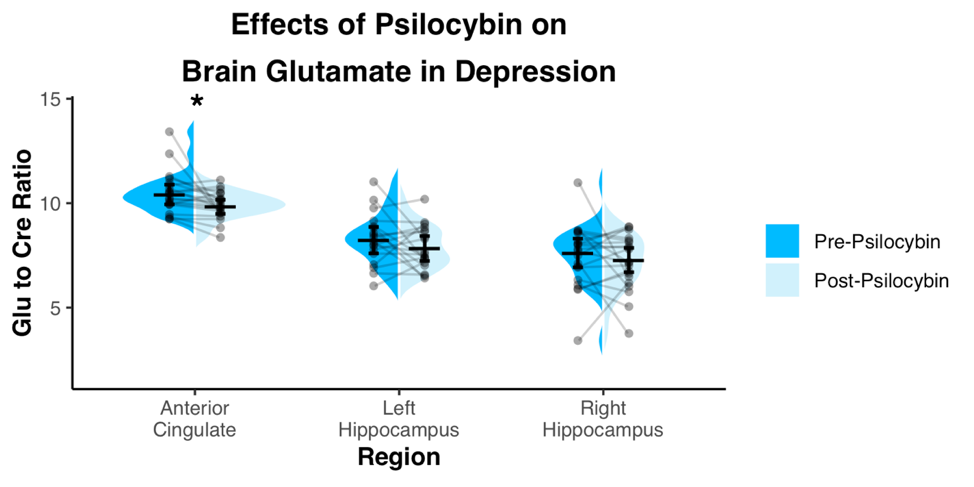
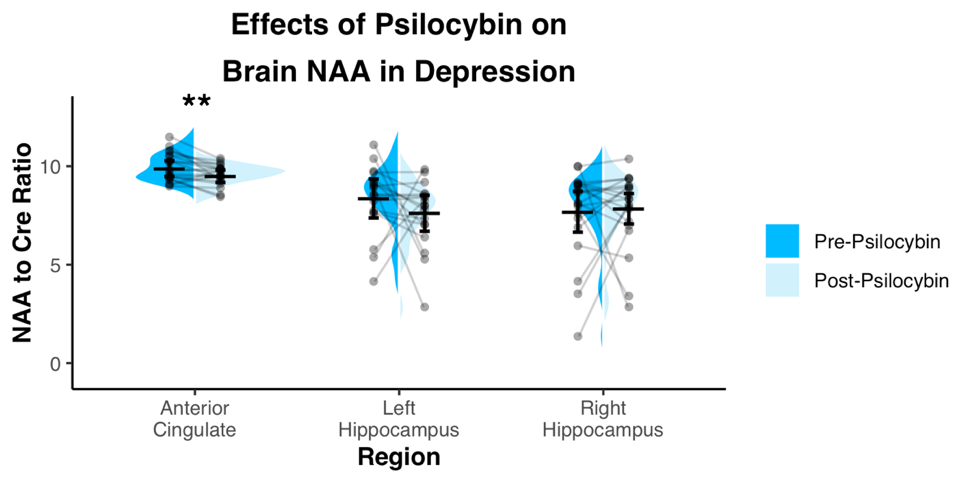
Spectra showed overall good spectral quality with mean CRLBs[%] of 3.9(NAA), 4.6(Glutamate), 2.9(total creatine), 6.7(total Choline) and 5.9(myo-inositol). However, spectra from left/right hippocampus showed higher variability especially in the 4-3 ppm region (Fig.2). Two datasets were excluded from further analysis due to low SNR. One week after the second psilocybin session, patients with depression had decreased glutamate (t(19) = 2.50, p = .022, d = .56) and N-acetylaspartate (t(19) = 3.14, p = .005, d = .70) metabolite levels compared to baseline (Fig.3 and 4) in the anterior cingulate. No differences in metabolite levels were found between pre- and post-psilocybin treatment in the left or right hippocampus (all ts < 1.25, all ps > .200). Improvements in depression, as measured by the Hamilton Depression Rating Scale, were observed one week after the second psilocybin session(t(19) = 11.54, p < .001, d = 2.58).Discussion
Two high dose sessions of psilocybin decreased glutamate and NAA levels of the anterior cingulate in patients with depression. This particular region of the anterior cingulate is a hub of the salience network, a network known to be dysfunctional in depression and predictive of clinical response to antidepressants11. Glutamate and NAA levels have been found to be related in the past12 and are thought to reflect neuronal metabolism. Prior studies of neuroleptics in other conditions such as schizophrenia have also been reported to lower brain glutamate levels13.Conclusion
Reductions in markers of neuronal metabolism in the anterior cingulate may be a novel marker of improvements in depression, but may also be a ‘side effect’ of psilocybin treatment, as patients with depression tend to have reduced neuronal function in this region. Future work will be needed to see if this reduction modulates other neural changes that may be relevant to improving depressive symptomology.Acknowledgements
No acknowledgement found.References
1. Carhart-Harris RL, Nutt DJ. Question-based Drug Development for psilocybin - Authors’ reply. Lancet Psychiatry 2016;3(9):807.
2. Griffiths RR, Johnson MW, Carducci MA, et al. Psilocybin produces substantial and sustained decreases in depression and anxiety in patients with life-threatening cancer: A randomized double-blind trial. J Psychopharmacol (Oxford) 2016;30(12):1181–97.
3. Ross S, Bossis A, Guss J, et al. Rapid and sustained symptom reduction following psilocybin treatment for anxiety and depression in patients with life-threatening cancer: a randomized controlled trial. J Psychopharmacol (Oxford) 2016;30(12):1165–80.
4. Sanacora G, Zarate CA, Krystal JH, Manji HK. Targeting the glutamatergic system to develop novel, improved therapeutics for mood disorders. Nat Rev Drug Discov 2008;7(5):426–37.
5. Zanos P, Thompson SM, Duman RS, Zarate CA, Gould TD. Convergent Mechanisms Underlying Rapid Antidepressant Action. CNS Drugs 2018;32(3):197–227.
6. Moriguchi S, Takamiya A, Noda Y, et al. Glutamatergic neurometabolite levels in major depressive disorder: a systematic review and meta-analysis of proton magnetic resonance spectroscopy studies. Mol Psychiatry 2019;24(7):952–64.
7. Vollenweider FX, Kometer M. The neurobiology of psychedelic drugs: implications for the treatment of mood disorders. Nat Rev Neurosci 2010;11(9):642–51.
8. Simpson, R., Devenyi, G. A., Jezzard, P., Hennessy, T. J. & Near, J. Advanced processing and simulation of MRS data using the FID appliance (FID-A) - An open source, MATLAB-based toolkit. Magn. Reson. Med. 77, 23–33 (2017).
9. Provencher, S. W. Automatic quantitation of localized in vivo 1H spectra with LCModel. NMR Biomed. 14, 260–4 (2001).
10. Berrington, A. et al. Improved localisation for 2-hydroxyglutarate detection at 3T using long-TE semi-LASER. Tomogr. a J. imaging Res. 2, 94–105 (2016).
11. Sikora M, Heffernan J, Avery ET, Mickey BJ, Zubieta J-K, Peciña M. Salience Network Functional Connectivity Predicts Placebo Effects in Major Depression. Biological Psychiatry: Cognitive Neuroscience and Neuroimaging 2016;1(1):68–76.
12. Petroff OA, Errante LD, Rothman DL, Kim JH, Spencer DD. Ann Neurol. 2002 Nov;52(5):635-42
13. Marsman A, van den Heuvel MP, Klomp DW, Kahn RS, Luijten PR, Hulshoff Pol HE. Schizophr Bull. 2013 Jan;39(1):120-9.
Figures