1978
Dynamic Sliding-Window MRS Method for Measuring Changes in Glutamate and GABA in Patients with Major Depressive Disorder1Mayo Clinic, Rochester, MN, United States, 2Department of Psychiatry, Mayo Clinic, Rochester, MN, United States
Synopsis
We have developed a method of optimally frequency/phase adjusting individual FIDS of an MRS acquisition such that patient motion and scanner artifacts can be eliminated from long MRS acquisitions. This method uses MRS peak symmetry in order to optimally phase the Cho and Cr peaks acquired using a frequency-locked MEGA-PRESS sequence. We tested our method subjects receiving an IV ketamine infusion for MDD and noticed dramatic changes in GABA and Glx levels in one subject. Our method allows for dynamic MRS studies that can measure neurotransmitter changes over time.
Introduction
Major depressive disorder (MDD) affects one in four people1. Ketamine infusions have recently been shown to relieve symptoms in treatment-resistant MDD patients. The effect(s) of ketamine on brain glutamate and GABA levels has only recently been studied2.Several challenges have limited these studies. For the MEGA-PRESS sequence, scanner B0 drift over time and patient motion artifacts cause the saturation pulse to move off the C3 GABA resonance at 1.89 ppm, leading to incomplete saturation/spurious GABA measurements. As such, dynamic studies of glutamate and GABA to date have been limited to a series of short separate MRS acquisitions.
The purposes of this study were to 1) develop a robust, artifact-resistant MEGA-PRESS analysis pipeline that overcomes these limitations, and 2) use the pipeline to detect glutamate and GABA changes during a ketamine infusion.
Method
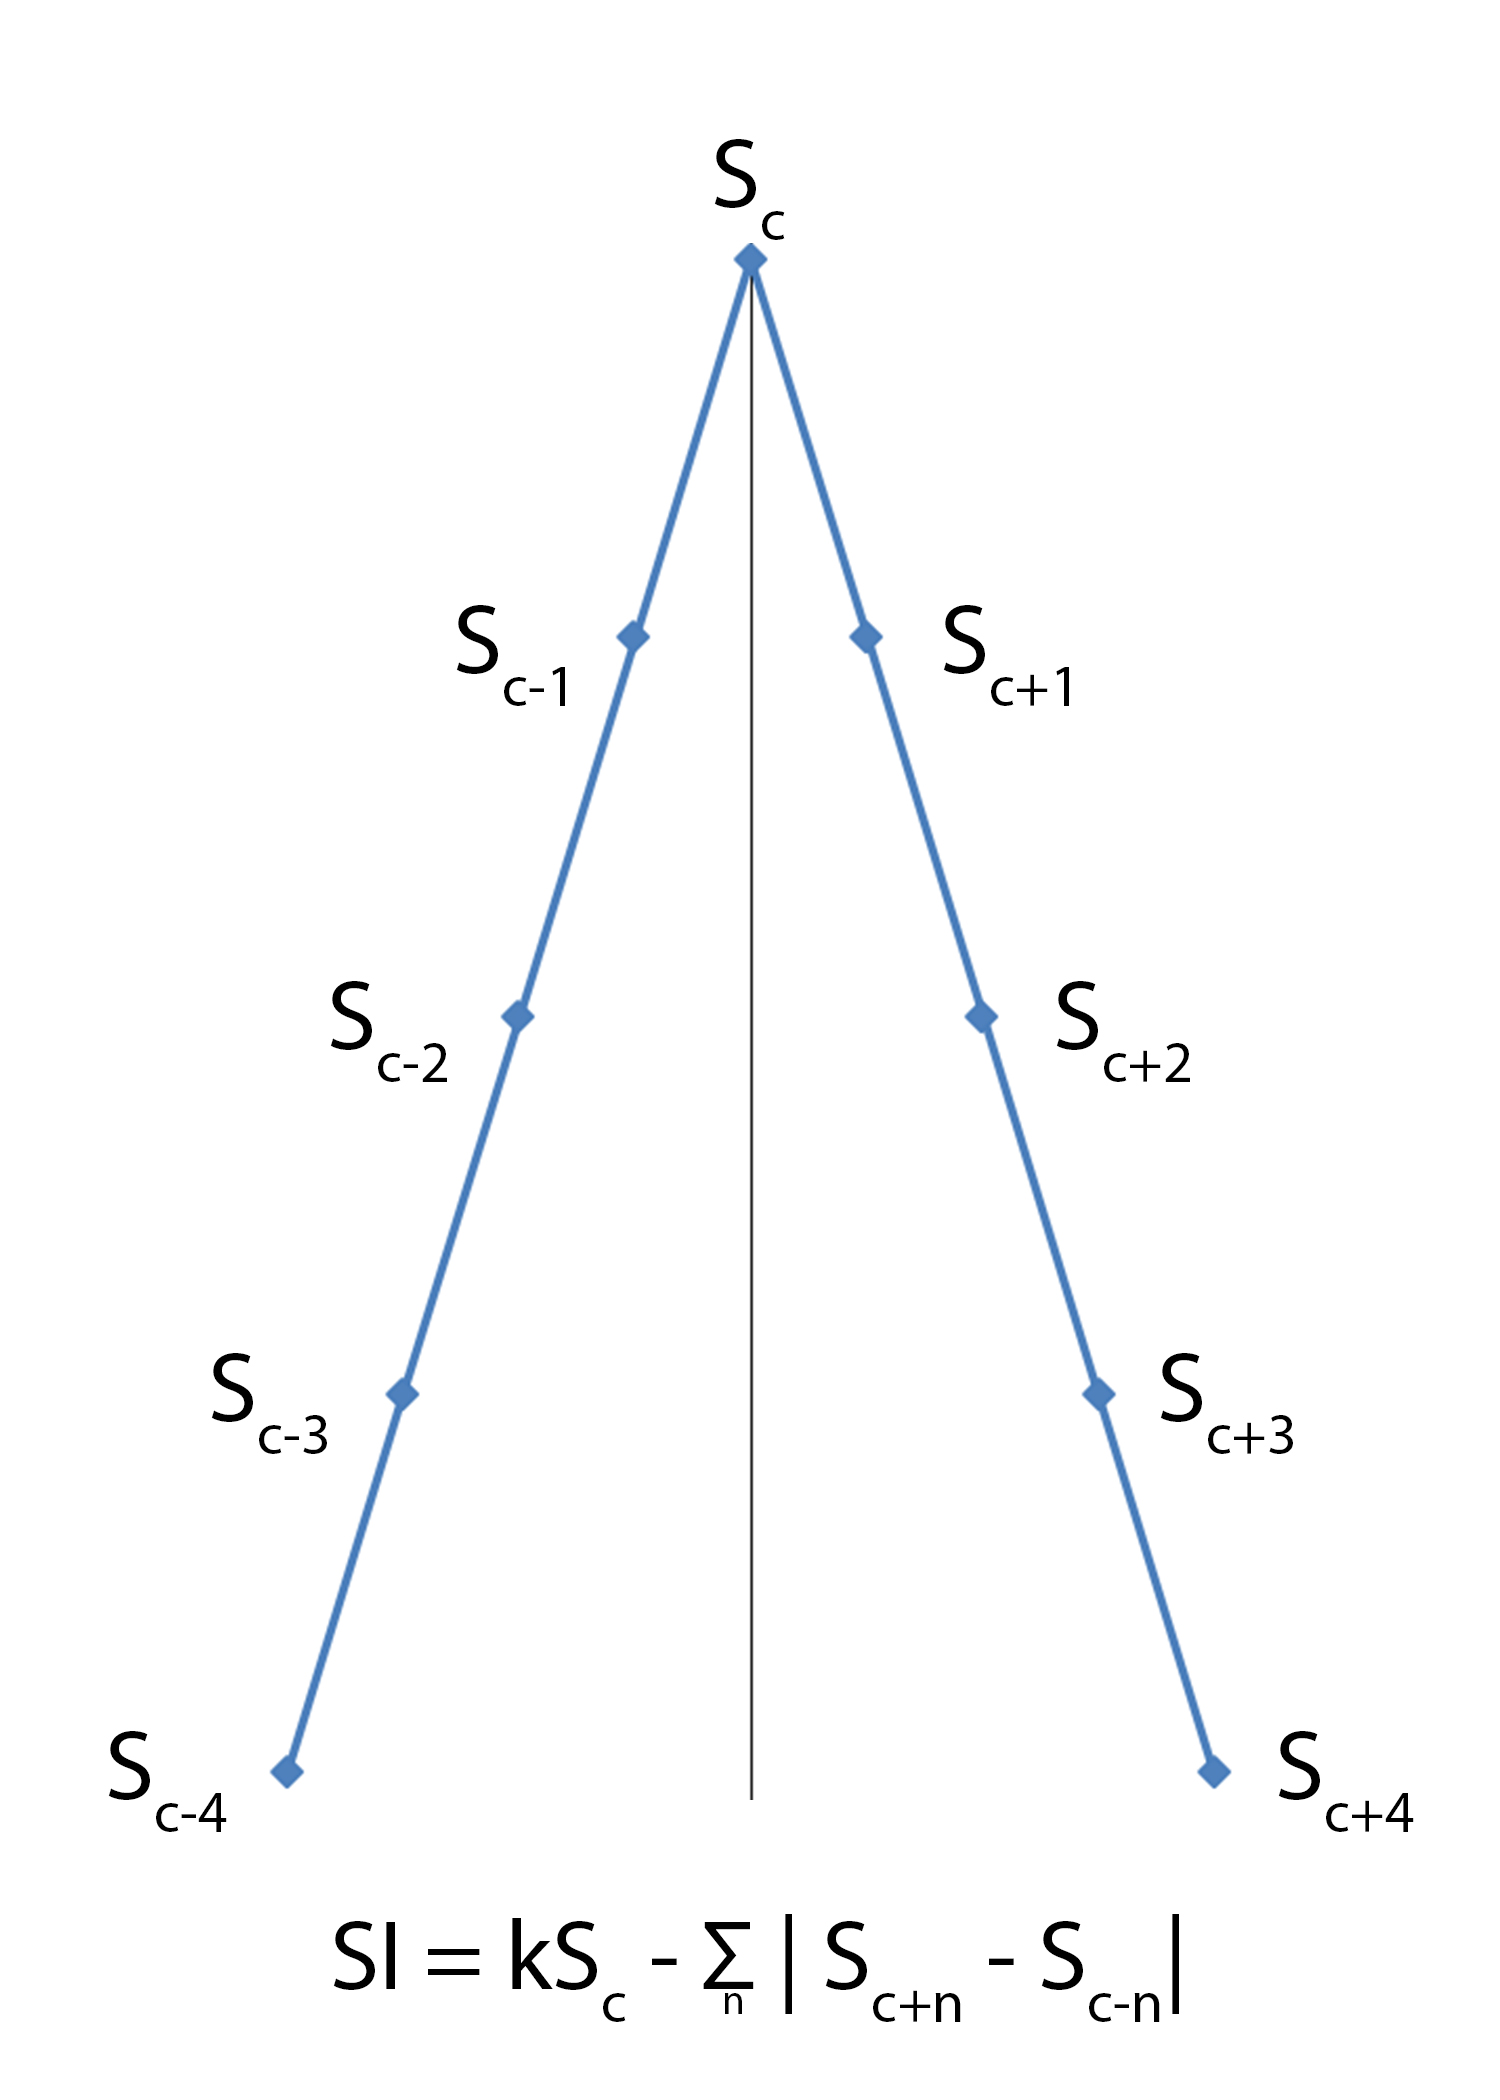
This study was conducted with approval from our institutional review board (IRB #17-011373). All subjects provided written informed consent. A Siemens 3T Prisma MEGA-PRESS (Siemens WIP 859G running on VE11C) sequence was used to acquire data from a 3.0cm SI x 3.0cm RL x 2.5cm AP MRS voxel placed in the midline, centered on the pregenual anterior cingulate cortex (TR=2000ms, TE=68ms, BW=5000Hz, pts=2048, OnSat=1.9ppm, OffSat=7.5ppm, CHESS water suppression, 32-channel head coil). This sequence dynamically adjusts the center frequency of water to keep the saturation pulse properly centered. A total of 795 MEGA-PRESS ON-OFF pairs were acquired continuously over a 53 minute time period. At 13 minutes into the acquisition, a 40-minute long IV infusion of ketamine was started. A short water-reference scan (16 ON-OFF pairs) was acquired before the main sequence.Water-saturated and water-reference data were split into ON FIDs and OFF FIDs. Each individual FID was then frequency and phase adjusted by iterating through frequency (-10 to 10 Hz in 1 Hz increments) and phase (-pi to pi in pi/90 increments) space. The adjusted FID was Fourier-transformed, and separate Symmetry Indexes (SI) (Figure 1) were computed for the choline (Cho) and creatine (Cr) peaks. The Cho and Cr SI for each point in frequency/phase space were combined by first normalizing the SI in each frequency/phase space to the maximum SI for that space, then adding them up. Finally, the combined SI data were evaluated to determine the best frequency and phase values for that FID, and the FID adjusted with those values.
Following frequency and phase correction, sliding window analysis was performed on the data. A time window 13 minutes (195 ON-OFF pairs) long per Brix3 was slid across the data set in increments of one minute (15 ON-OFF pairs). The corrected ON and OFF FIDS in the window were separately averaged together. The DIFFERENCE FID was then computed as the ON FID minus the OFF FID. The 41 OFF and DIFFERENCE FIDS were then processed using LCModel4 to create a total of 41 consecutive datasets from which GABA and Glu could be plotted as a function of time. All metabolite data were water-scaled.
Results
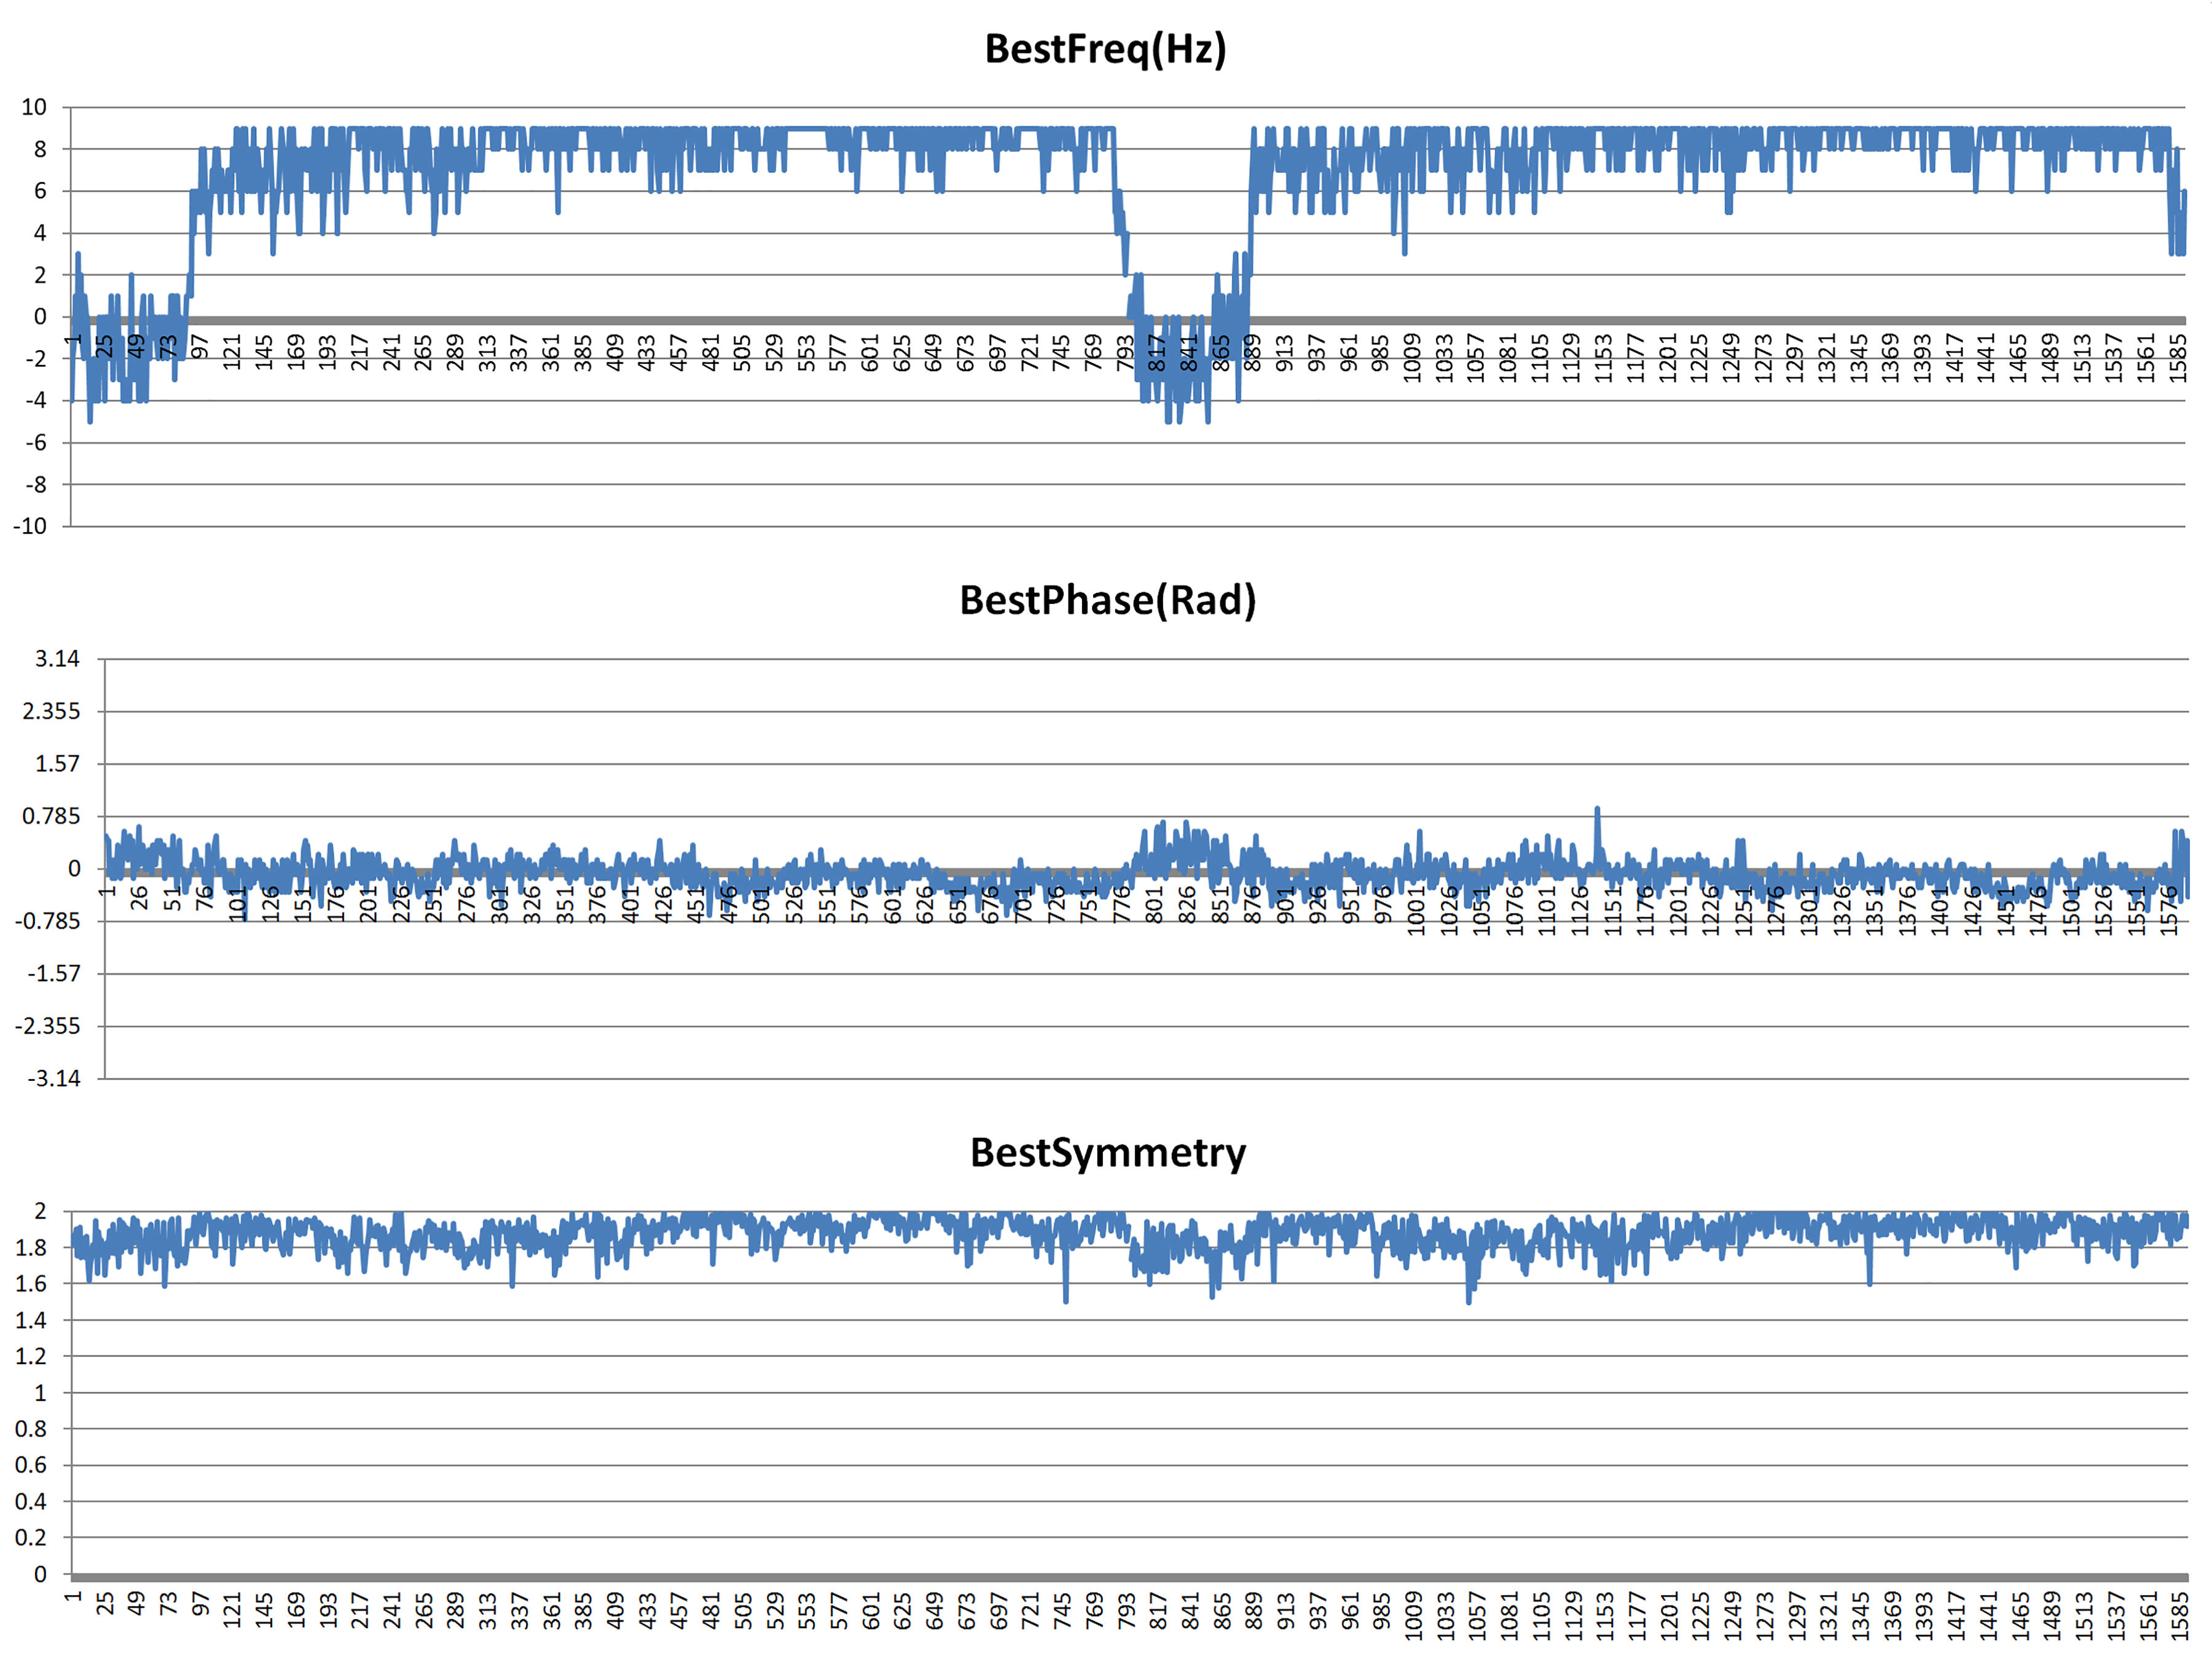
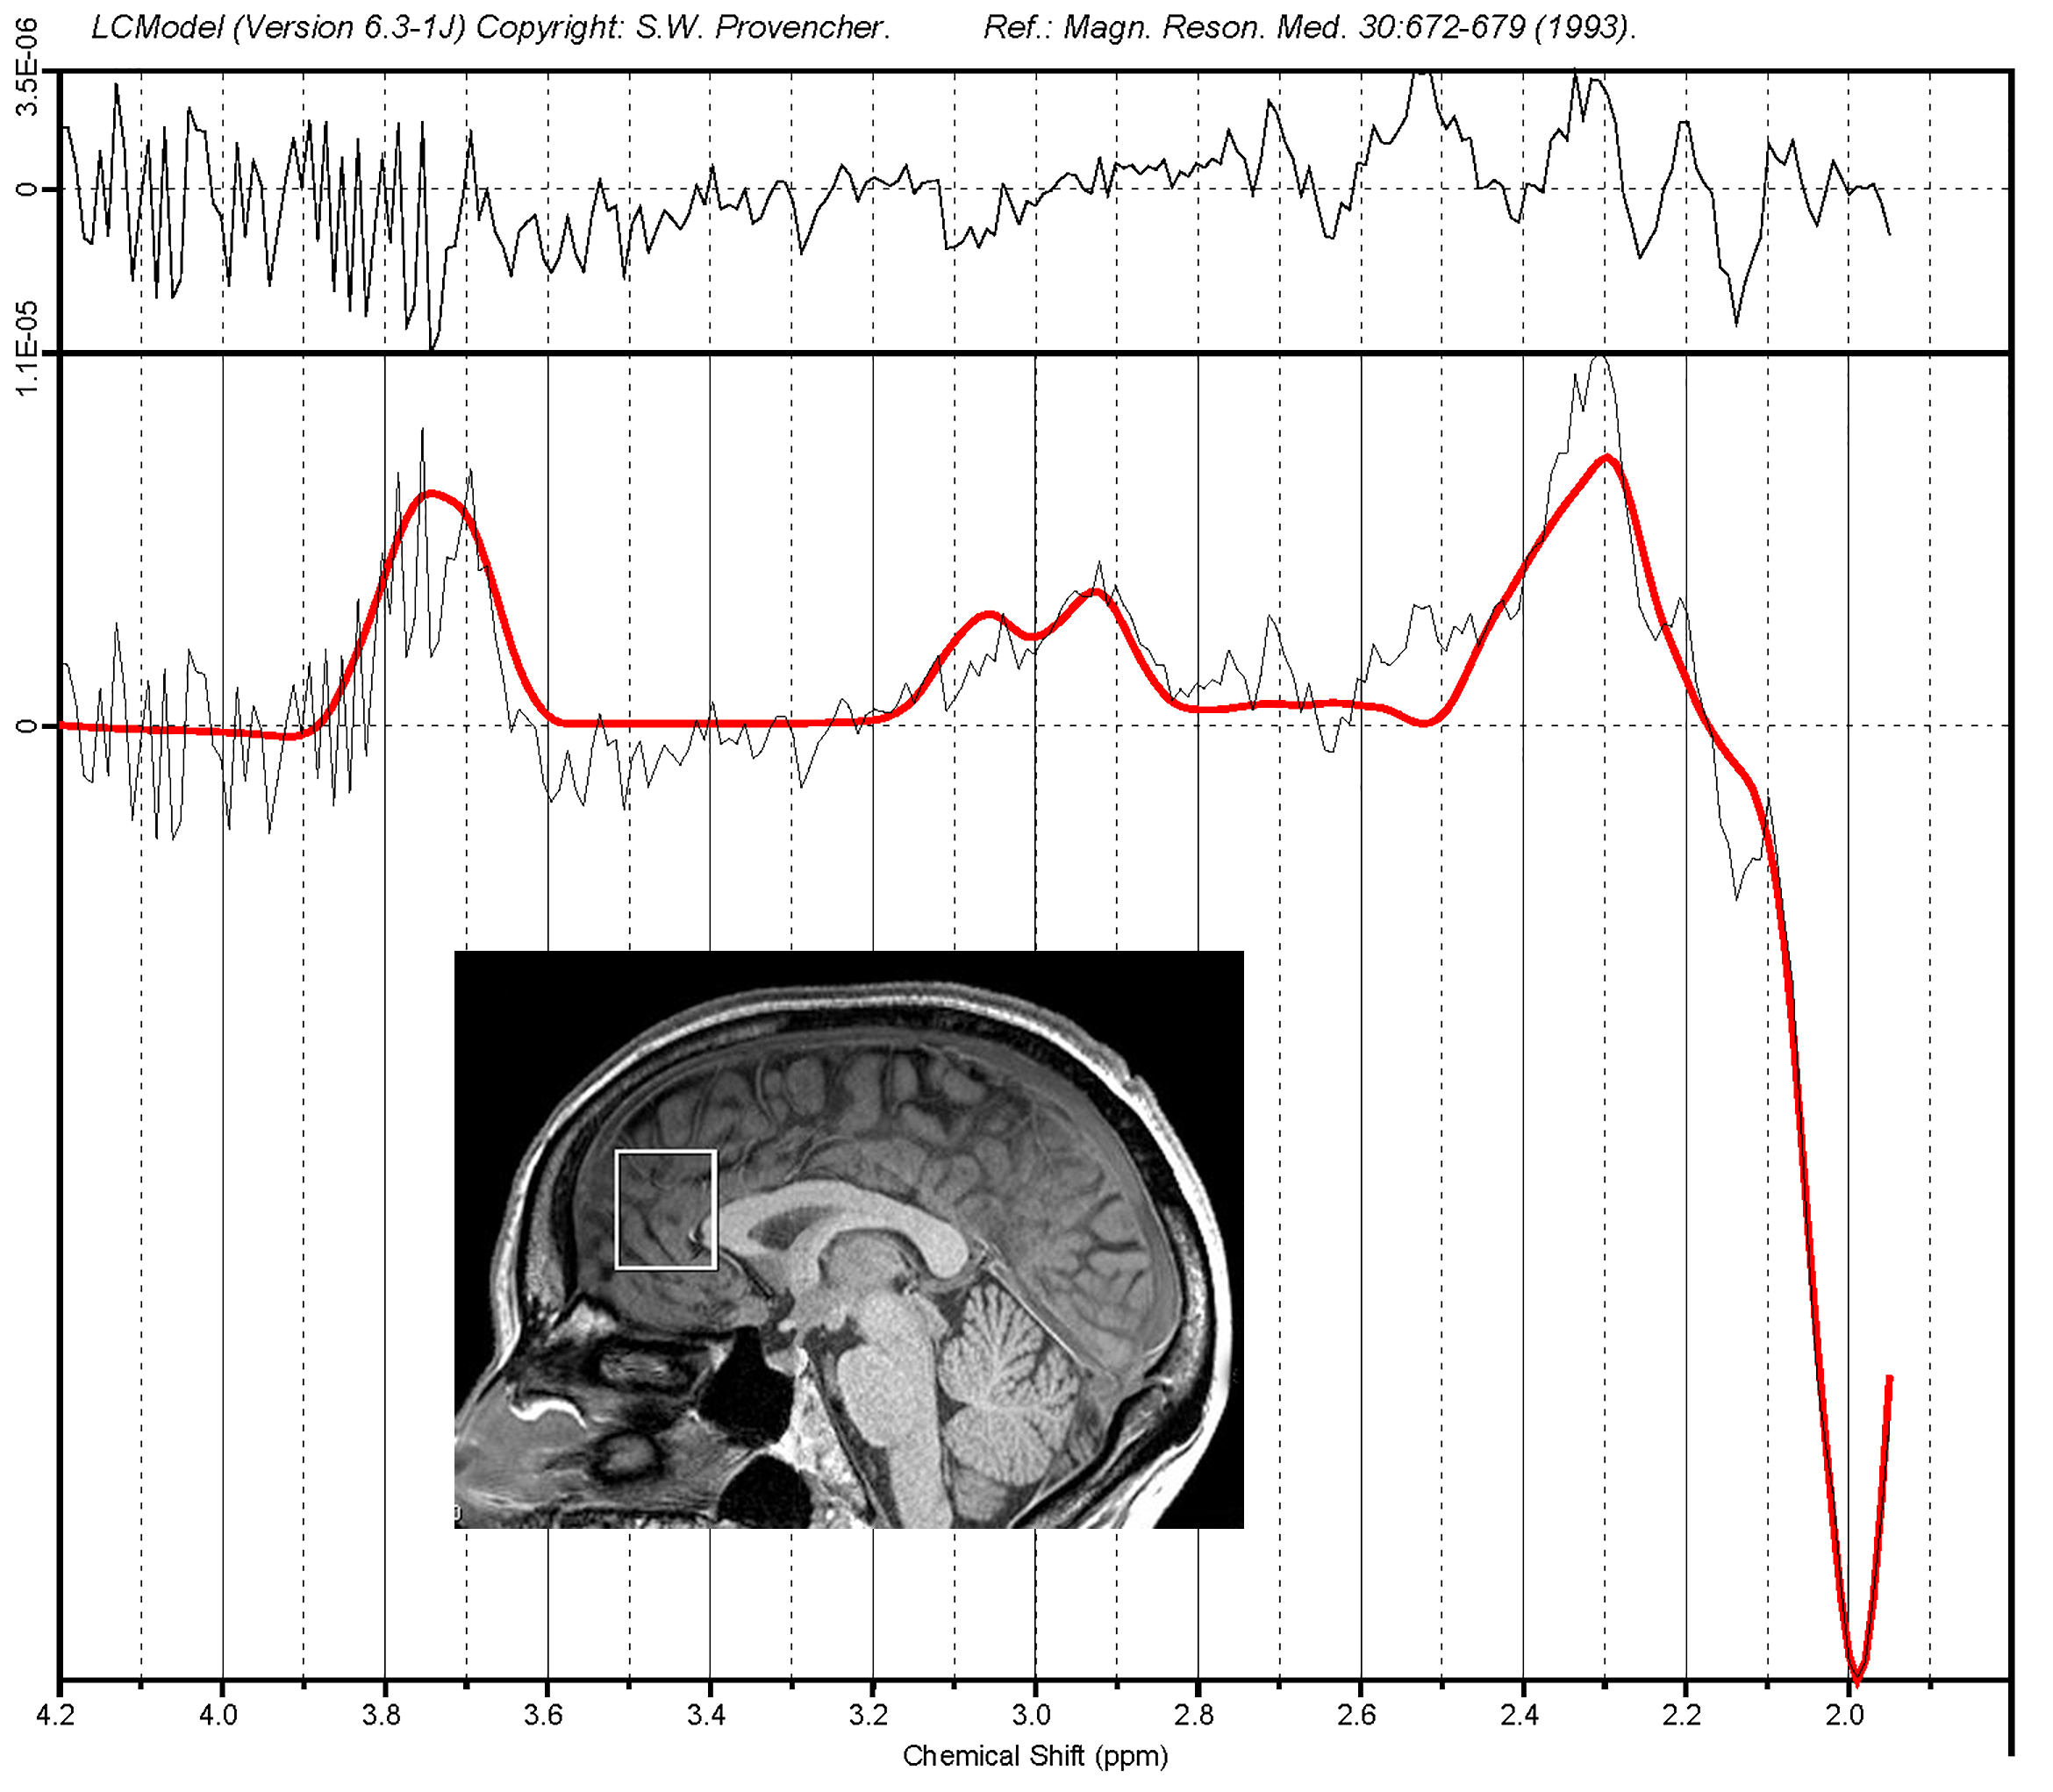
Figure 2 demonstrates the best frequency and phase corrections used for each of the 1590 FIDS in order to obtain the highest peak SI value. Note the rather large swings in frequency and smaller adjustments in phase, compared to the relatively stable peak SI values.Figure 3 shows a typical difference spectrum obtained from the midline anterior cingulate cortex computed from a 13-minute wide sliding window in Subject D. The shim on this scan was marginal due to the large size of the voxel and the adjacency to the patient’s frontal and ethmoid sinuses.
Table 1 shows the data evaluating the selection of the best a priori knowledge parameters. The center of the Cho peak was set at 3.200 ppm and the Cr peak center selected to be “delta ppm” to the right. The mean FWHM, SNR and various LCModel CRLB values were computed for each of the 795 ON-OFF pairs for the various Cr peak positions. Per Govindaraju5 the theoretical difference between the centers of the Cho and Cr peaks is 0.158 ppm (green box). Interestingly, the lowest CRLB for GABA, Glx and NAA+NAAG in the DIFFERENCE spectrum were obtained using this theoretical shift, whereas the best SI was obtained using a Cho-Cr separation of 0.178 ppm.
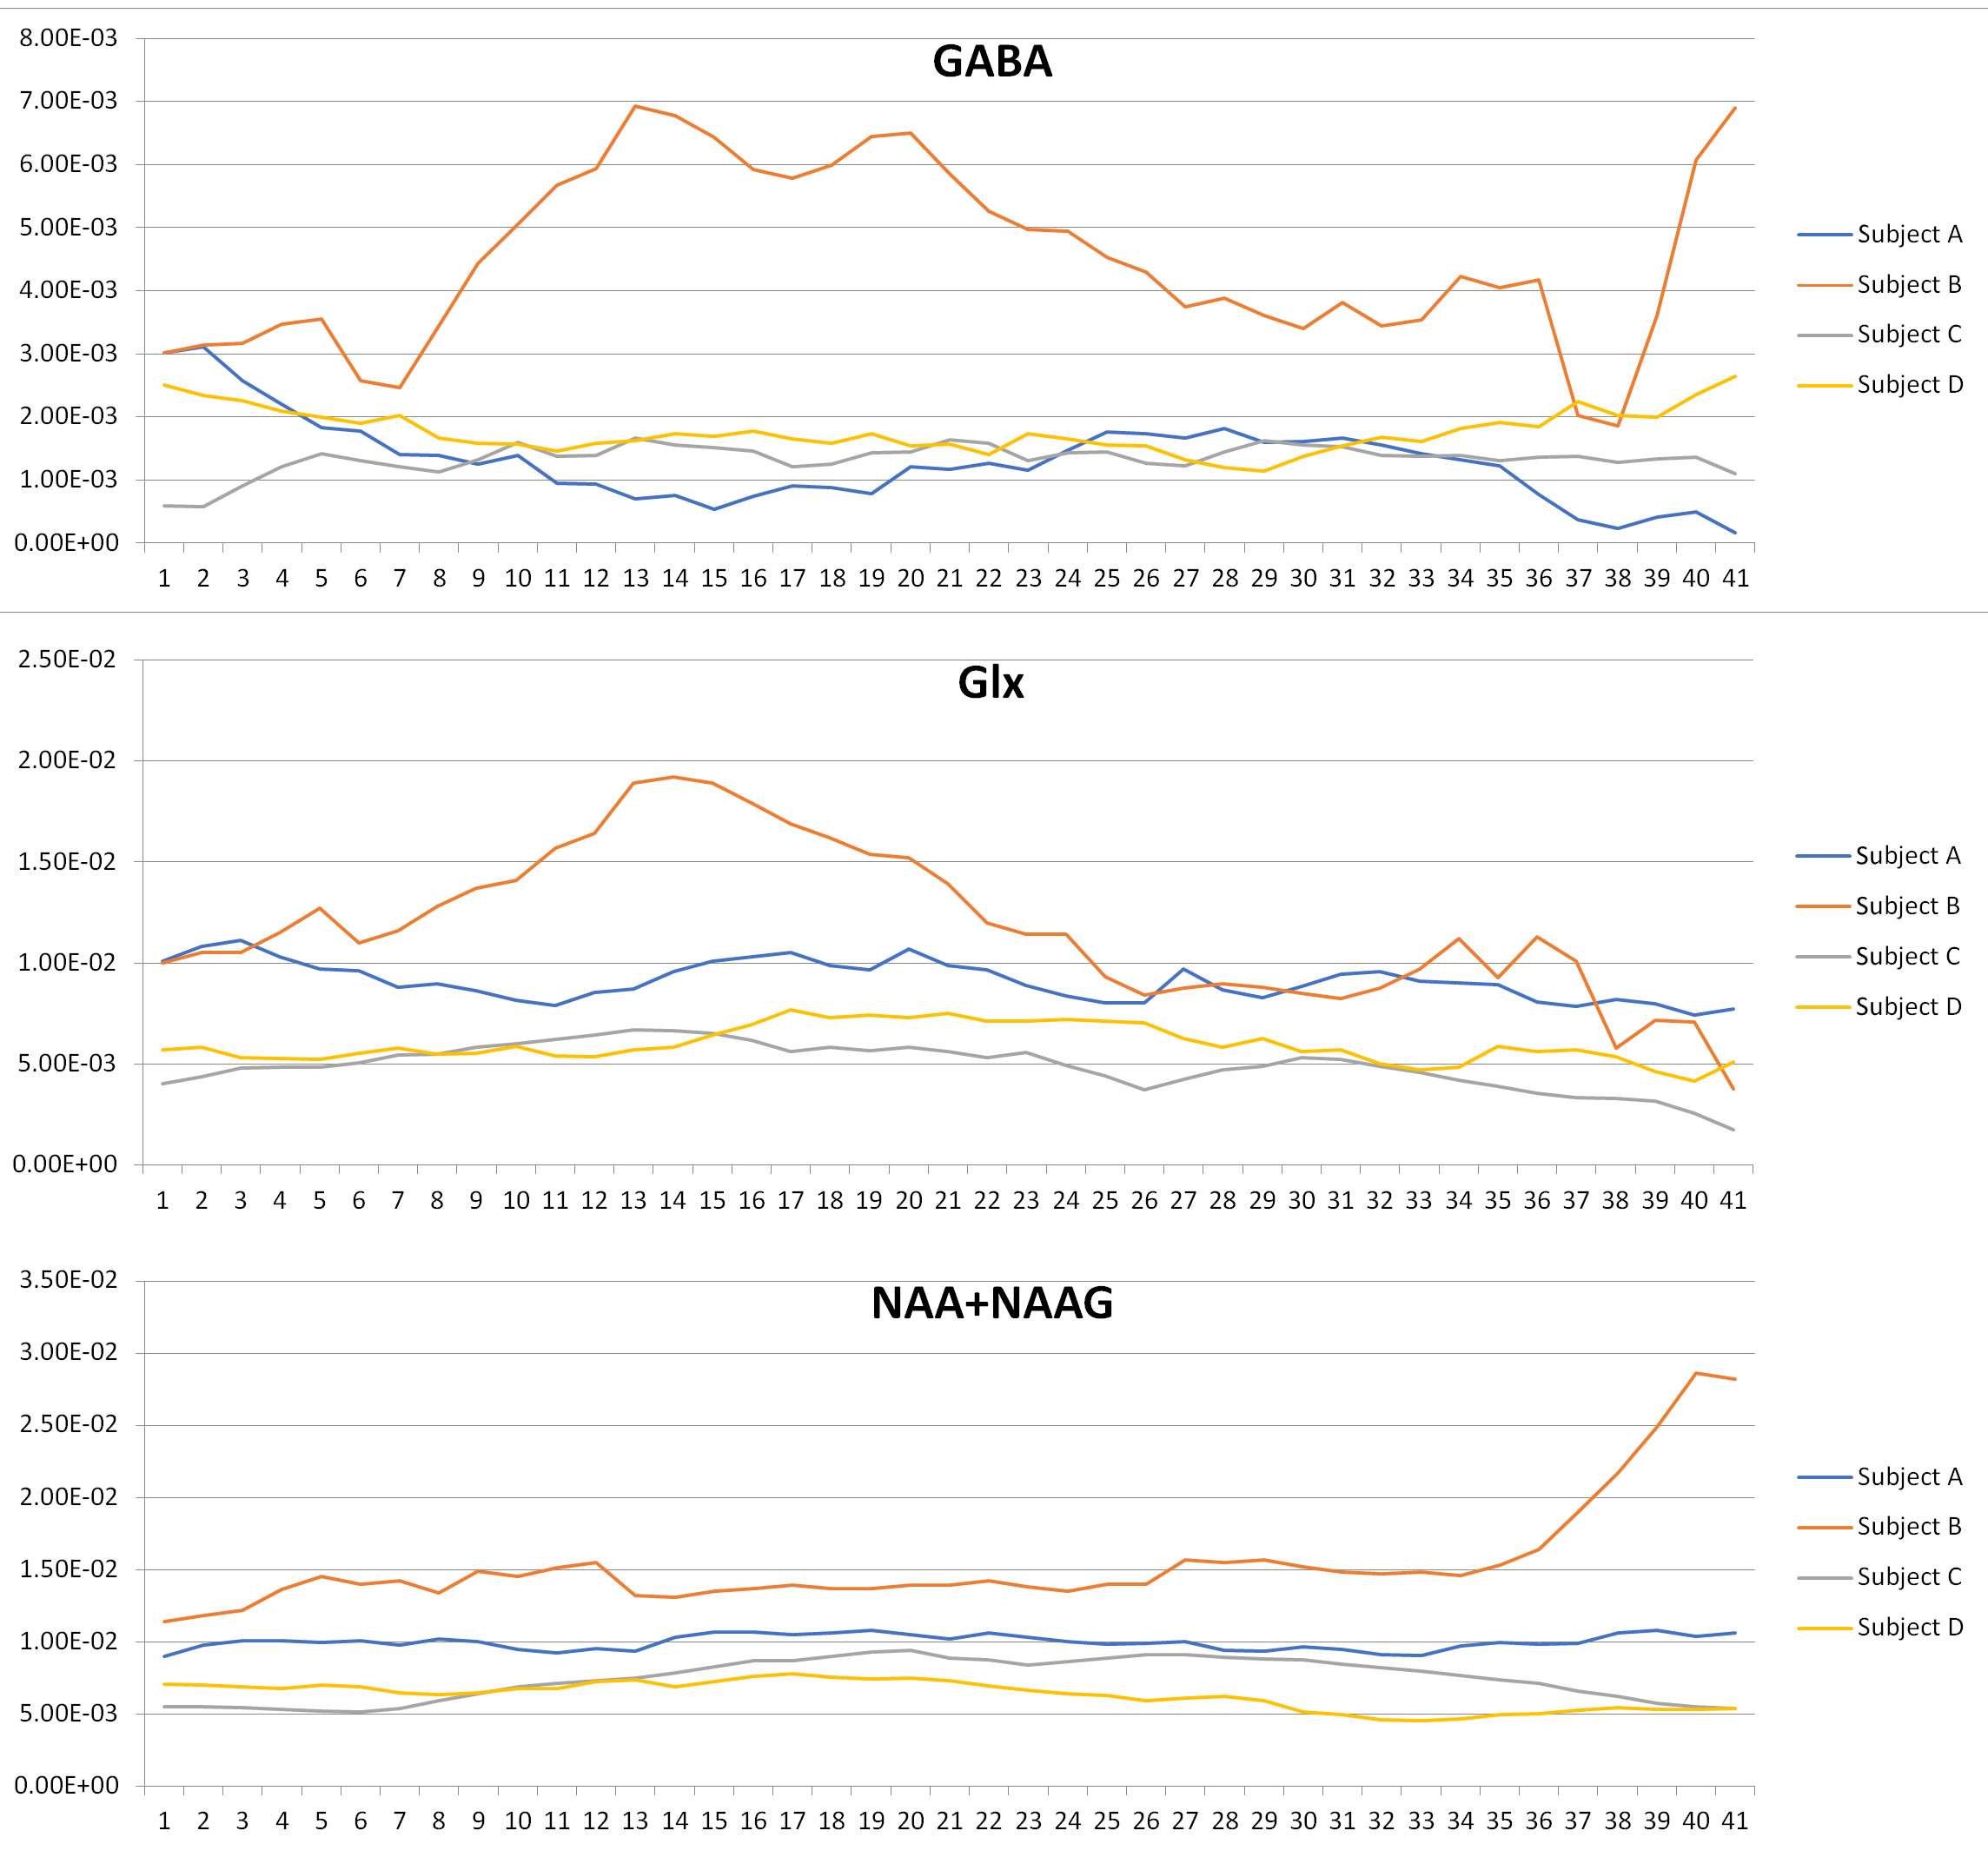
Figure 4 shows the GABA, Glx and NAA+NAAG values obtained from the DIFF spectrum from four subjects during their ketamine infusions. Note that Subjects A, C and D show relatively little change following ketamine infusion, while Subject B has dramatic changes in GABA and Glx following ketamine infusion.
Discussion
The combination of sequence frequency-locking to water and using peak symmetry to frequency and phase adjust individual FIDS in long MEGA-PRESS acquisitions appears to have overcome the challenging issues that previously limited dynamic applications of MEGA-PRESS. The SI technique is able to correct for patient motion and scanner drift artifacts despite relatively noisy individual FIDS.Conclusion
This new method of acquiring and post-processing dynamic GABA and Glx data can now be used to study patients over long periods of time, opening up the possibility of drug response trials that can measure acute changes in neurotransmitters as a drug is infused into the patient.Acknowledgements
No acknowledgement found.References
1. World Health Organization. Global Burden of Disease. Geneva, Switzerland: World Health Organization; 2002.
2. Milak MS, Proper CJ, Mulhern ST et al. A pilot in vivo proton magnetic resonance spectroscopy study of amino acid neurotransmitter response to ketamine treatment of major depressive disorder. Mol. Psychiatry 2016; 21:320-327
3. Brix MK, Ersland L, Hugdahl K et al. Within- and between-session reproducibility of GABA measurements with MR spectroscopy. JMRI 2016; 46:421-430
4. Provencher SW. Estimation of metabolite concentrations from localized in vivo proton NMR spectra. MRM 1993; 30:672-679
5. Govindaraju V, Young K and Maudsley AA. Proton NMR chemical shifts and coupling constants for brain metabolites. NMR Biomed 2000; 13:129-153
Figures