1977
Increased Connectivity Correlated to Severity of Autism in a Cohort of High Functioning Autism and Major Depressive Disorder1Biomedical Engineering, Stony Brook University, Stony Brook, NY, United States, 2Psychiatry, Stony Brook University, Stony Brook, NY, United States, 3Radiology, Stony Brook University, Stony Brook, NY, United States
Synopsis
This is the first study to investigate connectivity in a cohort of High Functioning Autism (HFA) and Major Depressive Disorder (MDD) subjects with comorbid autism. Using DSI studio for connectometry analysis, we investigated the relationship between Social Responsiveness Scale (SRS) scores and Spin Distribution Function (SDF) values derived from diffusion MRI images. Tractography based analysis showed corpus callosum, longitudinal fasciculus and corticothalamic pathways to have increased connectivity relating to SRS scores (FDR=0.011). Post hoc analysis showed trend-level partial correlation between SRS and SDF while controlling for IQ scores (p=0.056, r=0.480).
Introduction
Autism Spectrum Disorder (ASD) is a disorder with various forms; wherein High Functioning Autism (HFA) is one of which stifles patients with deficits in communication and social interaction, while maintaining high intellectually quotients (IQ). Interestingly, multiple studies have reported comorbidity between HFA and depression1-6. One study reported 70% of HFA subjects had experienced at least one episode of major depression, and 50% of the cohort had recurrent major depressions7. Recent analyses of ASD using diffusion tensor imaging (DTI) show decreased fractional anisotropy and increased mean diffusivity in white matter tracks in the corpus callosum, cingulum, temporal lobe and longitudinal fasciculus8-11. The directionality of these metrics indicates a reduced connectivity related to severity of disease. Given that ASD has a myriad of forms, we designed a first of kind analysis that studied a cohort of HFA and a comorbid group that elicited Major Depressive Disorder (MDD) and autistic symptoms (as rated by Social Responsiveness Scale [SRS-2]). In this study, we propose to investigate connectivity measured through diffusion MRI with a sample of 33 subjects, 18 HFA and 15 MDD.Methods
Study samples comprise two groups of adult males recruited from the same geographic region for participation in a simultaneous PET/MR brain scan study; one with HFA and one with MDD. The HFA sample comprised 18 males who met ADOS-212, Module 4 criteria for ASD and had KBIT-213, IQ Composite scores ≥80 (Mean=107.3; SD=16.0). The MDD sample comprised 15 adult males (18-45 years). All had a Structured Clinical Interview for DSM 5 diagnosis of MDD and scored 13 or higher on the Hamilton Depression Rating Scale (HDRS). Using DSI studio(http://dsi-studio.labsolver.org), a connectometry database was created using diffusion spectrum imaging (DSI) of all 33 subjects. The diffusion images were acquired on a Siemens Biograph mMR scanner using a diffusion sequence with TE=121.4 ms, TR=6300 ms, in-plane resolution = 2mm, slice thickness =2mm, multiband factor=2, a multishell diffusion scheme with b-values 1000 , 2000, 3000 and 4000 s/mm2; the number of diffusion sampling directions were 64, 32, 32, and 32, respectively. The diffusion data were reconstructed in the MNI space using q-space diffeomorphic reconstruction14 to obtain the spin distribution function (SDF)15. A diffusion sampling length ratio of 1.25 was used The restricted diffusion was quantified using restricted diffusion imaging16. The SDF values were used in the connectometry analysis.Diffusion MRI connectometry17 was used to study the effect of SRS-2 with a multiple regression model. A T-score threshold of 3 was assigned to select local connectomes, and the local connectomes were tracked using a deterministic fiber tracking algorithm18. Topology-informed pruning19 was conducted with 4 iterations to remove false connections. All tracks generated from bootstrap resampling were included. A length threshold of 20 voxel distance was used to select tracks. The seeding number for each permutation was 100000. To estimate the false discovery rate, a total of 2000 randomized permutations were applied to the group label to obtain the null distribution of the track length. SDF values across track-orientations were then extracted across all patients to conduct further statistical analysis using SPSS.
Results
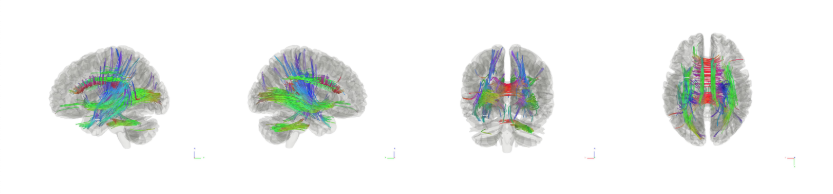
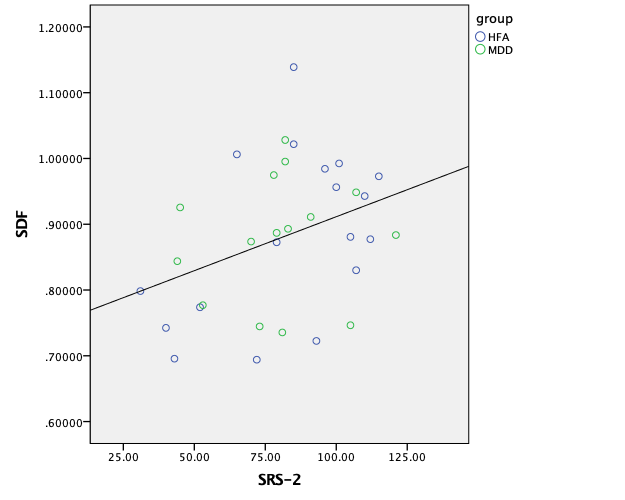
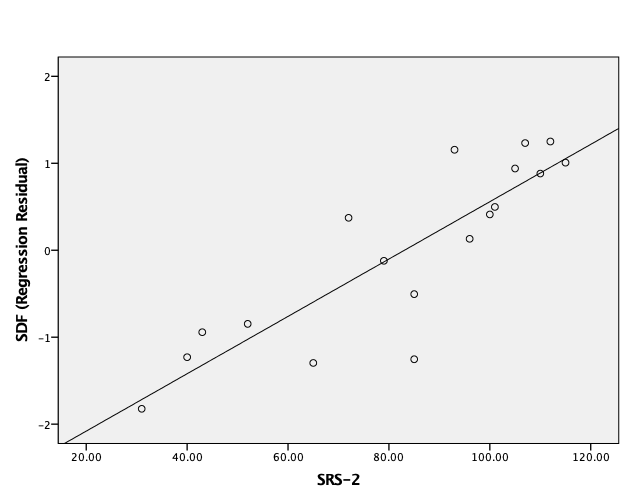
No significant difference in means was found in SRS scores between HFA and MDD; although a significant difference was found in HDRS scores between HFA and MDD. Tractography based analysis showed specific tracts in the corpus callosum, longitudinal fasciculus and corticothalamic pathway to have increased connectivity relating to SRS scores (FDR=0.011) as shown in Figure 1. Individual Spin distribution function (SDF) values across tracts in corpus callosum, cingulum and longitudinal fasciculus were found to have a significant correlation with SRS values (p=0.040, r=0.359) as shown in Figure 2. Post hoc analysis to study the confounding effect of IQ scores in the HFA cohort showed a trend-level partial correlation between SRS and SDF while controlling for IQ scores (p=0.056, r=0.480). Figure 3 shows the plot of this analysis with residual values versus SRS total scores.Discussion
Our results show that across diagnoses, connectivity increases in tracts within the corpus callosum, cingulum, and longitudinal fasciculus relative to SRS-2 scores. Although a majority of findings in literature have shown decreased connectivity in ASD subjects, they are mostly analyses on young children populations and use statistical analyses to distinguish differences in means. Our analysis uses a correlative measure with SRS-2 scores, a measure typically employed to measure severity of social anhedonia. Also, our robust DSI acquisition – with a high ratio between b=0 and other b-values – allows us to observe more subtle changes in microarchitecture of white matter. Our post hoc analysis, illustrates an interesting relationship that IQ scores may have with connectivity and SRS-2 scores; where a limiting factor in that analysis is our sample size.Conclusion
This is the first of kind study that analyzed connectivity in a cohort of HFA and MDD, whom display traits of autism. The analysis observed that connectivity was significantly correlated with SRS-2 scores in a cohort of HFA and MDD subjects. We hope that this study may contribute to research on HFA to further understand the microarchitecture underpinnings of the diagnosis.Acknowledgements
No acknowledgement found.References
1. G. P. Barnhill, Focus on autism and other developmental disabilities 16 (1), 46-53 (2001).
2. J. Green, A. Gilchrist, D. Burton and A. Cox, Journal of autism and developmental disorders 30 (4), 279-293 (2000).
3. D. Hedley and R. Young, Autism 10 (2), 139-153 (2006).
4. J. A. Kim, P. Szatmari, S. E. Bryson, D. L. Streiner and F. J. Wilson, Autism 4 (2), 117-132 (2000).
5. J. A. Meyer, P. C. Mundy, A. V. Van Hecke and J. S. Durocher, Autism 10 (4), 383-402 (2006).
6. A. J. Whitehouse, K. Durkin, E. Jaquet and K. Ziatas, Journal of adolescence 32 (2), 309-322 (2009).
7. T. Lugnegård, M. U. Hallerbäck and C. Gillberg, Research in developmental disabilities 32 (5), 1910-1917 (2011).
8. R. J. Jou, A. P. Jackowski, X. Papademetris, N. Rajeevan, L. H. Staib and F. R. Volkmar, Australian & New Zealand Journal of Psychiatry 45 (2), 153-162 (2011).
9. N. Barnea-Goraly, H. Kwon, V. Menon, S. Eliez, L. Lotspeich and A. L. Reiss, Biological psychiatry 55 (3), 323-326 (2004).
10. C. Cheung, S. Chua, V. Cheung, P. Khong, K. Tai, T. Wong, T. Ho and G. McAlonan, Journal of Child Psychology and Psychiatry 50 (9), 1102-1112 (2009).
11. D. K. Shukla, B. Keehn and R. A. Müller, Journal of Child Psychology and Psychiatry 52 (3), 286-295 (2011).
12. C. Lord, M. Rutter, P. DiLavore, S. Risi, K. Gotham and S. Bishop, Los Angeles, CA: Western Psychological Corporation (2012).
13. A. S. Kaufman, Circle Pines, MN: American Guidance Service (2004).
14. F.-C. Yeh and W.-Y. I. Tseng, Neuroimage 58 (1), 91-99 (2011).
15. F.-C. Yeh, V. J. Wedeen and W.-Y. I. Tseng, IEEE transactions on medical imaging 29 (9), 1626-1635 (2010).
16. F. C. Yeh, L. Liu, T. K. Hitchens and Y. L. Wu, Magnetic resonance in medicine 77 (2), 603-612 (2017).
17. F.-C. Yeh, D. Badre and T. Verstynen, Neuroimage 125, 162-171 (2016).
18. F.-C. Yeh, T. D. Verstynen, Y. Wang, J. C. Fernández-Miranda and W.-Y. I. Tseng, PloS one 8 (11), e80713 (2013).
19. F.-C. Yeh, S. Panesar, J. Barrios, D. Fernandes, K. Abhinav, A. Meola and J. C. Fernandez-Miranda, bioRxiv, 338624 (2018).
Figures