1974
Hyperconnectivity among larger-scale intrinsic functional networks in drug-naïve children with attention-deficit/hyperactivity disorder1Huaxi MR Research Center (HMRRC), Functional and Molecular Imaging Key Laboratory of Sichuan Province, Department of Radiology, West China Hospital, Sichuan University, Chengdu 610041, China, Chengdu, China
Synopsis
We used seed-based analysis and independent component analysis to investigate functional connectivity among five resting-sate networks including the default mode network (DMN), central executive network (CEN), salience network (SN) sensorimotor network (SMN) and affective network (AN) in children with attention-deficit/hyperactivity disorder (ADHD). Hyperconnectivity was found both within and between these networks. Our findings highlight the “hub” role of the DMN and the CEN among all these functional networks in the mechanism of network dysfunction in ADHD children.
INTRODUCTION
Attention-deficit/hyperactivity disorder (ADHD) is one of the most common neurodevelopmental disorders in childhood and adolescence, which is mainly characterized by age-inappropriate inattention, hyperactivity and impulsivity1. In recent years, ADHD has been increasingly viewed as dysfunction among distributed large-scale functional networks. Our recent meta-analysis has proposed the ADHD-specific network alteration pattern which not only include the traditional triple-network model across psychiatric disorders2, namely the default mode network (DMN), the central executive network (CEN) and the salience network (SN), but also the affective network (AN) and the sensorimotor network (SMN) which also involved in the mechanisms of ADHD3.To further test and verify our new network model and characterize the ADHD-specific connectivity pattern, we combined both seed-based analysis (SBA) and independent component analysis (ICA) to obtain five functional networks including the DMN, CEN, SN, AN and SMN and investigate the functional connectivity among them in drug-naïve patients with ADHD and controls.
METHODS
Participants and MR Data AcquisitionA total of 53 drug-naïve ADHD children (mean age: 10.13±2.33 years; 49 males/4 females) and 53 sex- and age-matched typical developed children (TDC) (mean age: 11.02±2.35 years; 49 males/4 females) were recruited in this study. Diagnosis of ADHD was determined by two experienced clinical psychiatrists according to DSM-5. Resting-state fMRI data of all the participants were acquired in 3.0T Siemens scanner. Preprocessing of fMRI data was conducted in DPABI using an automated pipeline.
Seed-based Analysis
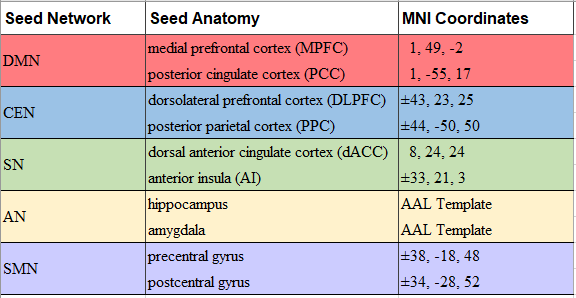
We analyzed functional connectivity between key regions of five functional networks (DMN, CEN, SN, AN and SMN) and the rest of the brain using seed-based analysis. The following seed regions of interests with a 5-mm radius were extracted for the five networks: the posterior cingulate cortex (PCC) and medial prefrontal cortex (MPFC) in the DMN; the posterior parietal cortex (PPC) and dorsolateral prefrontal cortex (DLPFC) in CEN; the anterior insula (AI) and dorsal anterior cingulate cortex (dACC) in the SN; the hippocampus and amygdala in the AN; the precentral and postcentral gyrus in the SMN (Figure 1). Correlation maps were produced by computing the correlation coefficient between the time series of seeds and the time series of all other voxels within the brain.
Independent Component Analysis
We then evaluated functional network connectivity of these five networks using a group-level spatial ICA in the GIFT toolbox. Data were decomposed into a fixed set of 50 independent components which were subsequently categorized into different intrinsic connectivity networks (ICNs) based on spatial correlation with a priori templates and then we visually confirmed the results. Functional network connectivity (FNC) correlation matrix was created to investigate functional connectivity between networks using the MANCOVA toolbox.
RESULTS
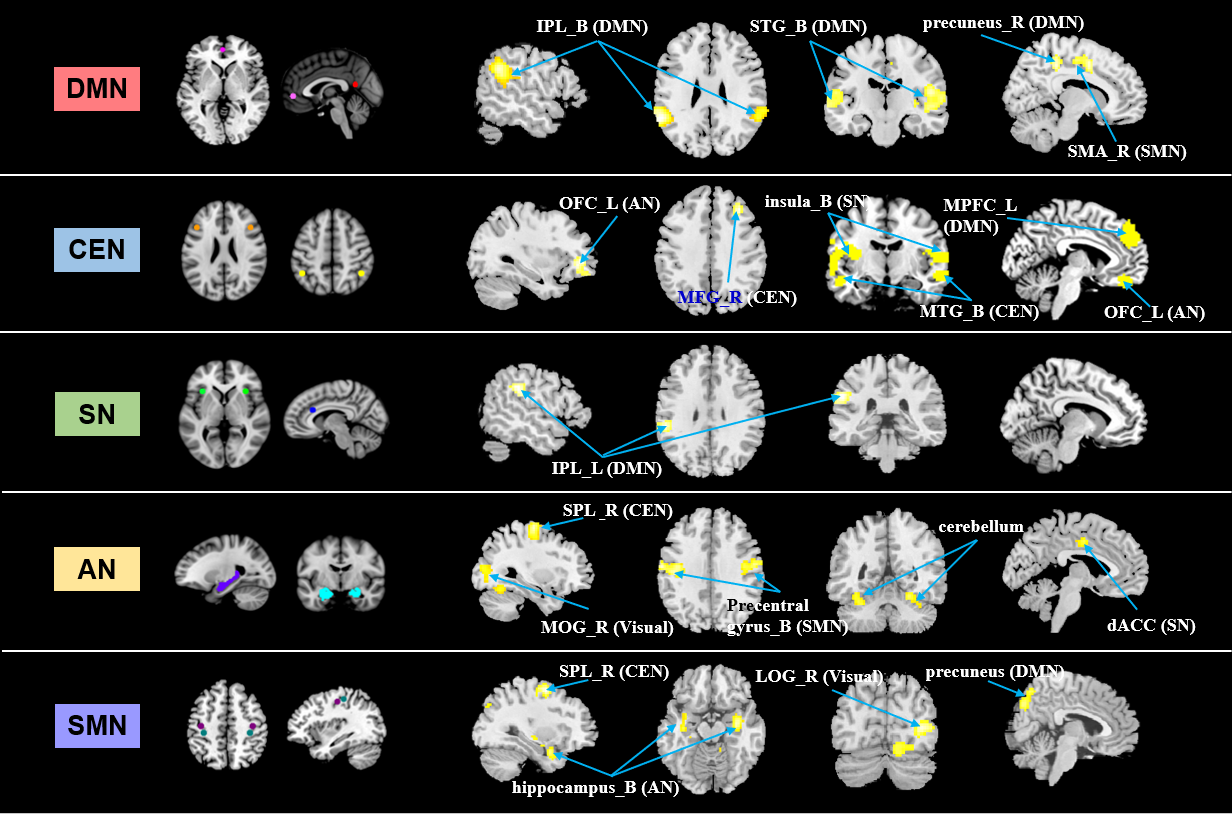
Seed-based AnalysisCompared with TDC, ADHD patients had significantly increased FC within DMN and CEN. We also found increased FC between DMN seeds and regions of SMN; CEN seeds and regions of DMN, SN as well as AN; SN seeds and regions of DMN; AN seeds and regions of CEN, SN, SMN; SMN seeds and regions of CEN (Figure 2).
Independent Component Analysis
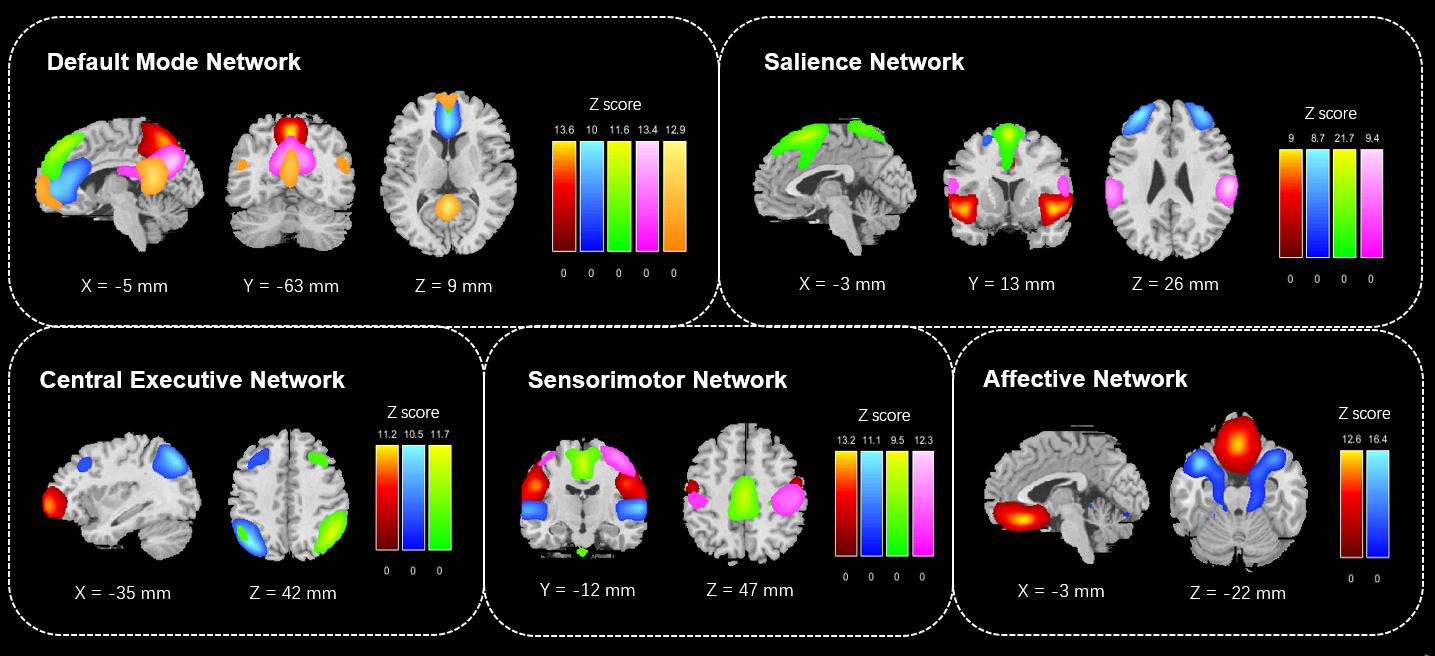
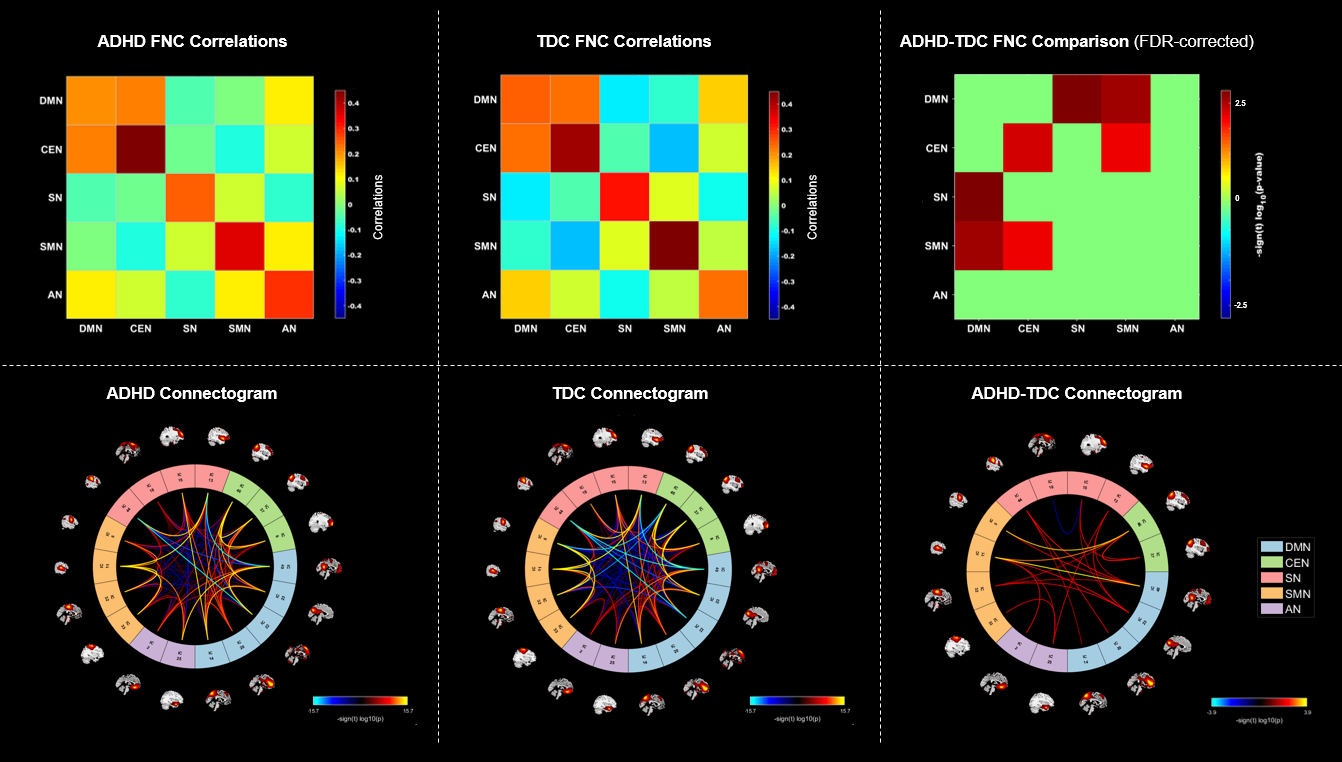
We identified 18 components of these five ICNs in ADHD and TDC groups (Figure 3). Comparing to TDC, children with ADHD showed higher connectivity within the CEN and stronger connectivity between the DMN and SN as well as SMN, also between CEN and SMN (Figure 4).
DISCUSSION&CONCLUSION
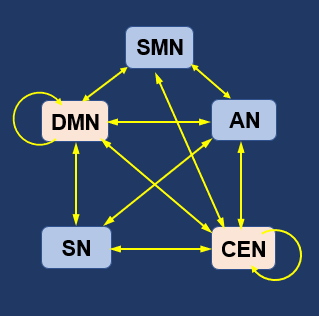
Combining SBA and ICA approaches, we found hyperconnectivity within the DMN and CEN in children with ADHD compared with TDC. Hyperconnectivity was also observed between these two networks and other three networks (SN, SMN and AN) respectively (Figure 5). These findings suggest that the DMN and the CEN may be the “hub” among all these functional networks and play a key role in the mechanism of network dysfunction in ADHD.The DMN, mainly consisting the MPFC and PCC, is involved in self-related activity, especially spontaneous mind-wandering4. Abnormal connectivity within this network may reflect deficits in the integration of internal activity. Aberrant connectivity between the DMN and other four networks may underlie the attentional lapses as mind-wandering mediated by the DMN may interfere with the normal functioning of the task-related networks.
The CEN which includes the DLPFC and PPC is implicated in higher level cognitive functions, attention and external task performance5. Altered connectivity between the CEN and regions of SN, SMN and AN highlight the core role of the CEN in regulating the functions of other networks.
In the current study, we not only extended the previous “triple-network model” (including DMN, CEN and SN) of pathophysiology in ADHD by revealing the involvement of SMN and AN in the mechanism of network dysfunction, but also highlighted the key role of the DMN and the CEN in the interactions with other networks which may underlie core cognitive and affective symptoms that characterize ADHD.
Acknowledgements
This study was supported by the National Natural Science Foundation (Grant No. 81671669), Science and Technology Project of Sichuan Province (Grant No. 2017JQ0001).References
1. American Psychiatric Association, 2013. Diagnostic and Statistical Manual of Mental Disorders, 5th Edn. Arlington: American Psychiatric Publishing.
2. Sha Z, Wager TD, Mechelli A, He Y. Common Dysfunction of Large-Scale Neurocognitive Networks Across Psychiatric Disorders. Biol Psychiatry. 2019;85:379-388.
3. Gao Y, Shuai D, Bu X, Hu X, Tang S, Zhang L, et al. Impairments of large-scale functional networks in attention-deficit/hyperactivity disorder: a meta-analysis of resting-state functional connectivity. Psychological Medicine. 2019;49:2475-2485.
4. Bozhilova NS, Michelini G, Kuntsi J and Asherson P. Mind wandering perspective on attention-deficit/hyperactivity disorder. Neuroscience and Biobehavioral Reviews. 2018;92, 464–476.
5. Seeley WW, Menon V, Schatzberg AF, et al. Dissociable intrinsic connectivity networks for salience processing and executive control. J Neurosci. 2007;27:2349–2356.
Figures