1971
Altered transient connectivity states at rest in Tourette’s syndrome1Institute of Neuroscience and Medicine - 4 (INM-4), Forschungszentrum Juelich, Juelich, Germany, 2Department of Psychiatry, Psychotherapy and Psychosomatics, RWTH Aachen University, Aachen, Germany, 3JARA – BRAIN – Translational Medicine, Juelich, Germany, 4Department of Neurology, RWTH Aachen University, Aachen, Germany, 5Institute of Neuroscience and Medicine - 11 (INM-11), JARA, Forschungszentrum Juelich, Juelich, Germany
Synopsis
Analysis of dynamic functional connectivity enables identification of spatio-temporal variations in functional connectivity. This is useful in identifying transient states of abnormalities in various brain disorders. Tourette syndrome (TS) is a neurodevelopmental disorder characterized by multiple motor and at least one vocal or phonic tic. We identified eight distinct states in TS patients and healthy controls (HC) using spectral clustering. Our results show preferential state dominance and increased inter-state variability in TS patients as compared to healthy controls.
Introduction
Dynamic functional connectivity (DFC) refers to the analysis of functional connectivity changes over short periods of time using a sliding-window approach. It offers the advantage over classical static functional connectivity of capturing temporal variations in spatial connectivity. This is particularly interesting as the mind does not remain constant and switches between mental-states at rest1. Several studies have shown this tool to be useful in identifying transient states of mindfulness and mind-wandering1, aberrant transient states in schizophrenia2 and traumatic brain injury3. Tourette syndrome (TS) is a neurodevelopmental disorder characterized by multiple motor and at least one vocal or phonic tic4, often accompanied by other comorbidities5. Several studies have shown abnormal patterns of static connectivity in TS5–7 and this study aims to investigate abnormalities in patterns of transient connectivity.Methods
Resting-state fMRI data from 28 TS patients and 28 age-matched HC, recorded in a 1.5T MR system (Sonata, Siemens, Germany) were used for this study. Details of the participants, the acquisition protocol, the structural and functional preprocessing and denoising can be found in5. For performing dynamic functional connectivity analyses, the entire scan session was decomposed into 24 sliding windows of length 100s and overlap of 75s. Each window contained 35 fMRI volumes. The sliding window decomposition was followed by 1st level (subject-level) analysis of functional connectivity in each window. This was done by specifying a within-subject ROI-ROI bivariate correlation model (132 whole-brain ROIs: Harvard-Oxford maximum likelihood cortical and subcortical atlas, AAL cerebellar parcellations), using CONN18b8 . The connectivity matrices were imported into MATLAB and checked for data inconsistencies. Subjects with missing connections in any given time window were excluded from further analyses. This was done as the un-thresholded connectivity analyses should yield fully connected matrices. The reason for these missing connections could be the noisy data (scrubbing or improper segmentation in a particular ROI leading to 0 voxels in turn leading to missing connections), but this needs to be investigated further. Visual inspection showed that the structural MRI data of some of these subjects were corrupted by motion artefacts. After exclusion, the data consisted of 23 TS patients and 22 HC. Average connectivity matrices were computed for each time window separately for TS patients and HC. Spectral clustering was applied to the time windows to identify distinct states from the 24 windows. Using the Calinski Harabasz criteria, the optimal number of clusters was identified as 8 for both TS patients and HC. Thus, 8 distinct functional connectivity states were obtained separately in TS patients and HC. The dwell time or the time spent in each state (i.e the size of the cluster or the number of windows belonging to each state) was calculated.Results
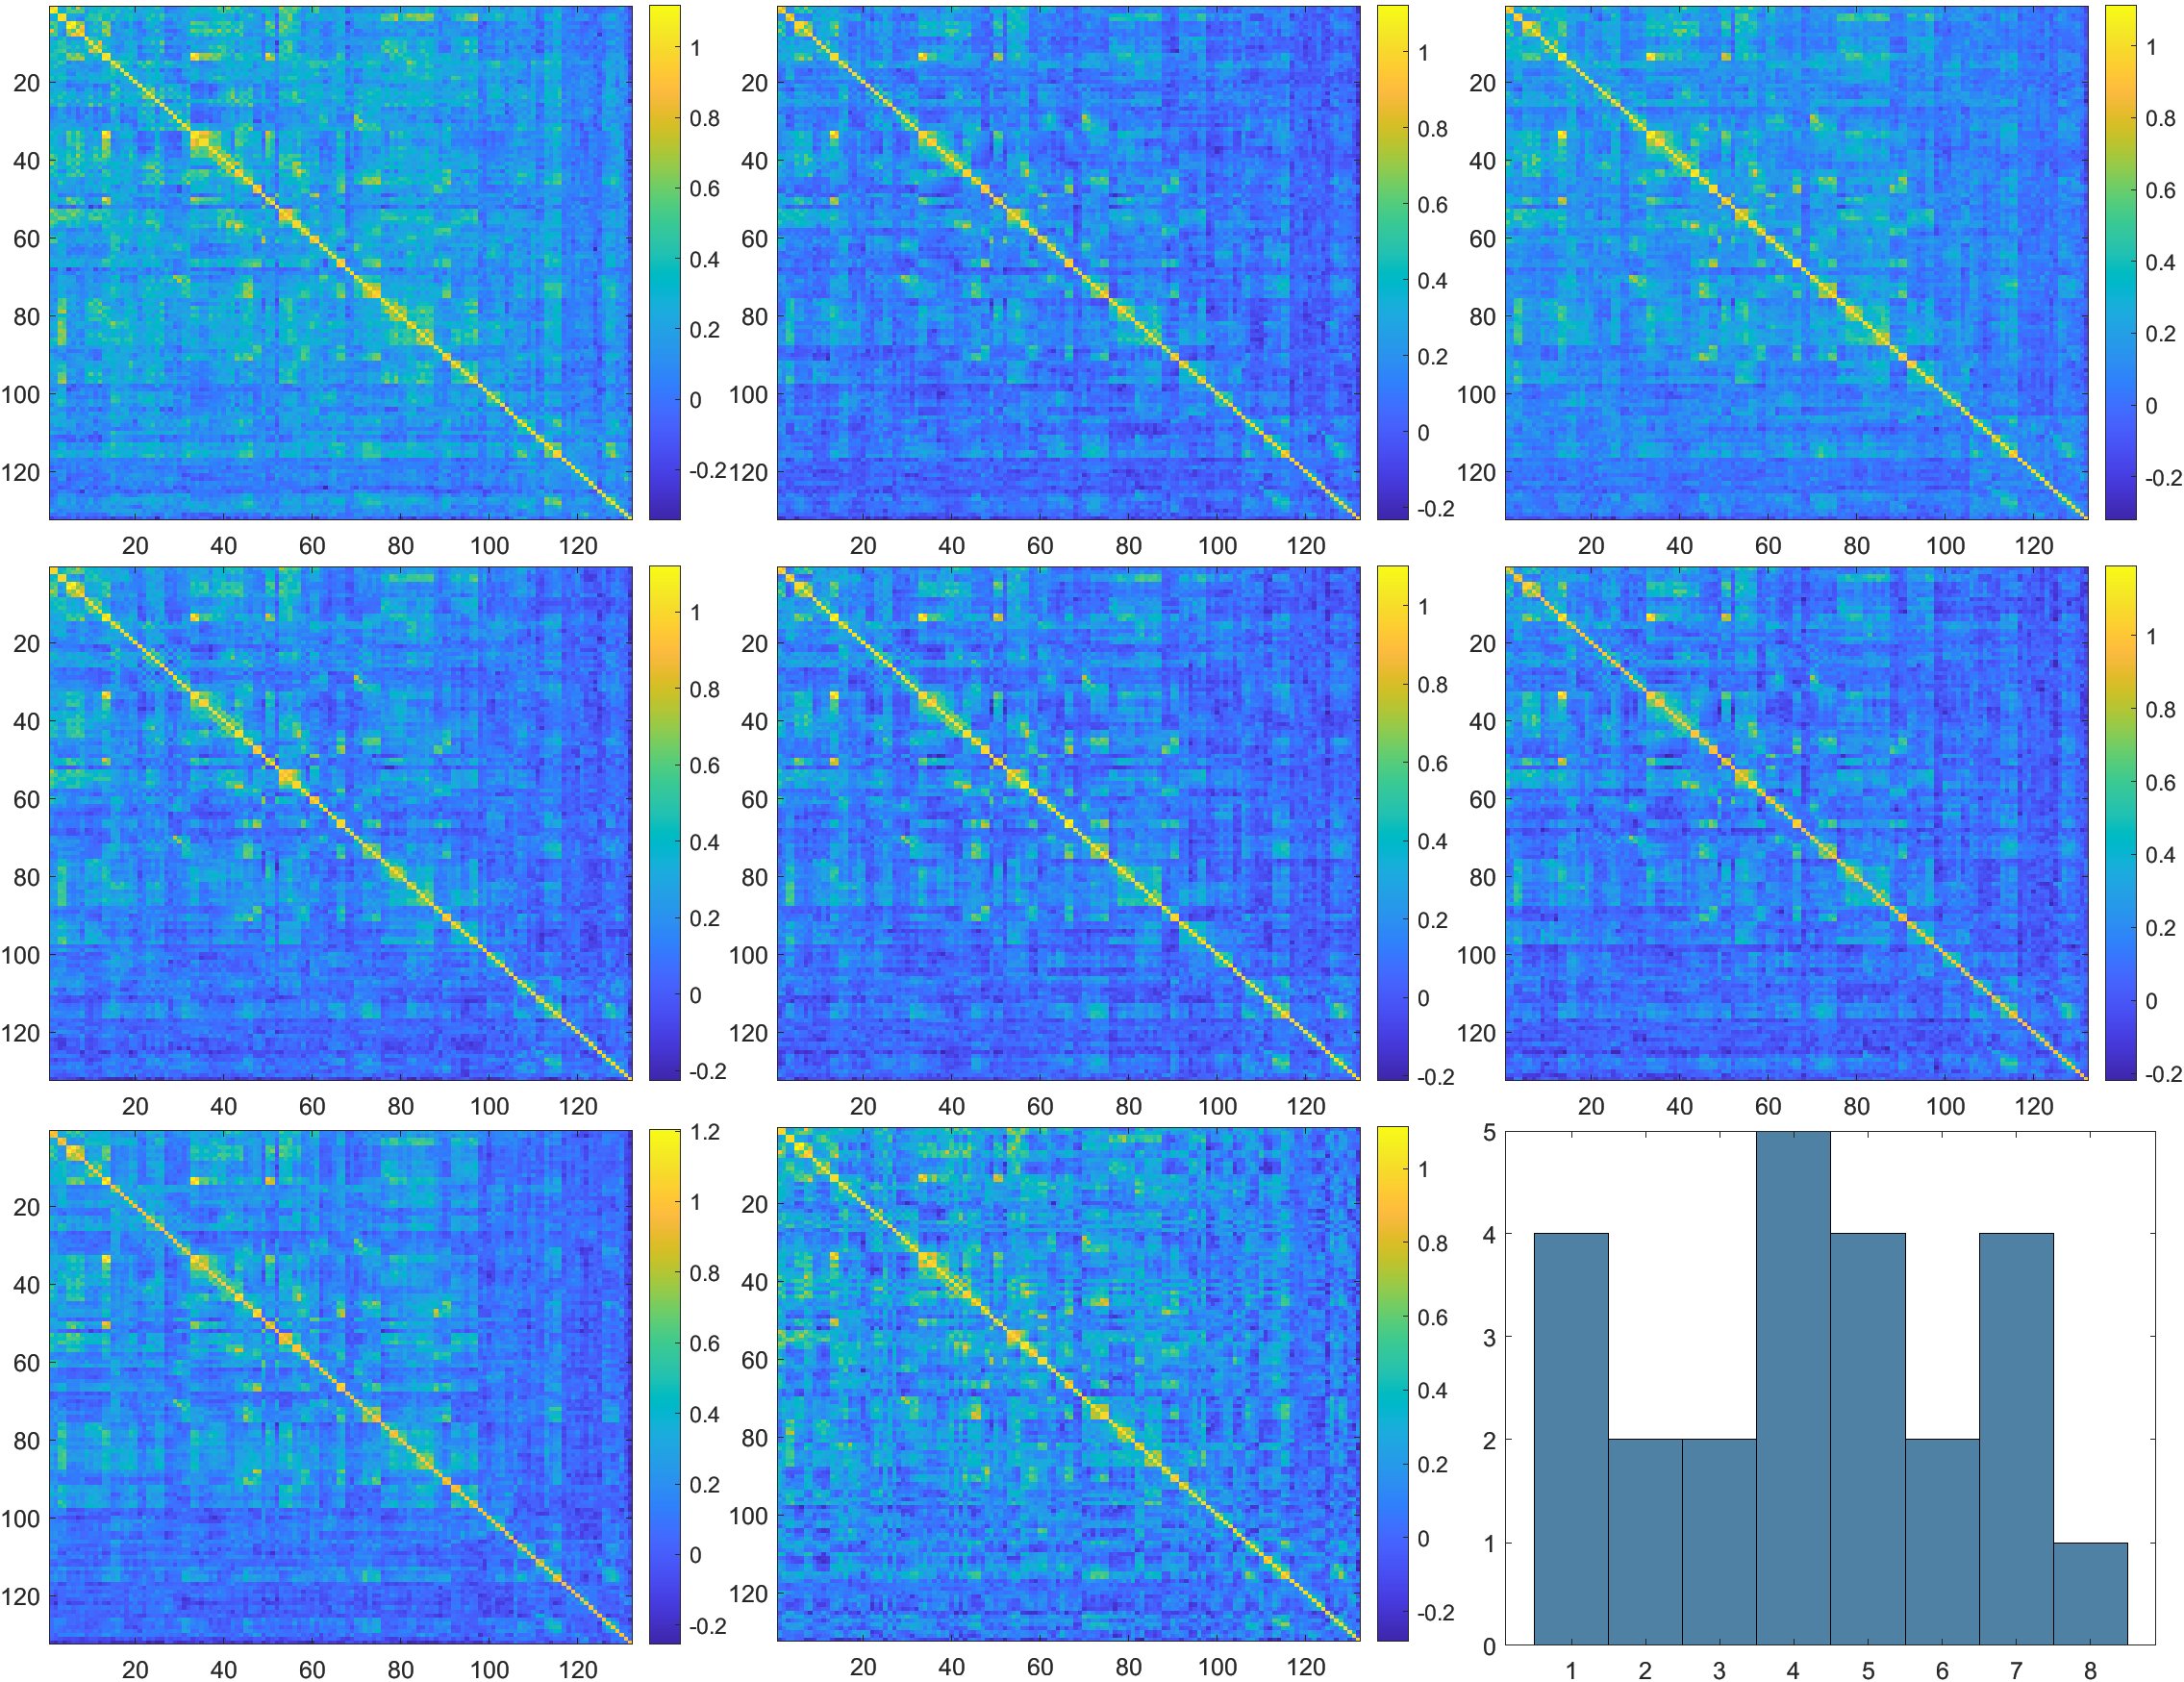
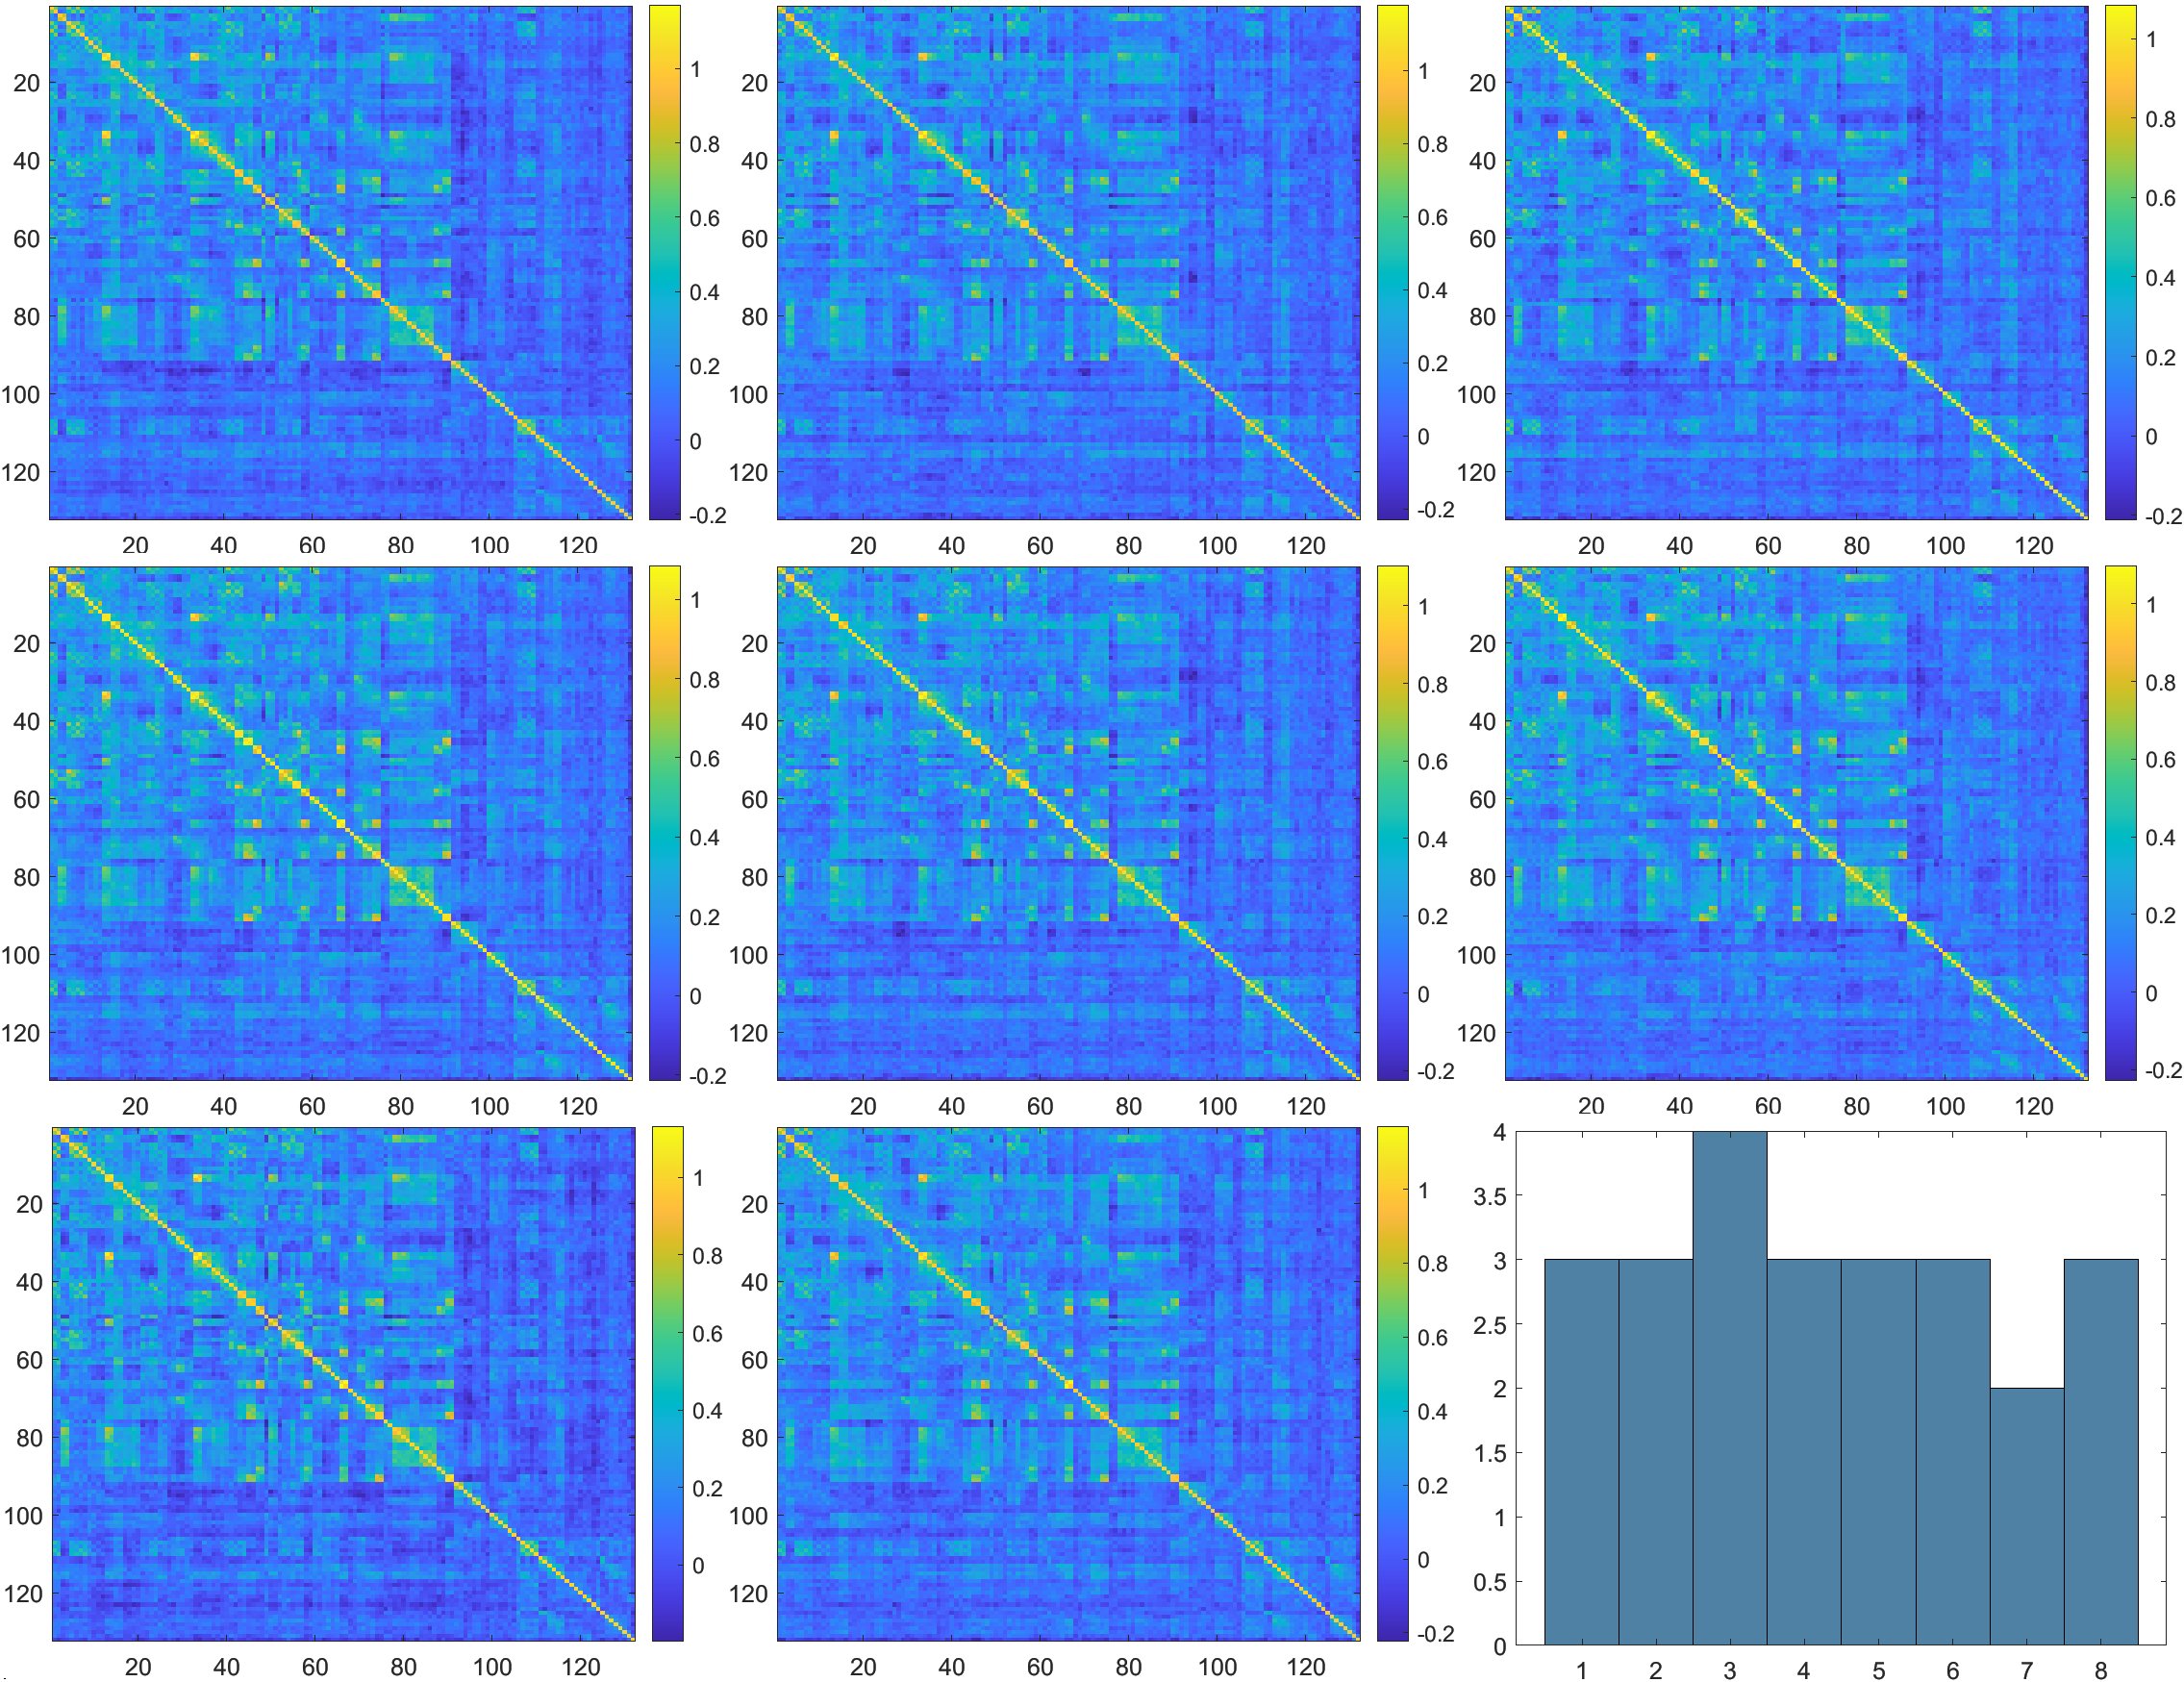
The 8 distinct states of functional connectivity obtained, along with their dwell times, are given in figures 1 and 2 for TS patients and HC respectively. While the distribution of states is more uniform in HC (most of the states have DT = 3, mean DT = 3, SD = 0.53), the states in TS patients range from most dominant (state 4, DT = 5) to least dominant (state 8, DT = 1) (mean DT = 3, SD = 1.41). Similarly, the spatial patterns of connectivity appear to be more uniform in HC and more varying in TS patients. Through visual inspection, state 7 of the TS patients resembles the spatial connectivity pattern of HC, while state 1 reflects more positive connectivity and states 2 and 5 reflect more negative connectivity.Discussion
As we can see from figures 1 and 2, connectivity patterns in the healthy population remain more stable and uniform over time compared to TS patients. TS patients show a preferential state dominance and the most dominant state being state 4, which, based on visual inspection, looks spatially different from the states in the healthy population. On the other hand, the second most dominant state (state 7) closely resembles the states seen in the healthy population. This inter-state variability and transient switching to states closely resembling those of the healthy controls could mean that abnormalities in communication occur in some states, while healthy functioning resumes in other states. Several studies have shown network-level abnormalities, defects in network maturation and alterations in information exchange mechanisms in static connectivity5,7. The transient state changes observed in this preliminary study pave the way to exploring network level and individual subject level changes in transient connectivity.Conclusion
DFC allows the capturing of spatio-temporal variations in functional connectivity. Application of DFC on TS patients revealed preferential state dominance and increased variability in transient states as compared to healthy volunteers.Acknowledgements
1. The German Tourette's Association for their support and travel funds.
2. All participating Tourette's patients and their families for their cooperation
3. Ms. Claire Rick for editorial input.
References
1. Mooneyham, B. W. et al. States of mind: Characterizing the neural bases of focus and mind-wandering through dynamic functional connectivity. J. Cogn. Neurosci. 29, 495–506 (2017).
2. Damaraju, E. et al. Dynamic functional connectivity analysis reveals transient states of dysconnectivity in schizophrenia. NeuroImage Clin. 5, 298–308 (2014).
3. Vergara, V. M., Mayer, A. R., Kiehl, K. A. & Calhoun, V. D. Dynamic functional network connectivity discriminates mild traumatic brain injury through machine learning. NeuroImage Clin. 19, 30–37 (2018).
4. Robertson, M. M. et al. Gilles de la Tourette syndrome. Nat. Rev. Dis. Prim. 3, 16097 (2017).
5. Ramkiran, S., Heidemeyer, L., Gaebler, A., Shah, N. J. & Neuner, I. Alterations in basal ganglia-cerebello-thalamo-cortical connectivity and whole brain functional network topology in Tourette’s syndrome. NeuroImage Clin. 24, (2019).
6. Wen, H. et al. Combining Disrupted and Discriminative Topological Properties of Functional Connectivity Networks as Neuroimaging Biomarkers for Accurate Diagnosis of Early Tourette Syndrome Children. Molecular Neurobiology 1–19 (2017). doi:10.1007/s12035-017-0519-1
7. Worbe, Y. et al. Functional immaturity of cortico-basal ganglia networks in Gilles de la Tourette syndrome. Brain 135, 1937–1946 (2012).
8. Whitfield-Gabrieli, S. & Nieto-Castanon, A. Conn: A Functional Connectivity Toolbox for Correlated and Anticorrelated Brain Networks. Brain Connect. 2, 125–141 (2012).
Figures