1963
Structural Brain Deterioration in the Course of Schizophrenia
Akiko Uematsu1,2, Hidenori Yamasue3, Kiyoto Kasai4, and Shinsuke Koike4,5
1Graduate School of Arts and Sciences, University of Tokyo, Tokyo, Japan, 2RIKEN CBS, Saitama, Japan, 3Departmentof Psychiatry, Hamamatsu University School of Medicine, Hamamatsu, Japan, 4The University of Tokyo Hospital, Tokyo, Japan, 5Center for Evolutionary Cognitive Science, University of Tokyo, Tokyo, Japan
1Graduate School of Arts and Sciences, University of Tokyo, Tokyo, Japan, 2RIKEN CBS, Saitama, Japan, 3Departmentof Psychiatry, Hamamatsu University School of Medicine, Hamamatsu, Japan, 4The University of Tokyo Hospital, Tokyo, Japan, 5Center for Evolutionary Cognitive Science, University of Tokyo, Tokyo, Japan
Synopsis
In this study, we examined structural brain deterioration in the course of schizophrenia with multi aspects by utilizing a variety of information derived from multi-contrast MRI data. Our findings suggested superior temporal gyrus is the key to understand the onset mechanism of Schizophrenia.
INTRODUCTION
Structural brain deteriorations, assumably resulting in cognitive and behavioral dysfunction, in the course of schizophrenia is a well-established finding in MRI studies1. Understanding the pattern of such progressive deterioration from prodromal period would provide neurological insight of the disease mechanism of onset. Nevertheless, few studies have included individuals at imminent risk of developing schizophrenia. Thus, in this study, we delineated the differences of brains of patients at risk of mental state (ARMS), first episode schizophrenia (FEP), chronic schizophrenia (SCZ), and healthy controls (HC) with multi-contrast MRI data to delineate the deteriorations of both gray and white matterMETHODS
This study was approved by the ethics committee of the University of Tokyo Hospital (No. 397 and 2226). T1-, T2-, diffusion-weighted images were acquired from a total of 201 individuals (41 SCZ, 26 FES, 27 ARMS, and 116 HC) with 3 Tesla GE Signa HDx (GE Healthcare, Milwaukee, WI, USA), equipped with a 8 channel brain phased array coil. These images were acquired with the following parameters: T1-weighted ; 3D fast-spoiled gradient recalled (3D-FSPGR) sequence with TR / TE = 6.8/1.94 ms, FA=20°, FOV = 240x240, matrix=256x256, slice thickness=1 mm : Axial T2-weighted ; fast spin-echo images with parallel imaging technique sequence with TR / TE = 4400/82.32 ms, lip angle=90°, FOV = 240x240, matrix=256x256, slice thickness=2.5 mm: Diffusion-weighted; A single-shot spin-echo echo-planar imaging A single-shot spin-echo echo-planar imaging (EPI) sequence with sequence with TR / TE = 200000/55.3 ms, flip angle=90°, FOV = 256x256, matrix=256x256, slice thickness=2.0 mm, 30 b1000 directions with 5 b0 s/mm2.The details of participants’ criteria in this study was written in our previous study2, but AMRS were diagnosed according to the Structured Interview for Prodromal Symptoms (SIPS)3. In addition, FEP patients who have received antipsychotic medication for less than 16 cumulative weeks were recruited to minimize the antipsychotic medication on brain. Table 1 gives the demographic data of the participants in this study.
Adapting HCP pipeline4, we estimated cortical thickness, area, volume, an T1-weighed/T2-weighted ratio cortical myelin map and visually and statistically examined gray matter among groups. With diffusion-weighted data, we calculated not only conventional diffusion tensor metrics but also a novel methodology, fixel 5 to examine white matter.
RESULTS AND DISCUSSIONS
There were various cortical regions that significantly different from HC group. Especially the thickness of superior temporal gyrus showed linear thinning as the stage got worse (Figure 1A). The GLM analysis on cortical structure also showed significant difference in superior temporal regions (Figure 1B) multiple altered regions different among groups. Nevertheless, T1-weighted/T2-weighted ratio myelin map did not show any difference among groups, indicating that the cortical thinning is not due to disruption of myelinated axons getting into cortical regions. Whereas, fixel-based analysis, which provides more detailed white matter structural information, demonstrated less density of assumably arcuate fasciculus and fornix passing on thalamus in left hemisphere and bilateral minor forceps and superior longitudinal fasciculus in ARMS, FEP, and SCZ than HC (Figure 2). The mean FA values in these fibers also statistically supported significant reduction in SCZ (p > 0.01) although ARMS and FEP groups showed no significance. These results suggested the fiber bundles gradually teared and reduced its diameter and fiber density as the stage got worse, reducing its FA values. Since arcuate fasciculus and superior longitudinal fasciculus stem from or pass through superior temporal gyrus, whose thickness and volume were significantly smaller in all groups in this study, it could be said that schizophrenia might have some vulnerability in superior temporal gyrus cells and their axons connecting between temporal lobe and parietal/frontal regions.CONCLUSION
To conclude, we examined structural brain deterioration in the course of schizophrenia with multi aspects by utilizing a variety of information derived from multi-contrast MRI data. Our findings suggested superior temporal gyrus is the key to understand the onset mechanism of Schizophrenia.Acknowledgements
No acknowledgement found.References
- Cetin-Karayumak S, Di Biase MA, Chunga N, et al. White matter abnormalities across the lifespan of schizophrenia: a harmonized multi-site diffusion MRI study. Mol Psychiatry. 2019.
- Iwashiro, N., Suga, M., Takano, Y., Inoue, H., Natsubori, T., Satomura, Y., ... & Gonoi, W. (2012). Localized gray matter volume reductions in the pars triangularis of the inferior frontal gyrus in individuals at clinical high-risk for psychosis and first episode for schizophrenia. Schizophrenia research, 137(1-3), 124-131.
- McGlashan, H., Miller, T. J., & Woods, S. W. (2001). Structured interview for prodromal syndromes. Version 3.0. PRIME.
- Glasser, M. F., Sotiropoulos, S. N., Wilson, J. A., Coalson, T. S., Fischl, B., Andersson, J. L., ... & Van Essen, D. C. (2013). The minimal preprocessing pipelines for the Human Connectome Project. Neuroimage, 80, 105-124.
- Raffelt DA, Tournier JD, Smith RE, et al. Investigating white matter fibre density and morphology using fixel-based analysis. Neuroimage. 2017;144:58-73. doi:10.1016/j.neuroimage.2016.09.029
Figures
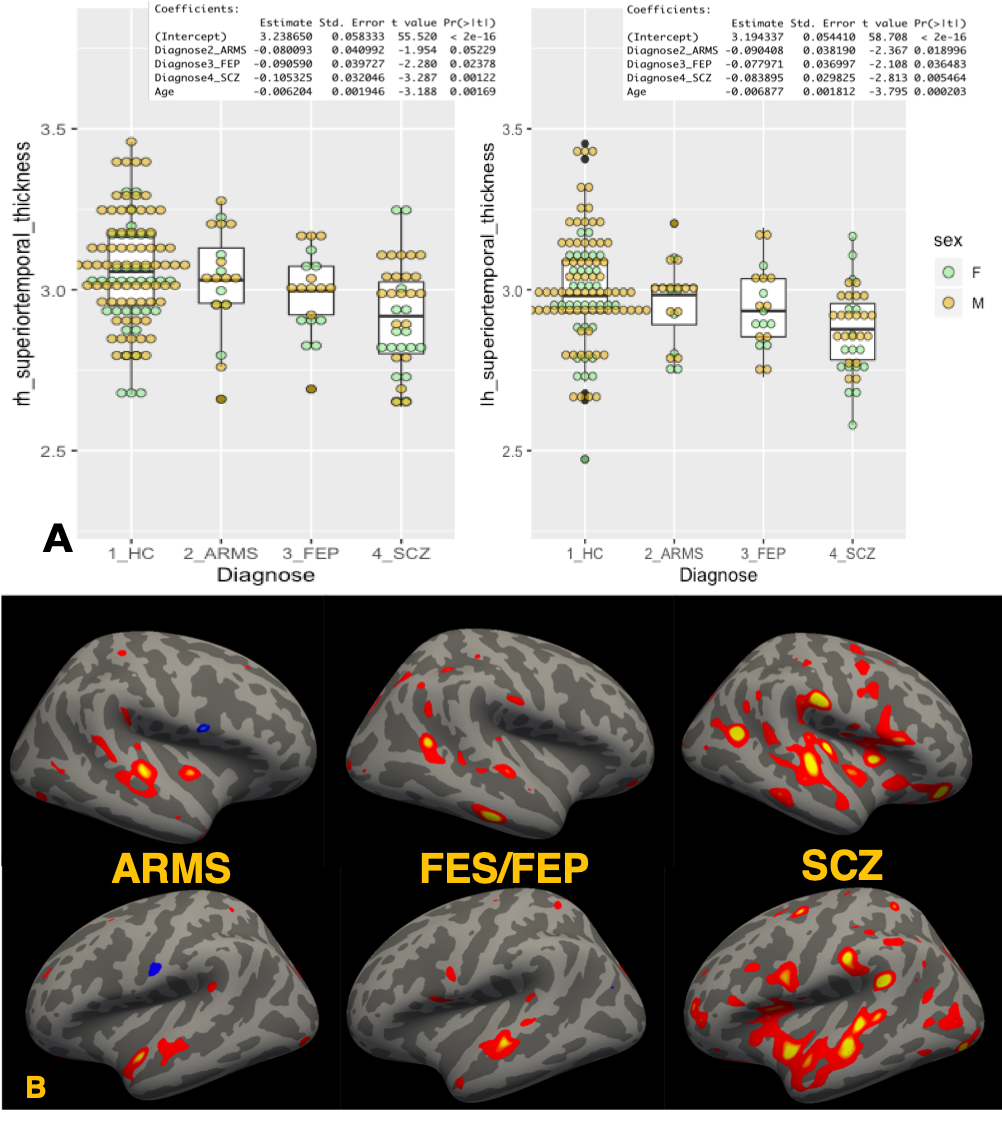
Figure 1. Deterioration of superior temporal gyrus in the course of
Schizophrenia. A) Boxplots of Superior temporal gyrus
thickness among heathy control (HC), group at risk of mental state (ARMS), first episode of
Schizophrenia (FES), and chronic schizophrenia (SCZ)
with the results of linear
model analysis (thickness~Diagnose+Age). B) the result of glm analysis on cortical
thickness. reddish
colored regions
were significantly thicker in HC than each ARMS, FES/FEP, SCZ group with
HC.
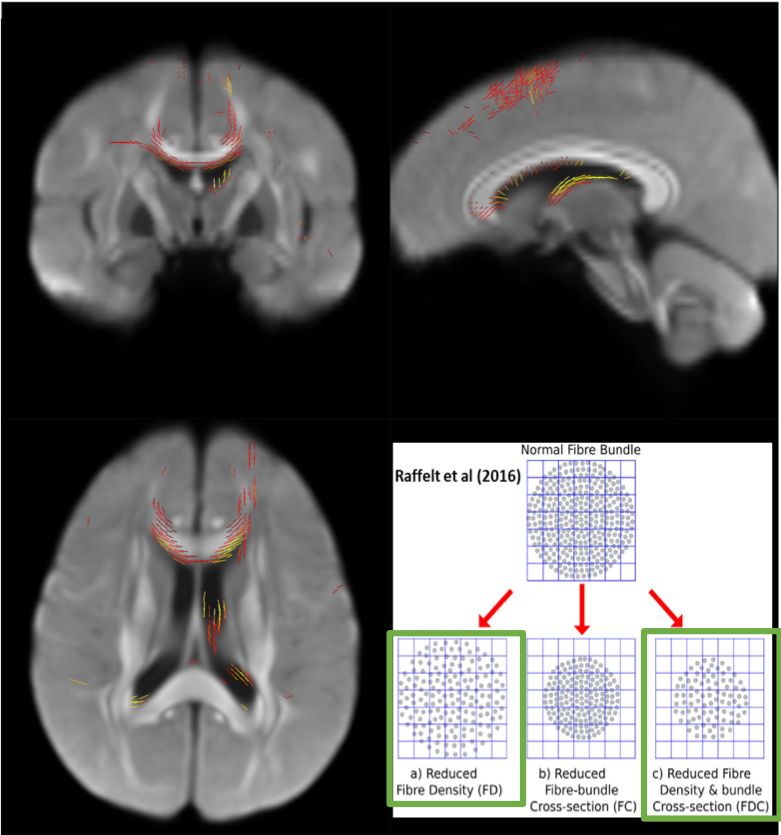
Figure 2.
Fixel-based analysis :
Apparent fiber density (AFD). After
family-wise error correction, the tendency ( p > 0.1) of smaller AFD values in ARMS, FEP, SCZ
than HC was found, depicted in red-yellow lines.

Table 1. Demographic data summary of the participants