1956
Regional Mapping of Glutamate Distributions in a Healthy Rat Brain Using Glutamate Chemical Exchange Saturation Transfer (GluCEST) MRI1Department of Radiology, Asan Medical Center, University of Ulsan College of Medicine, Seoul, Republic of Korea, 2Department of Convergence Medicine, Asan Medical Center, University of Ulsan College of Medicine, Seoul, Republic of Korea, 3Convergence Medicine Research Center, Asan Institute for Life Sciences, Asan Medical Center, Seoul, Republic of Korea, 4Asan Image Research, Asan Institute for Life Sciences, Asan Medical Center, Seoul, Republic of Korea, 5Faculty of Health Sciences and Brain & Mind Centre, The University of Sydney, Sydney, Australia
Synopsis
Detecting glutamate signals in vivo within the brain may have a diagnostic potential. Recently, with many translational research efforts leading to clinical trials, presenting the normal in vivo glutamate distribution in pre-clinical data to establish a database for pre-clinical studies can be valuable. In this abstract, we investigated glutamate signal distributions in multiple brain regions of a healthy rat brain using GluCEST imaging. Quantified GluCEST signals showed significant differences between white and gray matter regions. Our findings and investigations yield a valuable database and insights for comparing glutamate signal changes in pre-clinical brain diseases.
INTRODUCTION
Glutamate is a major excitatory neurotransmitter in the mammalian central nervous system (CNS) and is involved in neuronal function.1,2 Detecting in vivo glutamate signal changes in the brain can be applied to the diagnosis and treatment plan of multiple diseases where glutamate changes are involved. Chemical exchange saturation transfer (CEST) MRI utilizes the reduction of the bulk water magnetization through the exchange of saturated magnetization from exchangeable protons of solute metabolites by applying a RF pulse, and shows enhanced sensitivity compared to other imaging methods.3,4 Recently, as many pre-clinical studies conducted as translational research have led to clinical trials, presenting the normal in vivo distribution of glutamate in pre-clinical data to establish a database for various pre-clinical studies may prove valuable. In this study, we applied GluCEST to healthy rat brains and performed extensive quantitative and qualitative analyses in multiple brain regions to elucidate the in vivo distribution of glutamate. We performed a stability test between two time points (initial measurement and 1 month after) to demonstrate the signal stability of GluCEST measurements, and also compared 1H MRS data from the cerebral cortex and hippocampus to that obtained with the GluCEST signal.METHODS
CEST Imaging: All experiments were performed using a Bruker 7-T scanner, and 11 Sprague-Dawley rats were used. GluCEST imaging was performed using a turbo-RARE pulse sequence with the following parameters: TR/TE=4,200/36.4 ms, RARE factor=16, and 25 frequency offsets [-6 ~ +6 ppm; 0.5 ppm increment)] using a continuous-wave RF saturation pulse (power/time=3.6μT/1s).5,6 Reference (S0) image was then acquired. To minimize the effects of B0 and B1 field inhomogeneity-induced artifacts in GluCEST analysis, water saturation shift referencing Z-spectra (33 frequency offsets [-0.8 ~ +0.8 ppm; 0.05 ppm increment; 0.05 μT RF power),7 and a B1 map using the double flip-angle (30° and 60°) method were acquired.5 Additionally, five randomly selected rats were scanned again after 1 month to evaluate the signal stability of GluCEST imaging.1H MRS: Based on the data of the stability tests in the five selected rats, water-suppressed 1H-MRS single-voxel spectra were acquired from an ROI in the left cerebral cortex (2.0×2.0×3.0 mm3) and hippocampus (4.5×1.0×2.5 mm3) using spin-echo-based PRESS sequence, and VAPOR water suppression with the following parameters: TR/TE=5,000/16.3-ms, average=128, number of data points=2,048 and spectral width=5,000Hz.
Data Processing: Using B0 corrected data, the GluCEST map was generated as follows: GluCEST(%) = [(Msat(-Δω) – Msat(+Δω)) / Msat(-Δω)]×100, where Msat(±Δω) is the magnetization acquired with saturation pulse applied at ±3.0-ppm to the water resonance. Subsequently, GluCEST contrast was corrected at each voxel using relative B1 values.5 For quantification of GluCEST, eight ROIs were carefully drawn in the cerebral cortex, hippocampus, corpus callosum, and the rest of the midbrain regions of the left and right hemispheres. Spectral fitting and quantification of 1H-MRS data were performed with a fully blind spectral process using the LCModel with a simulated basis set including 18 metabolites. All metabolite peaks were fitted in the chemical shift range from 4.0 to 0.3-ppm.
RESULTS AND DISCUSSION
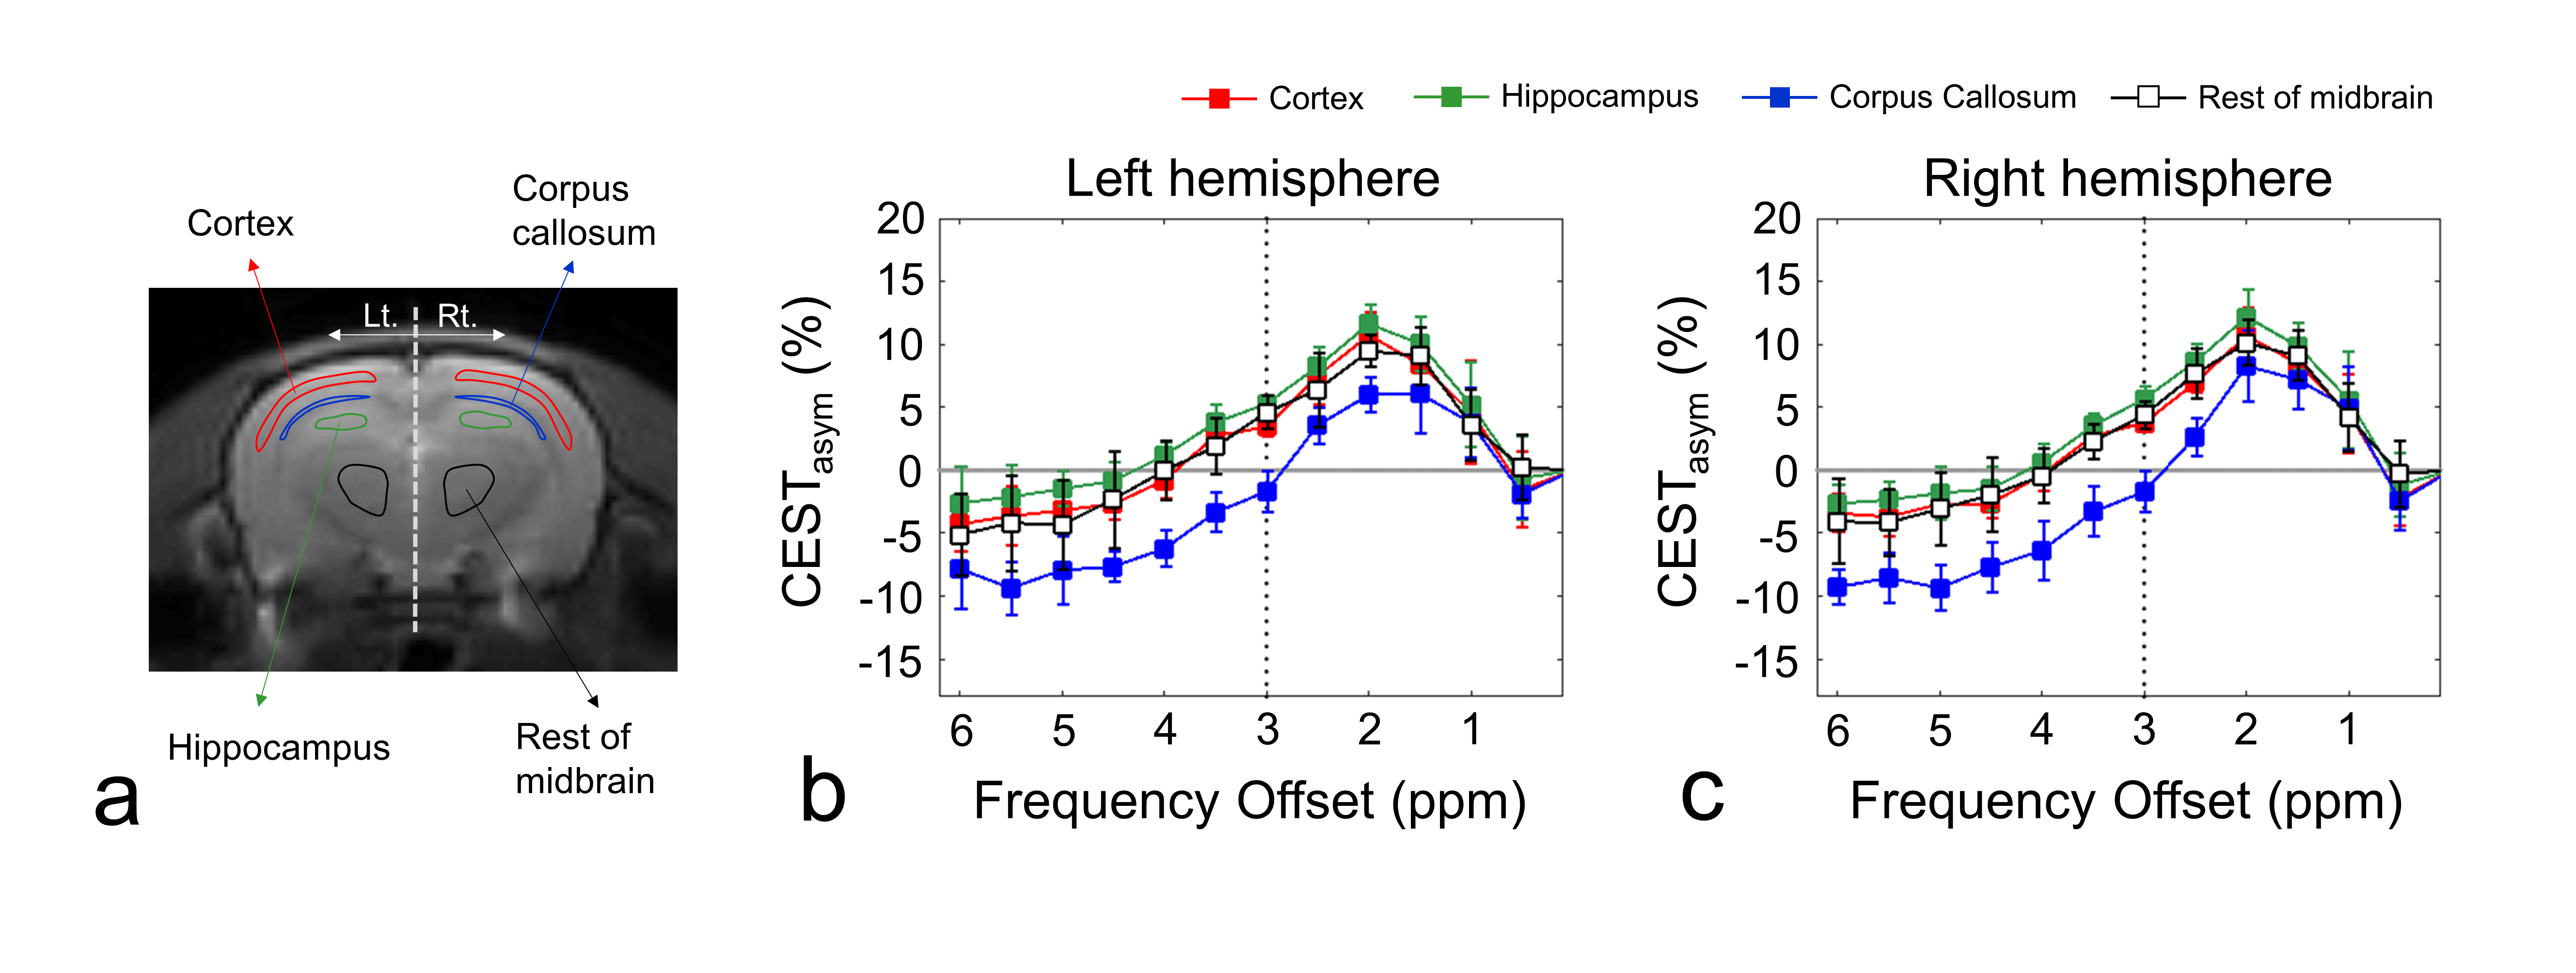
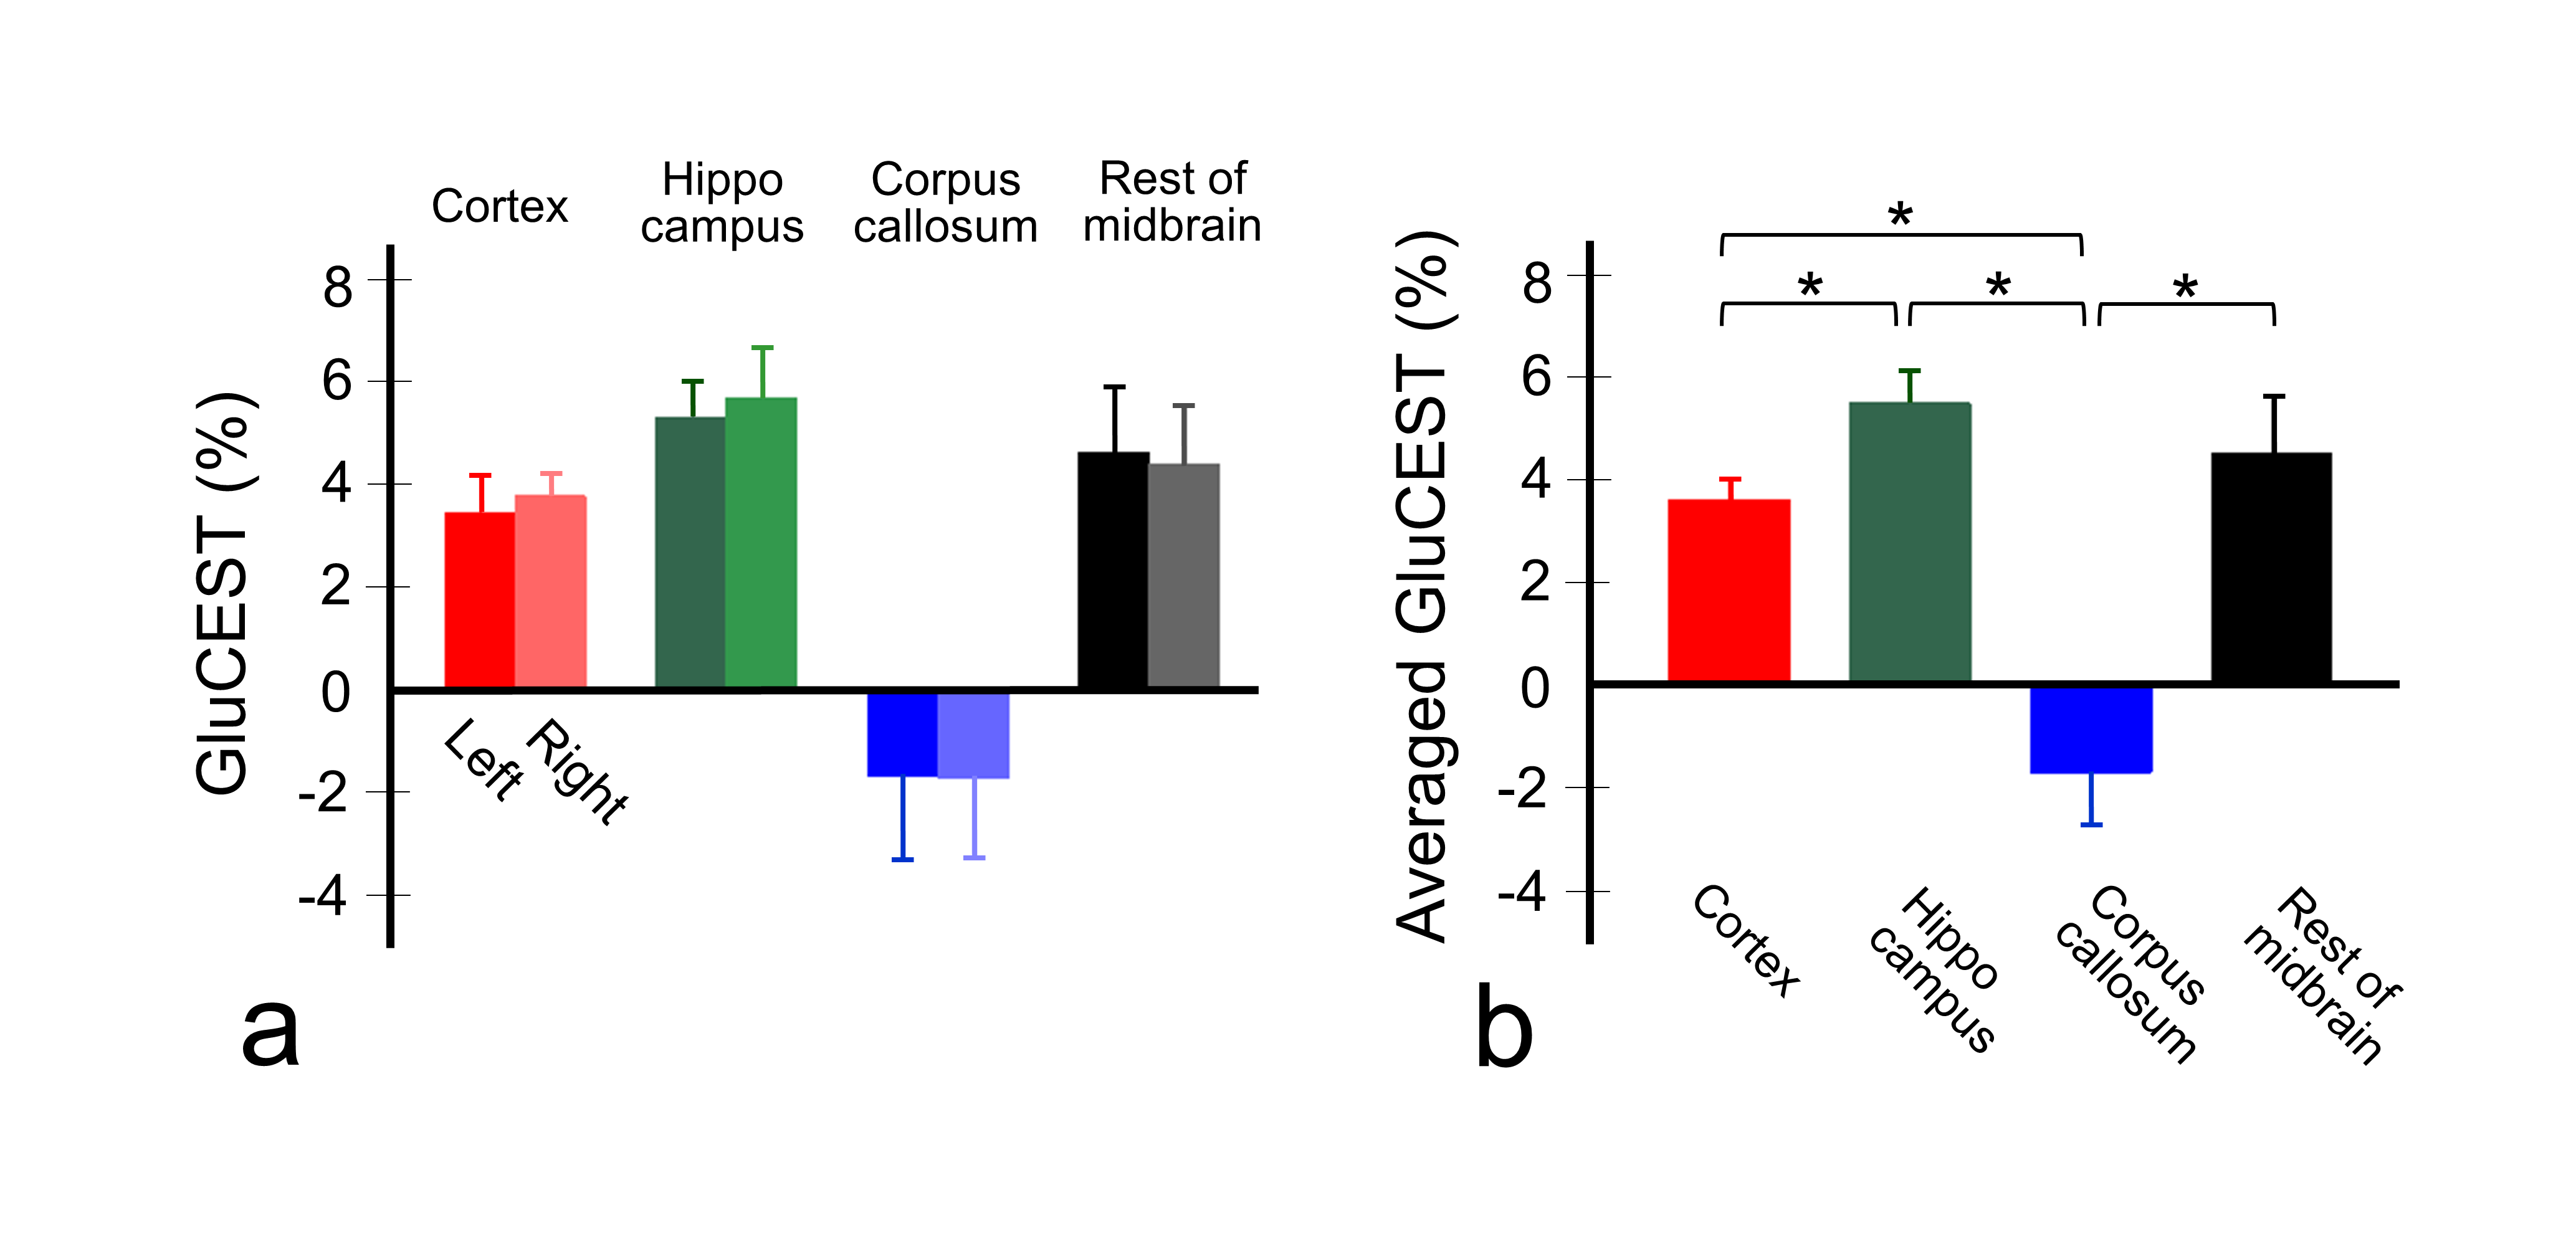
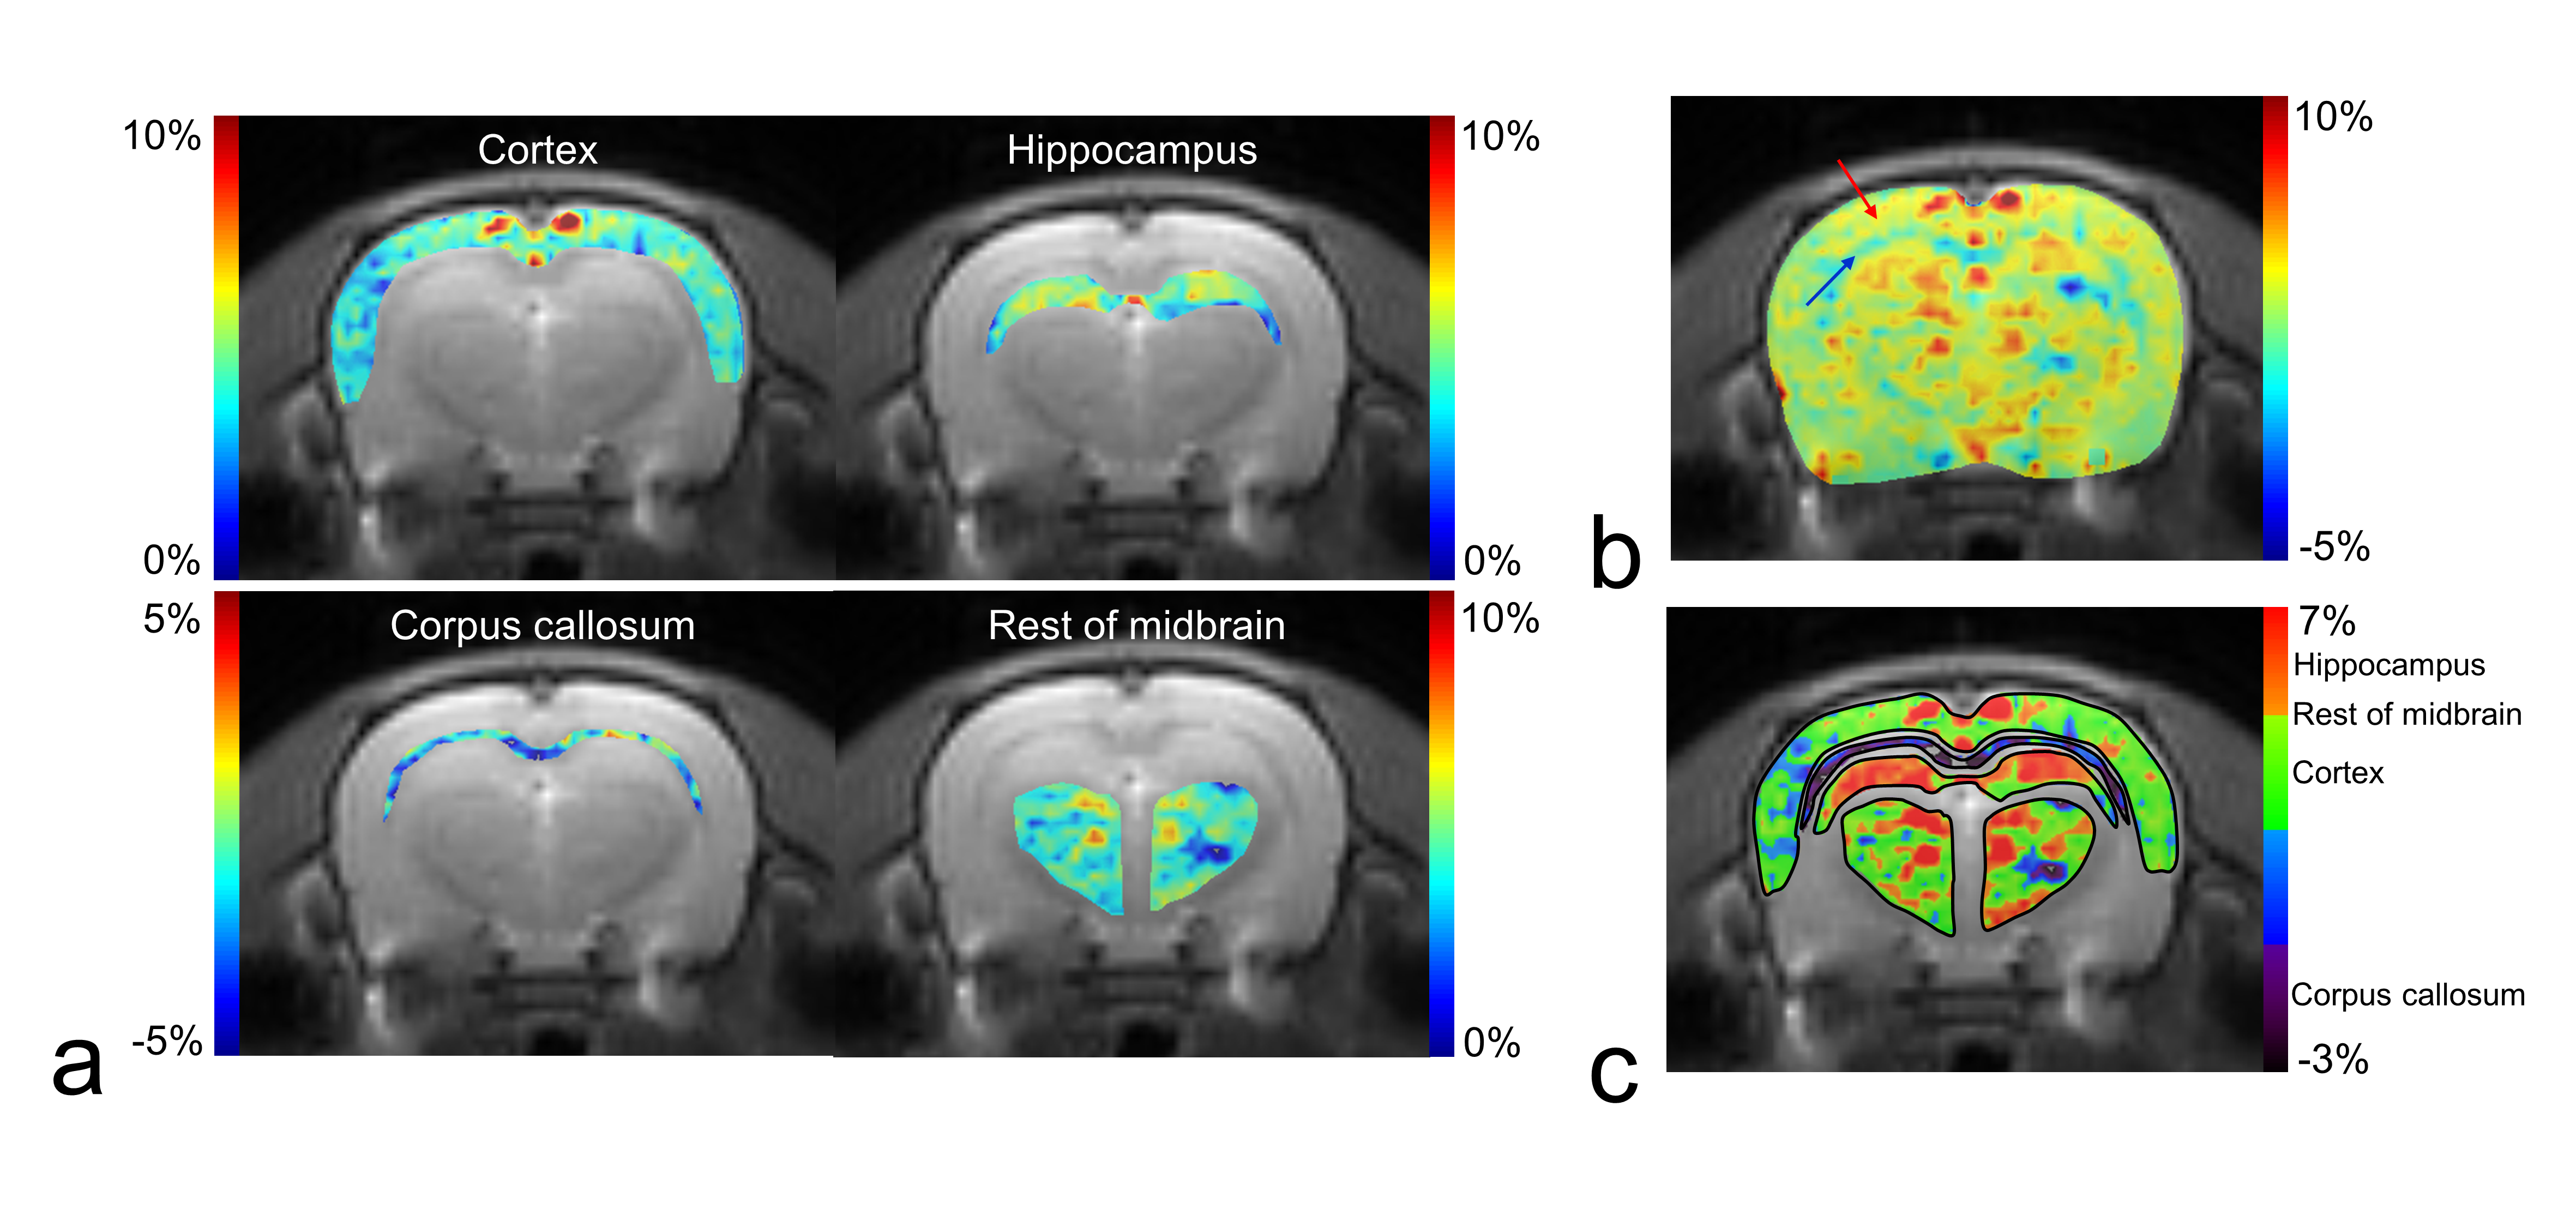
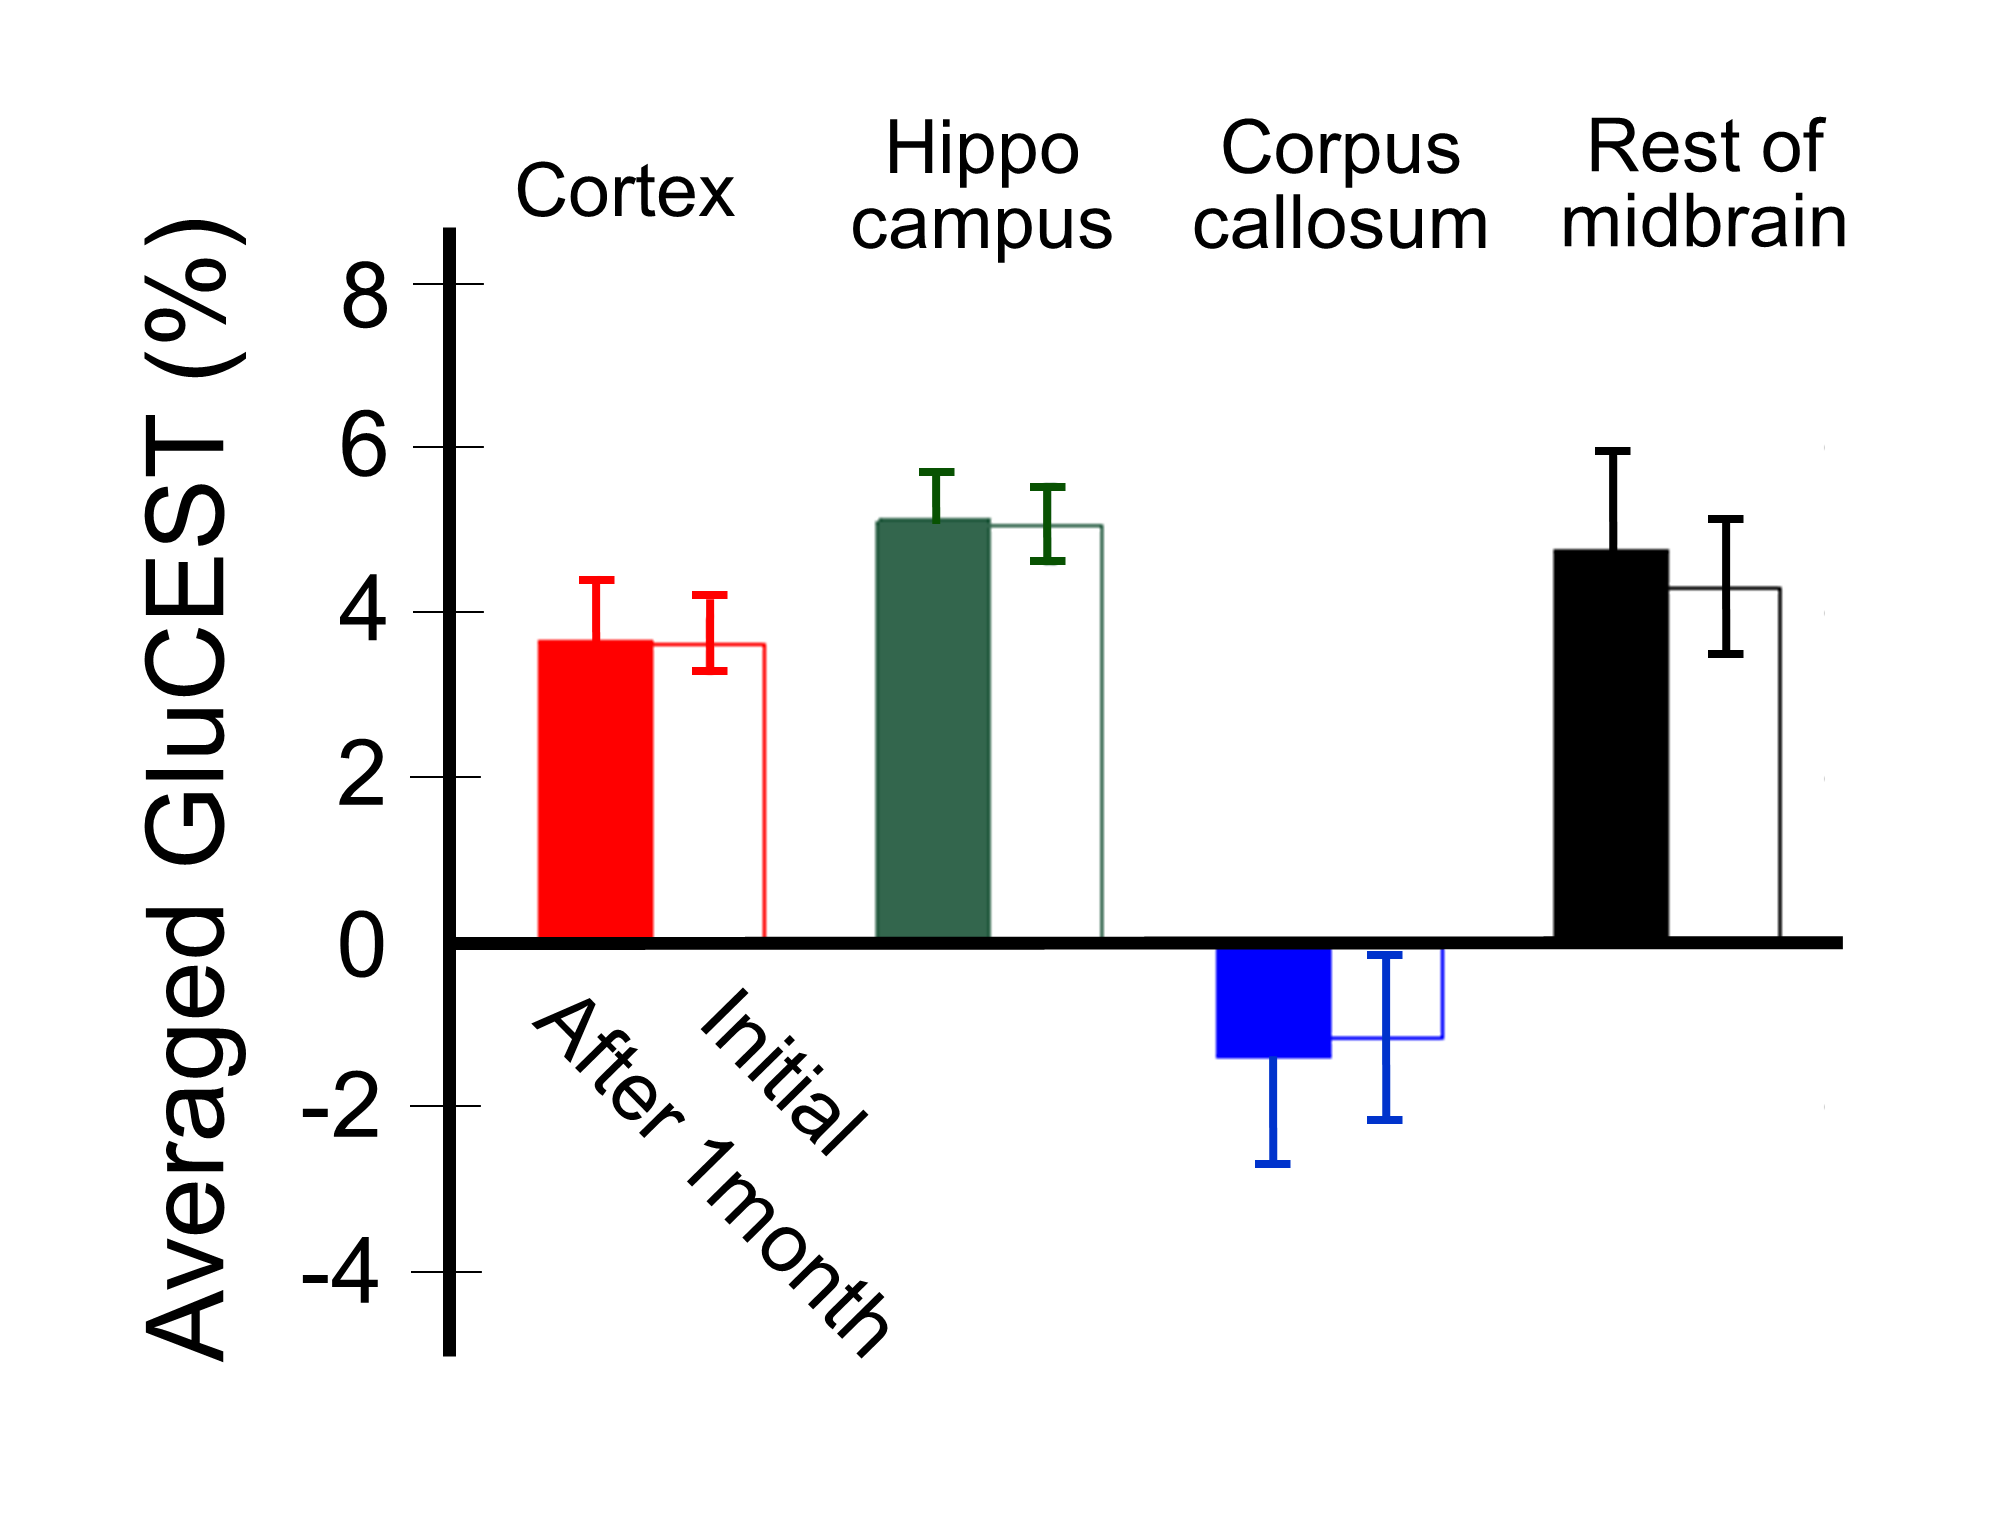
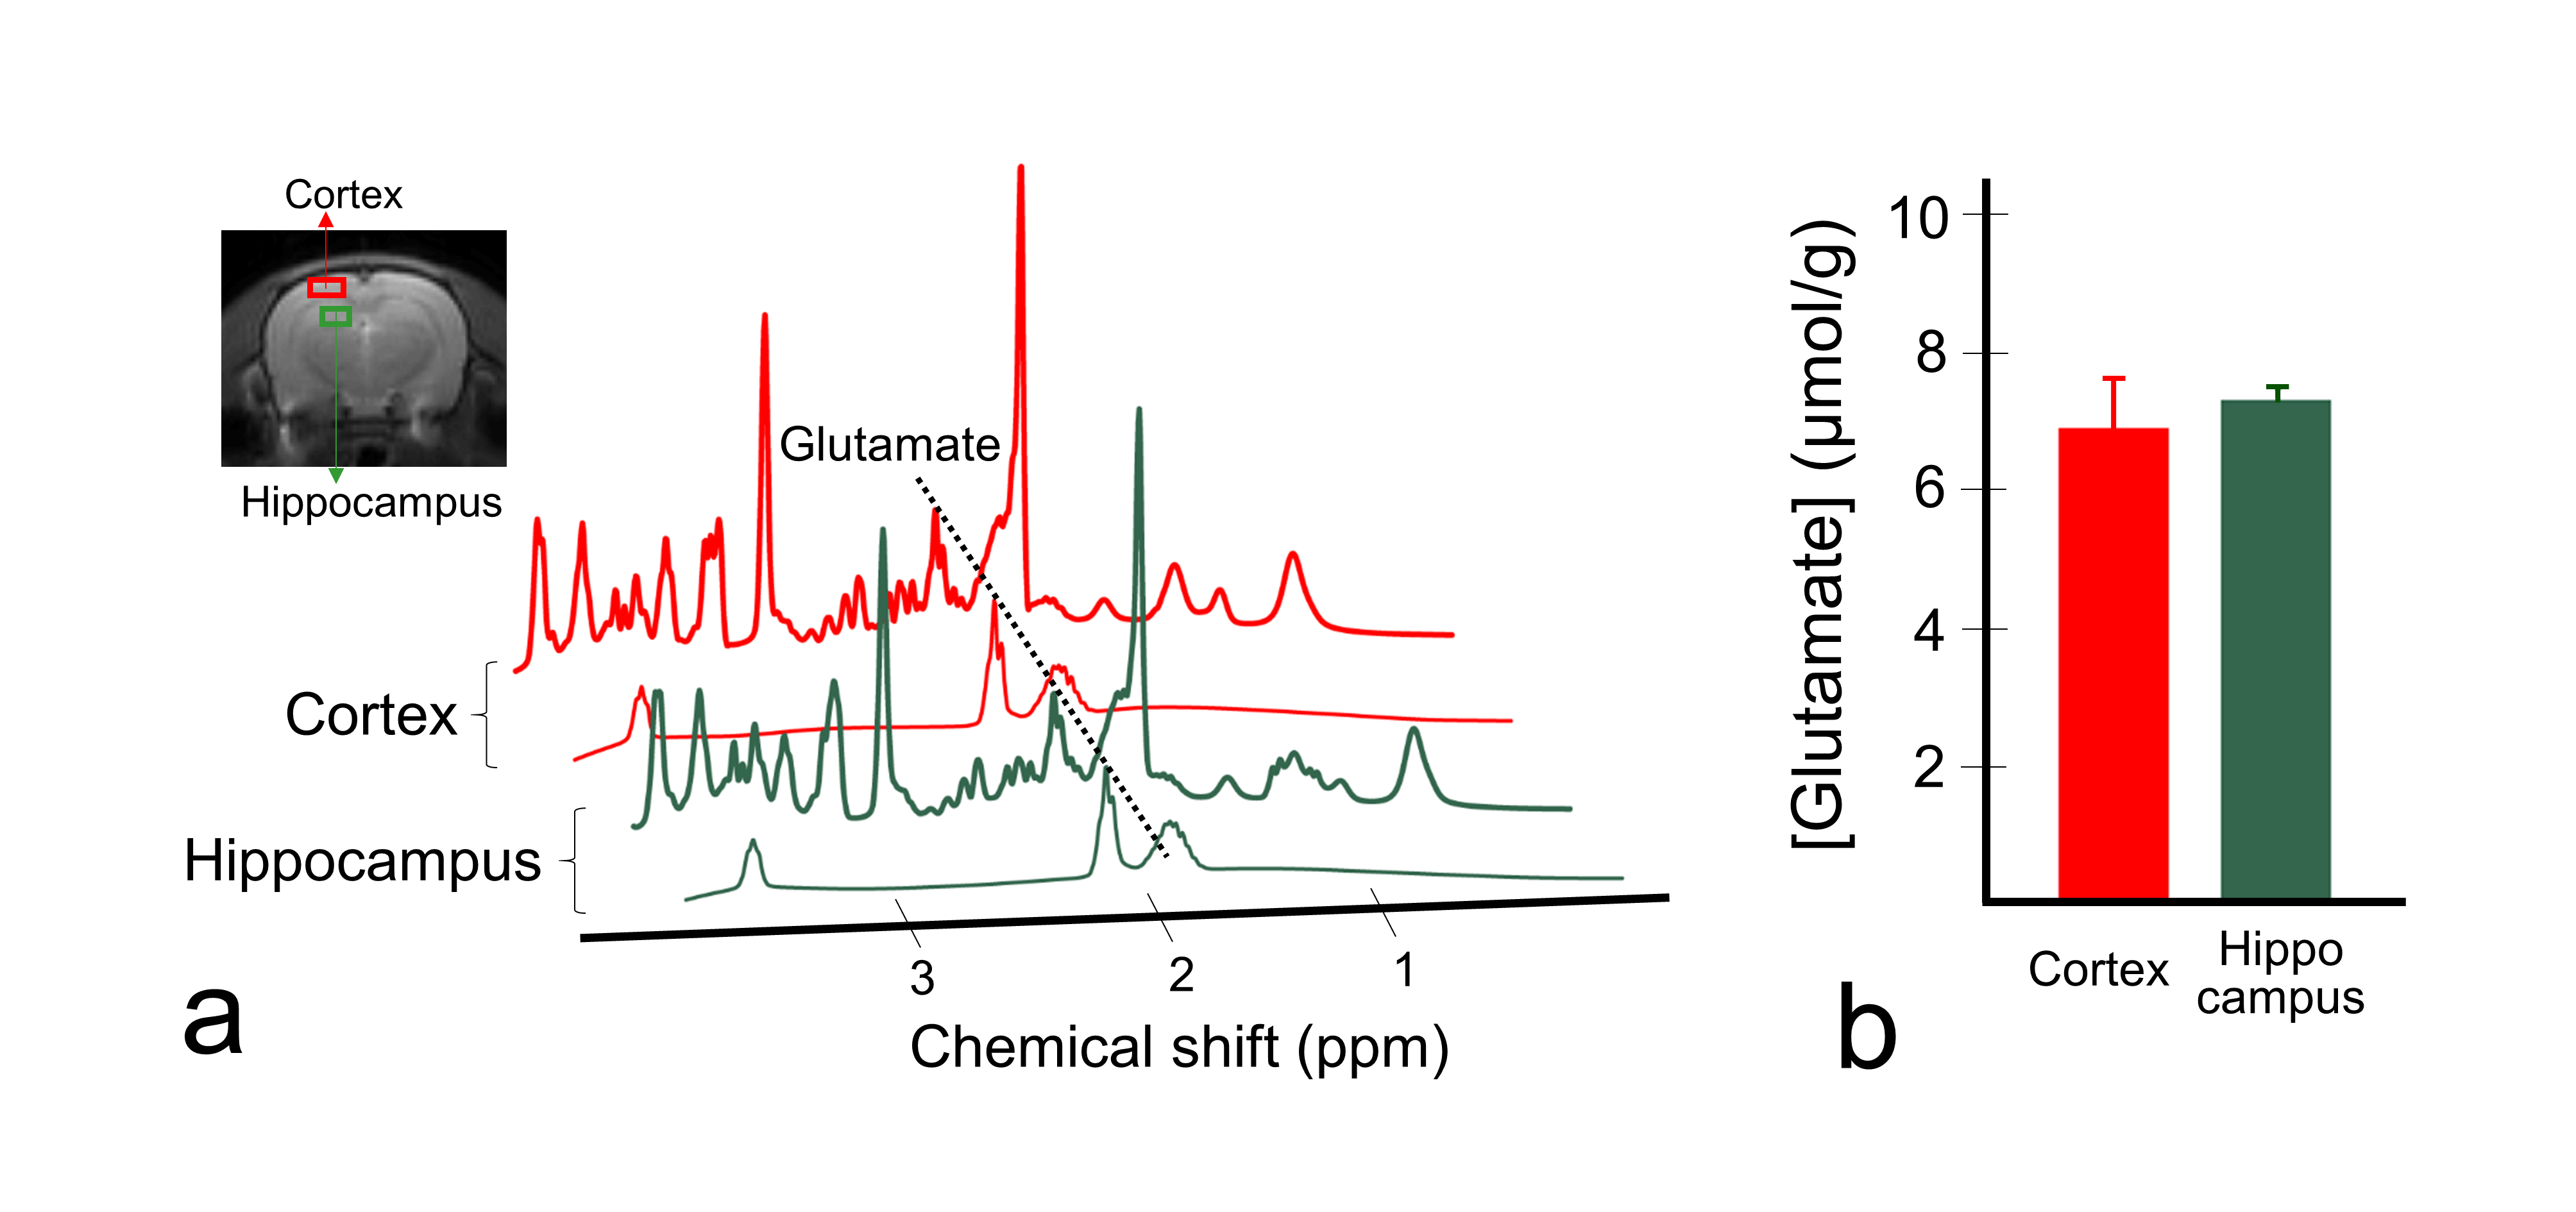
Figure 1 shows the defined ROIs (a) and CEST asymmetry (CESTasym) curves for left (b) and right (c) hemispheres. All CESTasym curves in gray matter regions had higher asymmetry values than those in the white matter regions in both hemispheres. Furthermore, as indicated in previous studies, the broadness phenomenon in asymmetry curves can be partially attributed to potential amine CEST effects and chemical shift average effects due to the fast exchange rate of glutamate.8,9 Figure 2 shows the GluCEST signals (a), and averaged GluCEST signals between both hemispheres (b). The GluCEST signals in all gray matter regions are higher than in the white matter regions, and the difference in signals calculated from the left and right hemispheres were not statistically significant (all p > 0.286). In the averaged GluCEST signals, the signal in the hippocampus (5.47±0.61%) is highest among the gray matter regions, followed by the signals in the rest of the midbrain (4.49±1.11%) and cortex (3.59±0.41%). The GluCEST signal in the white matter regions (-1.71±1.04%) showed statistically significant differences when compared against all gray matter regions (all p = 0.000). Figure 3 shows a GluCEST map of manually segmented brain regions (a) and overall brain area (b-c) in a representative rat. Reconstructed GluCEST maps using a modified discrete color-scale bar, (based on the average signal for each region) show a distinct contrast in all brain regions (c). Figure 4 shows the stability results of GluCEST signals for each brain region. GluCEST signals measured after 1 month in all brain regions were not significantly different from those initially measured (all p > 0.263). Figure 5 shows the 1H-MRS results in the cortex and hippocampus (a) in a representative rat and calculated glutamate concentrations (b; 7.30±0.16μmol/g for hippocampus and 6.89±0.72μmol/g for cortex).CONCLUSIONS
We demonstrated in vivo glutamate distribution in the healthy rat brain, with clear signal differences and mapping results between gray and white matter regions. Investigation of GluCEST signals in the healthy rat brain may provide important data to those researching brain diseases, in terms of providing a primary, pre-clinical database for in vivo glutamate distribution. This can also be a useful background resource for further translation to clinical research with GluCEST imaging.Acknowledgements
This work was supported by grants from the Basic Science Research Program through the National Research Foundation of Korea [NRF-2018R1C1B6004521 and NRF-2018R1A2B2007694], funded by the Korea Government (MSIT).References
1. Nakanishi S. Molecular Diversity of Glutamate Receptors and Implications for Brain-Function. Science. 1992;258(5082):597-603.
2. Nedergaard M, Takano T, Hansen AJ. Beyond the role of glutamate as a neurotransmitter. Nat Rev Neurosci. 2002;3(9):748-55.
3. Ward KM, Aletras AH, Balaban RS. A new class of contrast agents for MRI based on proton chemical exchange dependent saturation transfer (CEST). J Magn Reson. 2000;143(1):79-87.
4. van Zijl PCM, Yadav NN. Chemical Exchange Saturation Transfer (CEST): What is in a Name and What Isn't? Magn Reson Med. 2011;65(4):927-48.
5. Cai K, Haris M, Singh A, Kogan F, Greenberg JH, Hariharan H, Detre JA, Reddy R. Magnetic resonance imaging of glutamate. Nat Med. 2012;18(2):302-6.
6. Lee DH, Woo CW, Kwon JI, Chae YJ, Ham SJ, Suh JY, Kim ST, Kim JK, Kim KW, Woo DC, Lee DW. Cerebral mapping of glutamate using chemical exchange saturation transfer imaging in a rat model of stress-induced sleep disturbance at 7.0T. J Magn Reson Imaging. 2019;doi: 10.1002/jmri.26769.
7. Kim M, Gillen J, Landman BA, Zhou J, van Zijl PC. Water saturation shift referencing (WASSR) for chemical exchange saturation transfer (CEST) experiments. Magn Reson Med. 2009;61(6):1441-50.
8. Cai K, Singh A, Roalf DR, Nanga RP, Haris M, Hariharan H, Gur R, Reddy R. Mapping glutamate in subcortical brain structures using high-resolution GluCEST MRI. NMR in biomedicine 2013;26(10):1278-84.
9. Kogan F, Singh A, Debrosse C, Haris M, Cai K, Nanga RP, Elliott M, Hariharan H, Reddy R. Imaging of glutamate in the spinal cord using GluCEST. Neuroimage. 2013;77:262-7.
Figures