1955
In vivo detection of neuroinflammation in rats using Manganese-Enhanced MRI (MEMRI)1Faculty of Life Sciences, Kumamoto University, Kumamoto, Japan, 2Institute for Quantum Life Science, National Institutes for Quantum and Radiological Science and Technology (QST), Chiba, Japan
Synopsis
Neuroinflammation is initiated by many types of neural disorders as a defensive response of the innate immune system in the central nervous system (CNS). Neuroinflammation is typically accompanied by the disruption of Ca2+ homeostasis. Manganese chloride (MnCl2) is a useful positive MRI contrast agent that enters activated cells through Ca2+ channels, and is utilized in Manganese-Enhanced MRI (MEMRI) for functional neuroimaging. We sought to determine whether MEMRI could be used to assess the cellular/molecular alterations caused by acute neuroinflammation in vivo, by focusing on Mn2+ accumulation in the rodent brain.
Introduction
Acute neuroinflammation, initiated by trauma, infection, stroke and toxins, is the rapid and short-lived activation of the innate immune system in the CNS [1]. These inflammatory responses are commonly characterized by highly activated glial cells, which produce reactive oxygen species (ROS) and release proinflammatory cytokines. Proinflammatory cytokines and ROS are known to disrupt Ca2+ homeostasis in neuronal cells [2]. Therefore, it is possible that the disruption of Ca2+ homeostasis could be a good biomarker for the in vivo functional/molecular imaging of neuroinflammation. A technique referred to as MEMRI utilizes MnCl2 as a contrast agent for the in vivo imaging of brain function in animals. Mn2+ is an analogue of Ca2+, and it can enter excitable neurons and reactive glial cells, mainly via voltage-gated calcium channels [3–5]. MEMRI reflects the Ca2+ influx into excitable neurons and activated glial cells, we hypothesized that neuroinflammation could be detectable by MEMRI. In this study, we used a rat model, in which experimental acute neuroinflammation was triggered by an intracerebroventricular injection of lipopolysaccharide (LPS). We sought to determine whether MEMRI could be used to assess the alterations caused by acute neuroinflammation in vivo, by focusing on Mn2+ accumulation in the rodent brain.Materials and Methods
Nine male Sprague-Dawley rats were randomly divided into two groups, consisting of LPS treated (n = 4) and control (n = 5) rats. All MRI scans were performed on a 7T scanner, with a volume resonator for transmission and an 8 channel rat brain phased array coil for reception (Bruker). During the MRI scan, all rats were anesthetized with 2.0% isoflurane. At 0 h, baseline T1-weighted and T2-weighted MRI scans were performed for all of the animals (Fig. 1). For the LPS-treated group, LPS was injected via the left cerebral ventricle, while for the control group, to assess the effects of manipulation, the same operation was performed, but only saline was injected. Sterile saline was also administered to the contralateral side in both groups. At 48 h after the LPS or saline injection, we measured the T1-weighted and T2-weighted images, and performed quantitative T1 and T2 mapping without contrast agents. Thereafter, 50 mM of MnCl2 (100 mg/kg, Sigma Aldrich) was slowly administered through the tail vein for 1 h. MEMRI data were acquired exactly 24 h after MnCl2 administration for all groups. Finally, perfusion fixation was performed, and the brain was carefully extracted for immunohistochemical staining with HE, Iba1, ED1 and GFAP.Results
The volumetric MRI analysis revealed that the LPS administration caused a significant increase in the volume of the LPS-injected lateral ventricle. In the third ventricle, no apparent volumetric changes were observed in any groups (Fig. 2 and Table 1). The T1- and T2-weighted images acquired before MnCl2 administration showed no significant differences between the LPS-treated and control groups, in terms of the signal intensity in the brain parenchyma (e.g., hippocampus and hypothalamus) (Fig. 2). MEMRI signal enhancement at 24 h after the MnCl2 injection was observed throughout the cerebral cortex, thalamus and hippocampus, for the saline-treated control group (Fig. 3A, right). In the LPS-treated animals, the signal intensity in the hippocampus was even more enhanced, in comparison with that of the controls (Fig. 3A, left). To quantitatively evaluate the accumulation of Mn2+ in brain tissues, we performed T1 mapping using the saturation recovery RARE sequence, before and after the MnCl2 administration (Fig. 3B). The ROIs were defined in the hippocampus (CA2 and CA3) of each animal, based on the T1-weighted MEMRI and a rat brain atlas [6] (Fig. 3A). The ratio of R1 before and after Mn2+ injection (R1(post) / R1(pre)) in the LPS-treated hemisphere was statistically larger in the hippocampus (CA2) (1.96 ± 0.15), in comparison with the control (Fig. 3B and 3C, p < 0.05). This indicates that the increase in R1, reflecting the high Mn2+ accumulation, is attributable to the LPS-induced neuroinflammation in the hippocampus. To investigate whether the LPS injection affected the brain tissue, we performed HE staining, Iba1 and ED1 immunostaining to detect activated microglia/macrophages, and GFAP immunostaining to detect reactive astroglia (Fig. 4). Iba1-positive cells and ED1-positive cells were observed in throughout the hippocampus and in part of the cerebral cortex surrounding the lateral ventricle. In contrast, the numbers of Iba1- and/or ED1-positive cells for the control group were much lower than those for the LPS-treated group. The GFAP immunostaining, which confers a brown color to the astroglia, was similar for both groups.Discussion
In the hippocampus, the MEMRI signal of the neuroinflammation model (induced by intracerebroventricular administration of LPS) was significantly higher than that of the normal model, and the enhanced area corresponded to the areas with Iba1- and ED1-positive microglia. This result indicates that MEMRI signal enhancement, due to the accumulation of activated microglia as well as enhanced Mn2+ influx via Ca2+ channels, may reflect LPS-induced acute neuroinflammation.Conclusion
MEMRI is an attractive non-invasive method for the detection of inflammatory CNS disorders.Acknowledgements
The authors thank Dr. Daisuke Kokuryo and Dr. Jeff Kershaw (QST) for helpful advice.References
- Popovich, P.G. and Longbrake, E.E. (2008) Can the immune system be harnessed to repair the CNS? Nat. Rev. Neurosci. 9, 481–493.
- Gleichmann, M. and Mattson, M.P. (2011) Neuronal calcium homeostasis and dysregulation. Antioxid. Redox. Signal. 14, 1261–1273.
- Drapeau, P. and Nachshen, D.A. (1984) Manganese fluxes and manganese-dependent neurotransmitter release in presynaptic nerve endings isolated from rat brain. J. Physiol. 348, 493–510.
- Itoh, K., Sakata, M., Watanabe, M., Aikawa, Y., and Fujii, H. (2008) The entry of manganese ions into the brain is accelerated by the activation of N-methyl-D-aspartate receptors. Neuroscience 154, 732–740.
- Kita, H., Narita, K., and Van der Kloot, W. (1981) Tetanic stimulation increases the frequency of miniature end-plate potentials at the frog neuromuscular junction in Mn2+-, CO2+-, and Ni2+-saline solutions. Brain Res. 205, 111–121.
- Paxinos, G. and Watson, C. (1998) The Rat Brain in Stereotaxic Coordinates. Academic Press. San Diego.
Figures
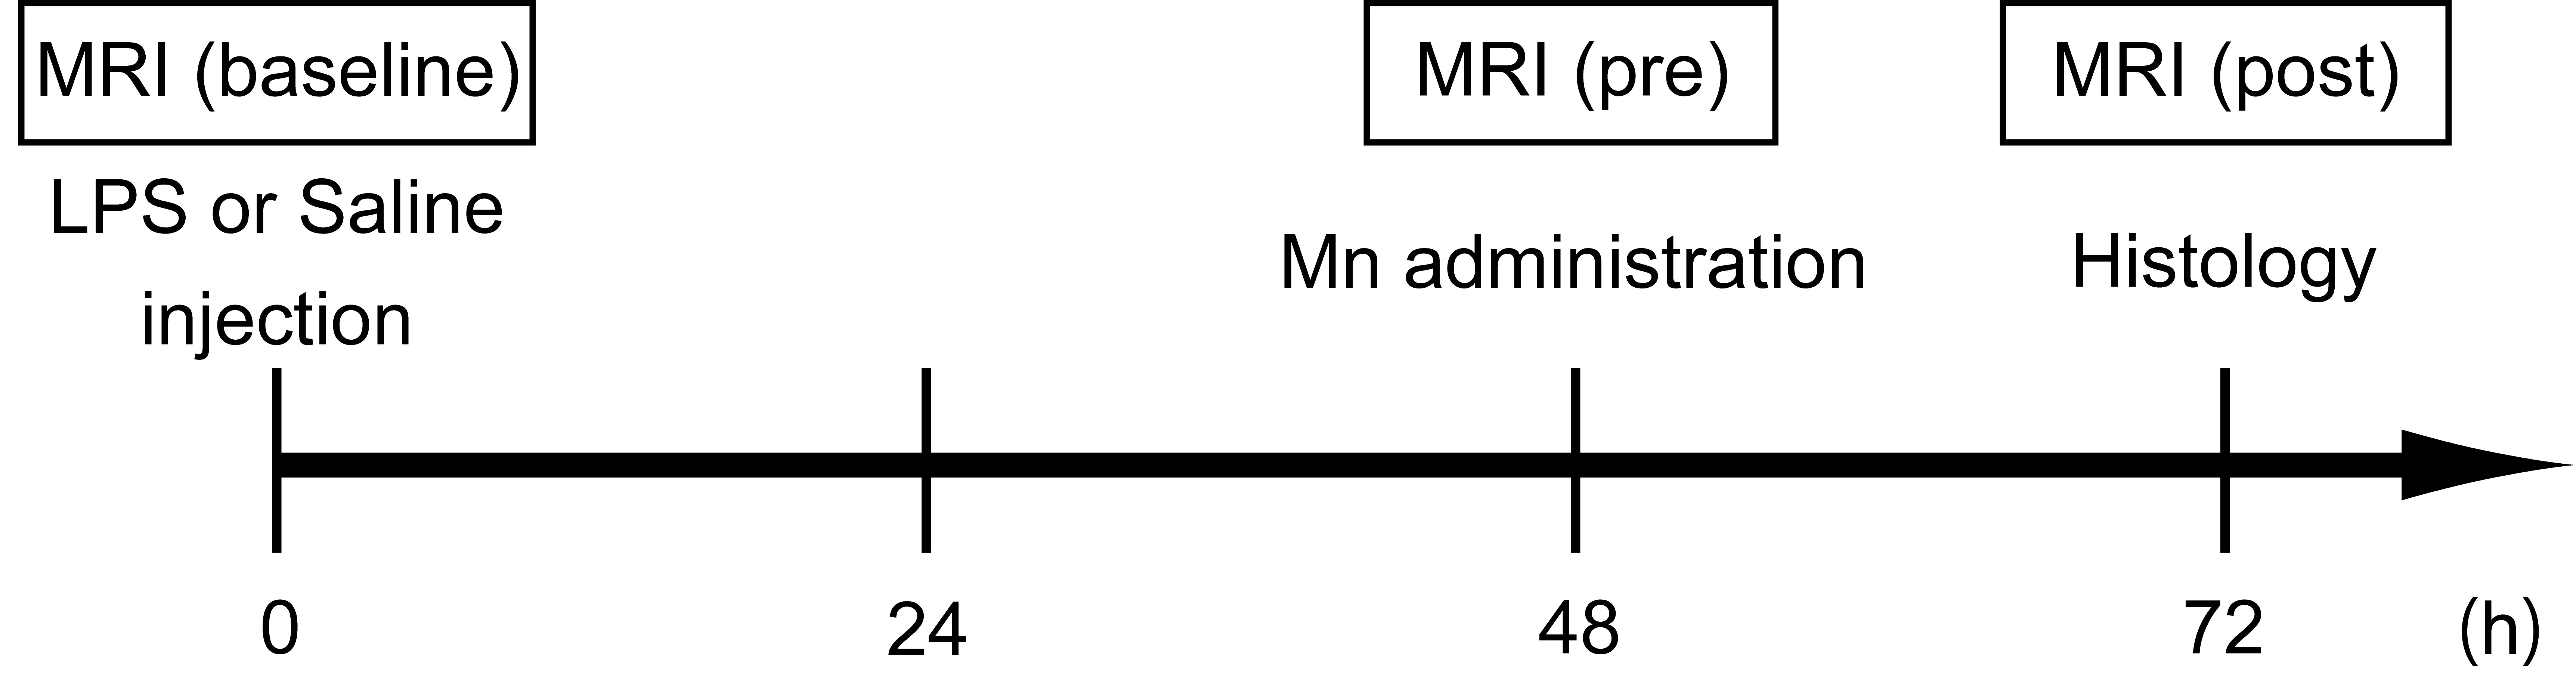
Fig. 1 Experimental scheme
At first, MR images were obtained without LPS/MnCl2 administration, to evaluate the baseline in all rats. Subsequently, LPS was injected, to induce inflammatory responses in the rat brain. In both groups, saline was also injected in the contralateral side of the brain. MRI scans were performed at 48 h after the LPS or saline injection. Thereafter, MnCl2 was administered via the tail vein. MRI measurements were performed again at 24 h after the systemic MnCl2 administration. Finally, all rats were sacrificed for immunohistological experiments.
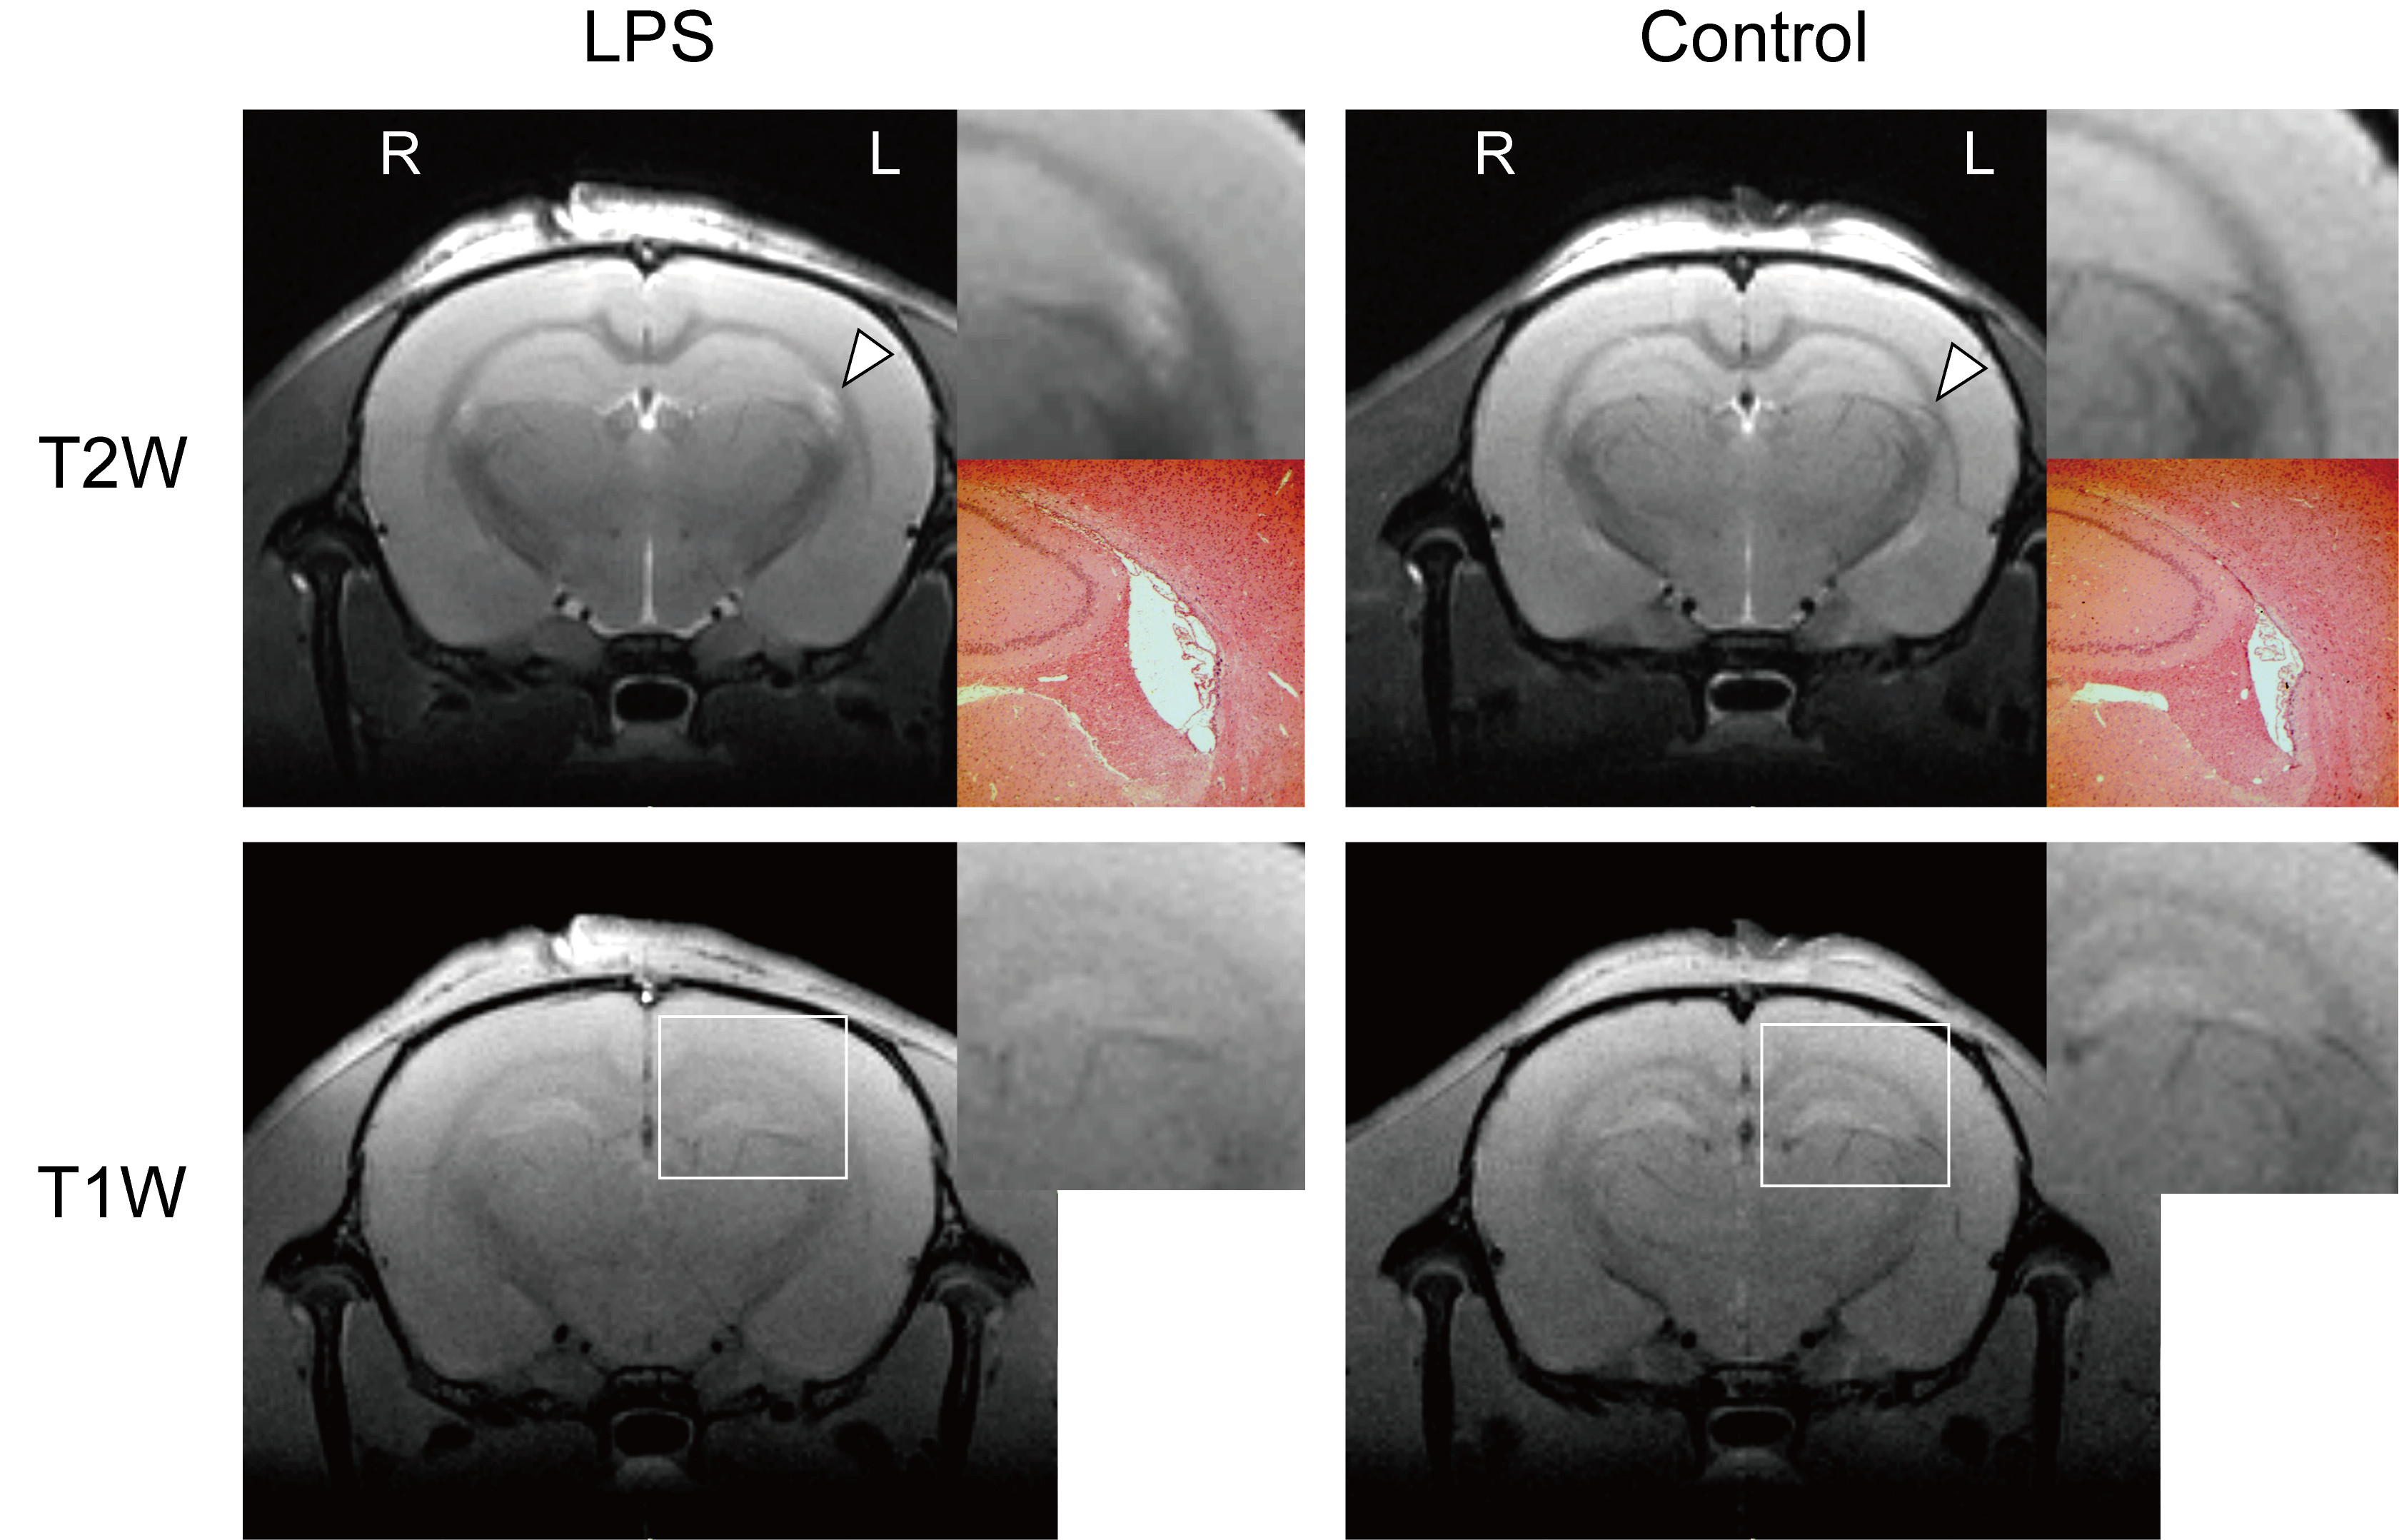
Fig. 2 Evaluation of morphological changes from typical T2- and T1-weighted MR images and immunohistochemical staining
(Top row) T2-weighted images. High signals in the LPS-treated lateral ventricle were observed for the LPS group, but not for the control group (arrowheads). The inset (above right) is an enlargement of the lateral ventricle. The inset (below right) shows HE staining of the lateral ventricle. (Bottom row) T1-weighted images. No differences were detected between the control and LPS-treated rats. The inset is an enlargement of the hippocampus.
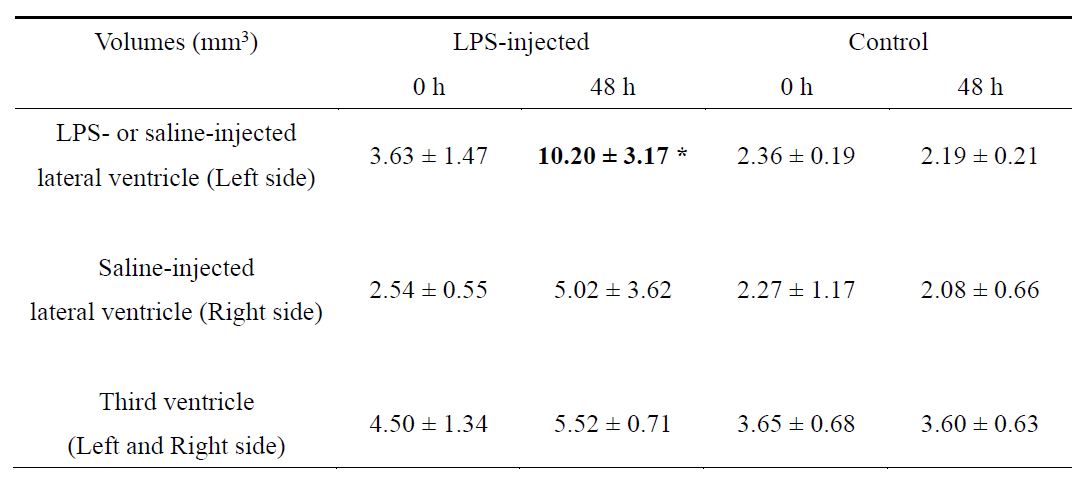
Table 1
Lateral and third ventricle volumes for LPS-treated and control rats
* Significantly different between 0 h and 48 h (p < 0.05; Mann-Whitney U-test).
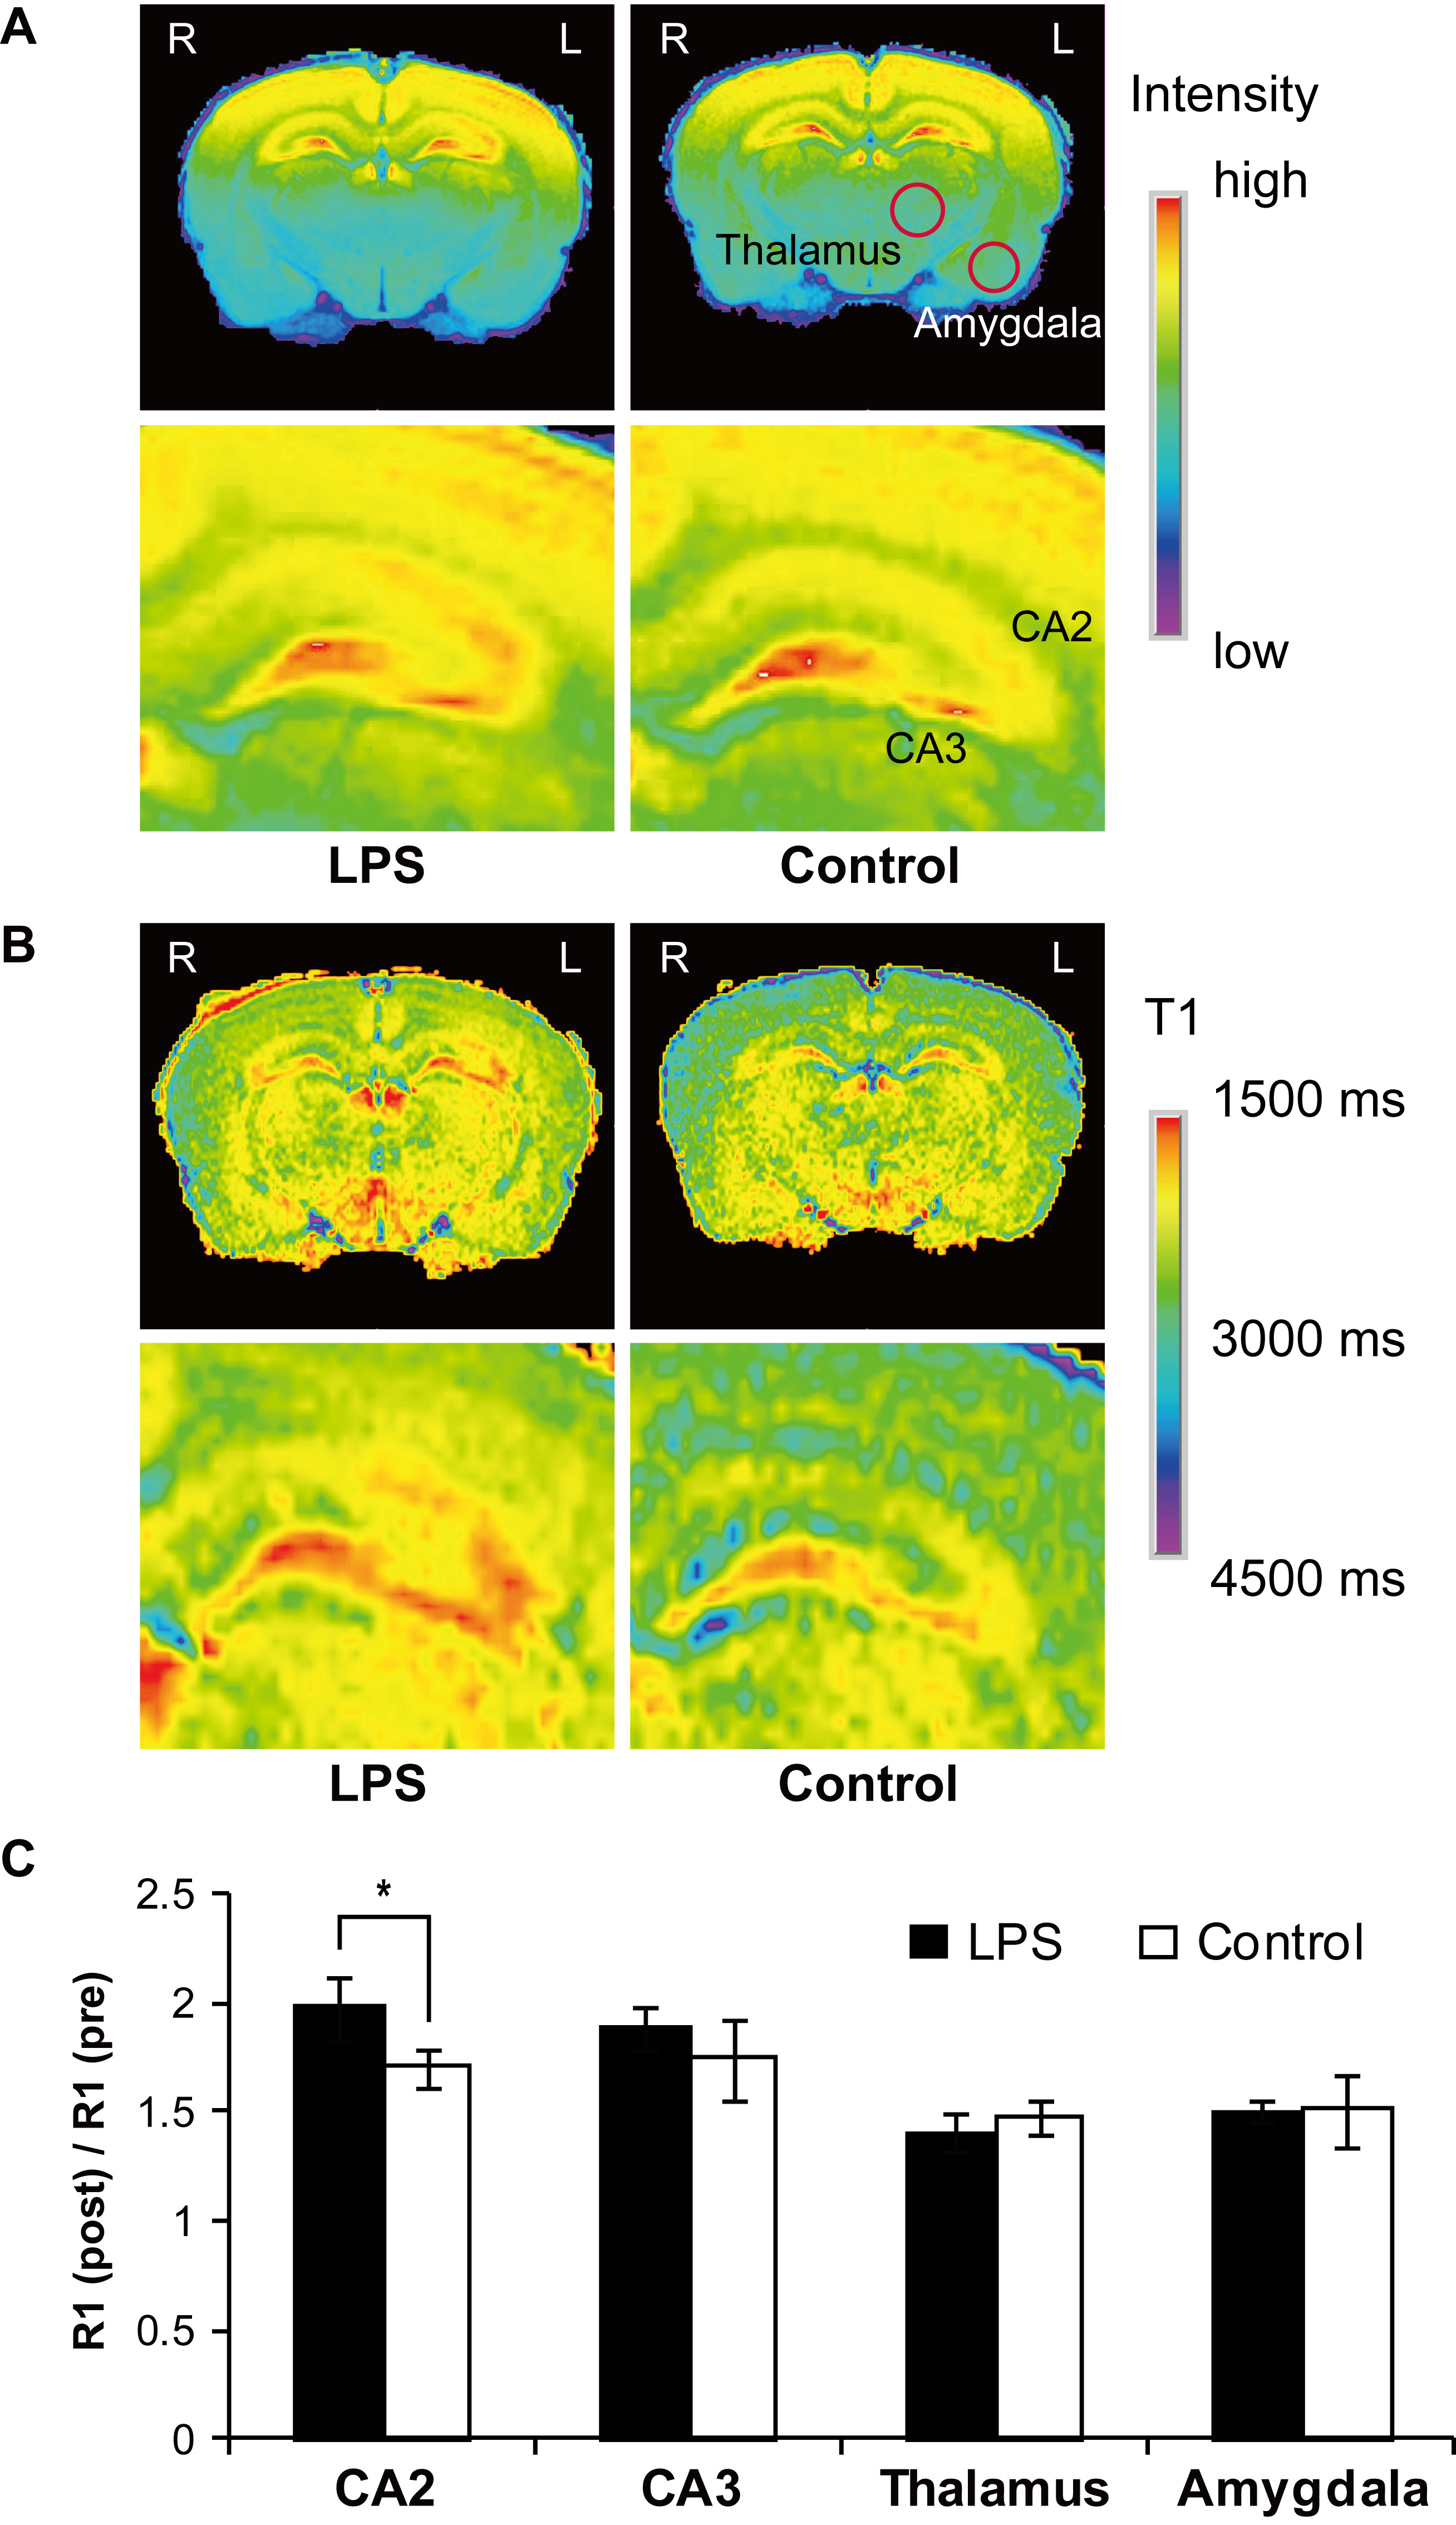
Fig. 3 Changes in the signal intensity and R1 in MEMRI of the brain
(A) T1-weighted MR images. The bottom row shows magnified T1-weighted MR images of the hippocampus. Additional signal enhancements were detected in the hippocampus for the LPS-treated group, in comparison with the control. (B) T1 maps. The bottom row shows magnified T1 maps of the hippocampus. Lower T1 values correspond to hyperintense signals on T1-weighted MEMRI. (C) R1 enhancement after MnCl2 injection. The R1 enhancement in the hippocampus (CA2) in the LPS group was larger than that in the control.
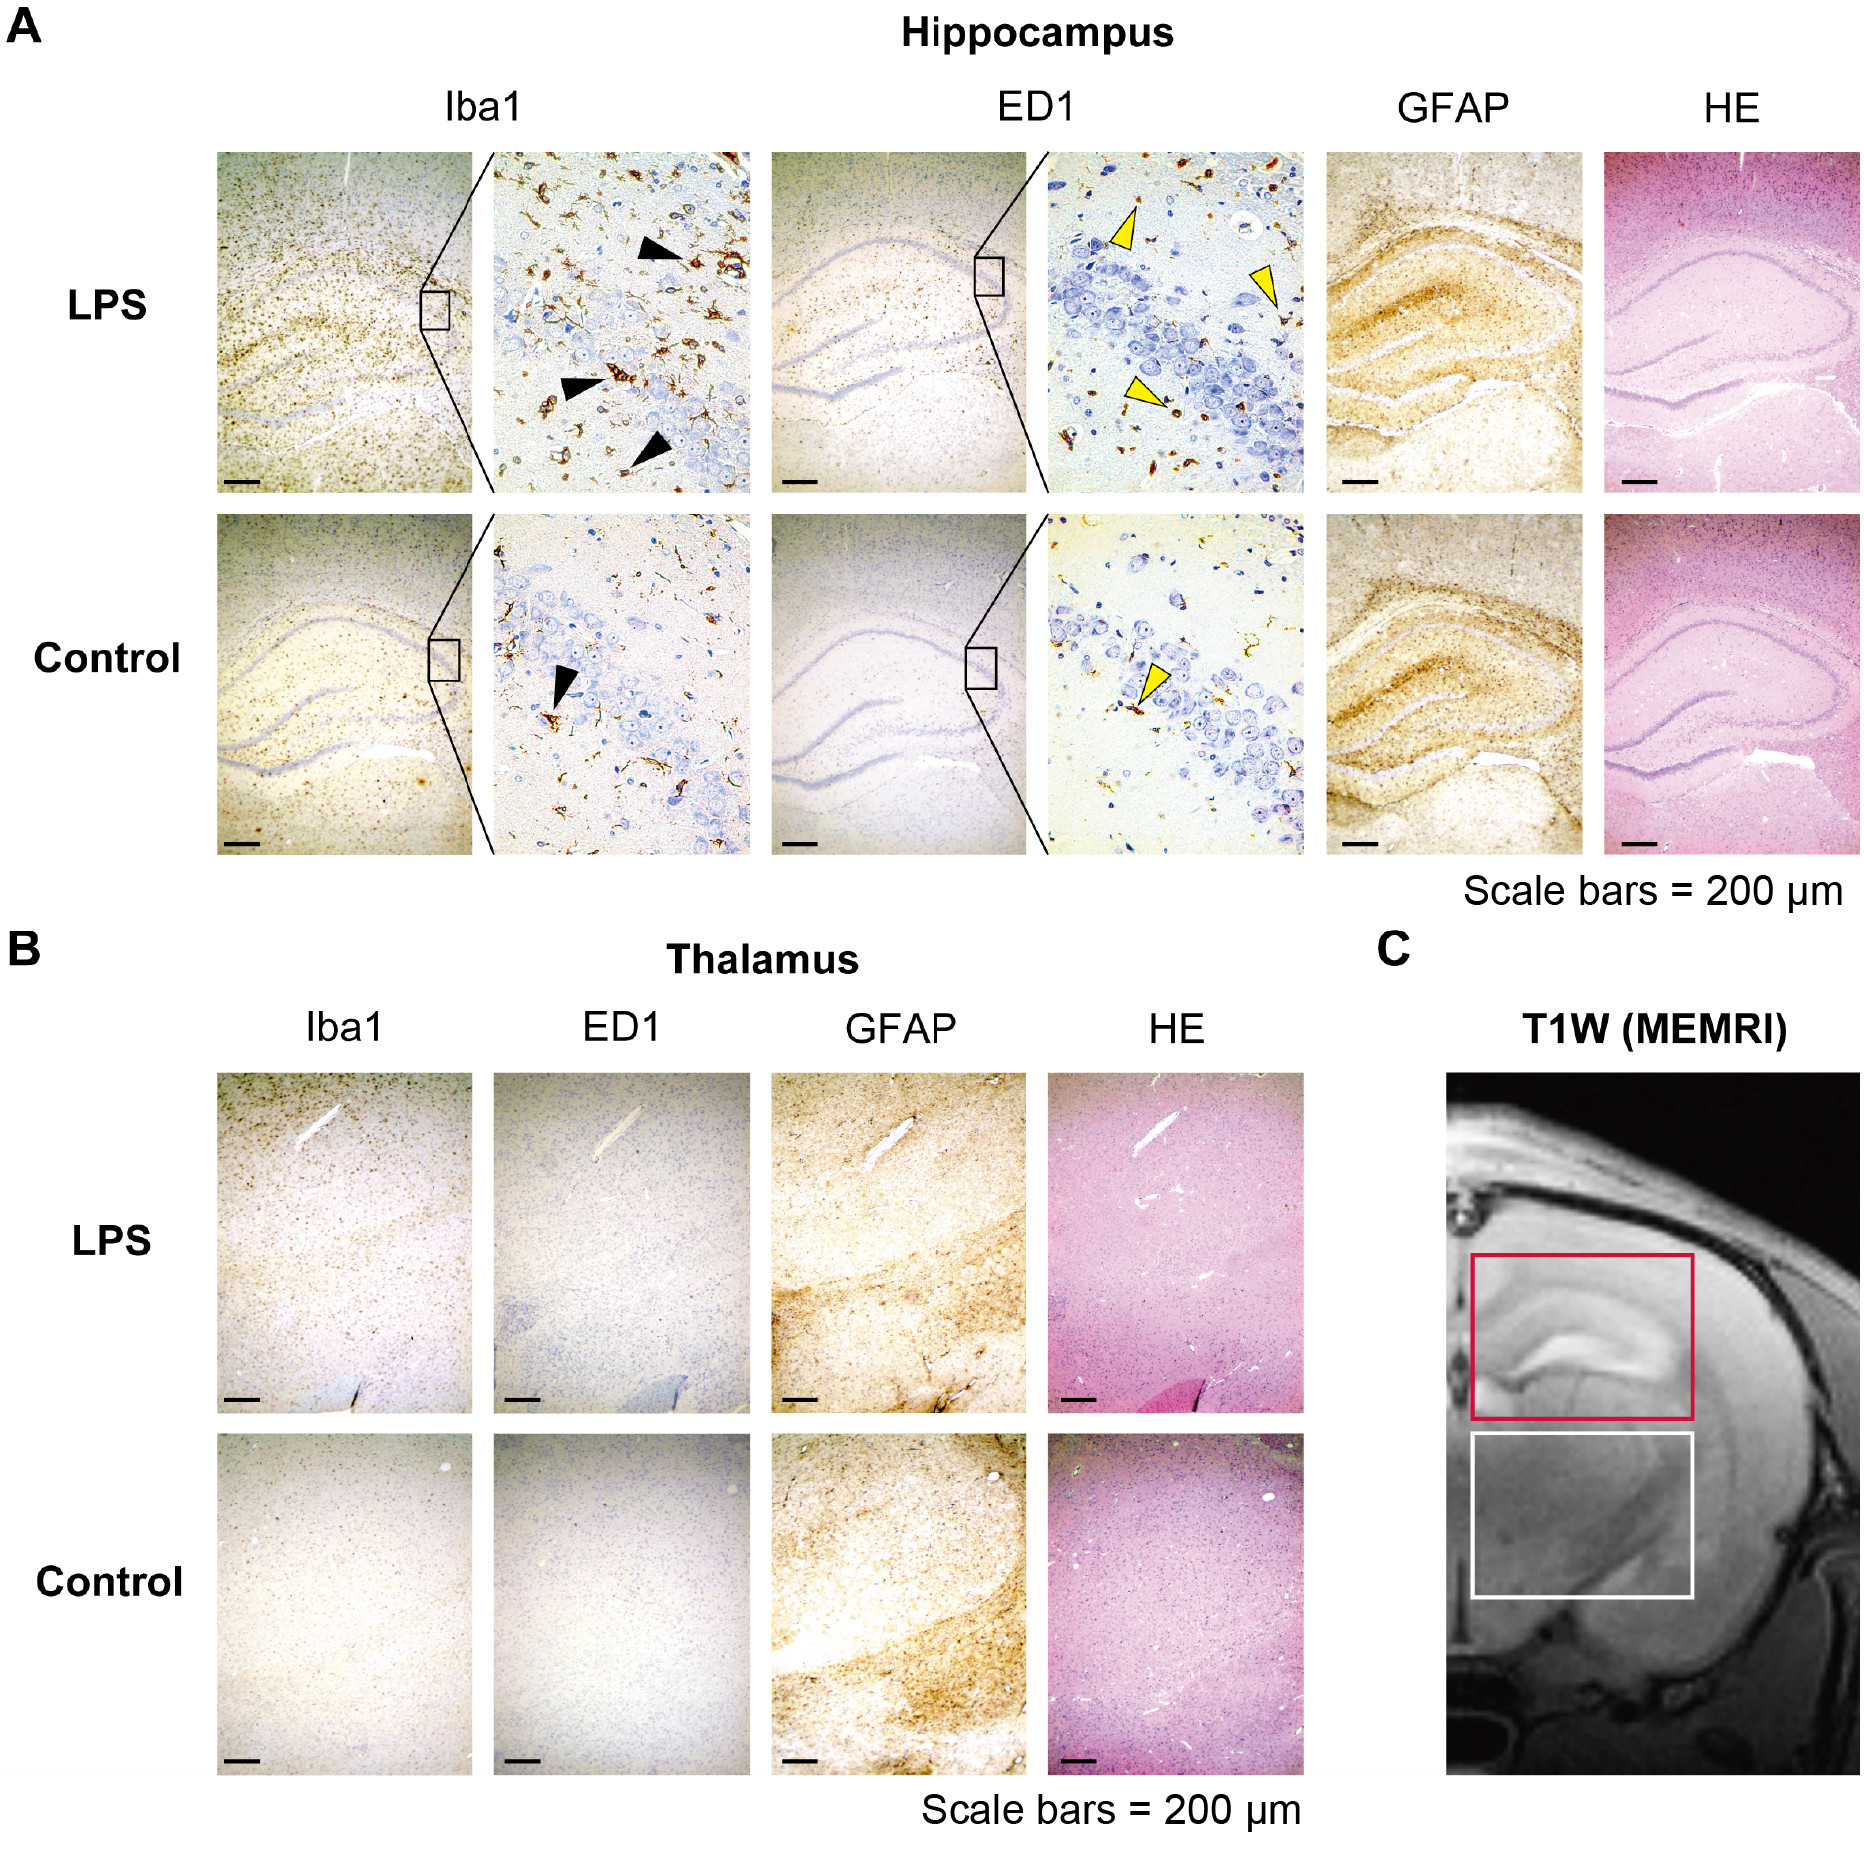
Fig. 4 Comparison of MEMRI and immunohistochemical staining
(A) Immunohistochemical staining of the hippocampus. The area with Iba1- and ED1-positive cells corresponded to the area of signal enhancement on MEMRI for the LPS group (enlarged region). The magnified image shows the CA2 region of the hippocampus. Activated microglia was visualized by staining with Iba1 and ED1. (B) Immunohistochemical staining of the thalamus. (C) T1-weighted MR image. The red and white squares indicate the regions displaying the hippocampus and thalamus in the histochemical staining, respectively.