1953
Stimulation of basal forebrain cholinergic neurons induces decreased functional connectivity in the default mode-like network in rats1Bio-Imaging Lab, University of Antwerp, Antwerp, Belgium
Synopsis
Understanding the role of the basal forebrain (BFB) in controlling the dynamics of brain processes is of great interest. We aimed to investigate the influence of selective unilateral stimulation of BFB cholinergic neurons on functional connectivity (FC) in the rodent default-mode like network (DMLN). By combining resting-state functional MRI (rsfMRI) with chemogenetics, we demonstrate that stimulation of the cholinergic neurons in the right BFB significantly decreased right intra-hemispheric and inter-hemispheric FC in the DMLN in rats. These findings provide new critical insights into the interplay between attentional networks and DMLN in rodents.
INTRODUCTION
The role of the basal forebrain (BFB) in controlling the dynamics of large-scale functional networks, such as the default-mode network (DMN), are of great interest. Previous studies have shown that the cholinergic corticopetal neurons originating from the BFB are strongly involved in attentional processes [1-5]. During attention-demanding tasks, the increased activity in the attention networks has been shown to be associated with decreased activity in the DMN [6, 7]. Although this antagonistic relationship between both networks could be repeatedly replicated, the underlying mechanisms remain to be fully understood. Interestingly, recent studies proposed that the BFB plays a role in the regulation of the DMN [8]. Here, we aim to investigate the influence of selective unilateral stimulation of BFB cholinergic neurons on functional connectivity (FC) in the rodent default-mode like network (DMLN).METHODS
Adult Long Evans rats (n=28) were subjected to stereotactic surgery targeting the right basal forebrain with an adeno-associated (AAV) virus. Rats received either (n=16), AAV8-hSyn_DIO_hM3Dq(gq)-mCherry (Addgene, #44361), for the expression of DREADDs in cholinergic neurons or a control virus (n=12), AAV8-hSyn-DIO-mCherry (Addgene, #50459). Ex vivo evaluation of the DREADDs expression showed that expression was limited to cholinergic neurons in the right basal forebrain, indicating a successful cell-type specific transfection (fig 1). All imaging procedures started at least six weeks after viral injections and were performed on a 9.4 T MRI system (Bruker Biospec, Germany). For all scans rats were anesthetized with an intravenous (i.v.) bolus of 0.05 mg/kg medetomidine, followed by a i.v. infusion of 0.1 mg/kg/h medetomidine and 0.2% isoflurane. RsfMRI scans started at 35 minutes after the medetomidine bolus injection and were acquired using a T2* weighted echo planar imaging (EPI) sequence (TE: 18 ms, TR: 2000ms, FOV: (30 x 30) mm2, matrix [128 x 96], 16 slices of 0.8 mm). First, a 5-minute baseline rsfMRI was acquired. Second, a 20 minute rsfMRI scan was acquired during which the CNO or vehicle (i.e. saline) was intravenously administered at 5 minutes after the start of the scan. Then, a final 5 minute rsfMRI scan was acquired. These three scans were acquired during one scan session. Two scan sessions were acquired for each animal in the DREADDs-expressing group, during which the effect of either CNO or vehicle was evaluated. One scan session was acquired for each animal in the control group to evaluate the off-target effects of CNO. Breathing rate, temperature and blood oxygenation were monitored during the scan sessions. All data was processed using SPM12 and REST v1.8 in Matlab 2014a. Statistical analysis was performed using SPM12, JMP and GraphPad Prism 6.RESULTS & DISCUSSION
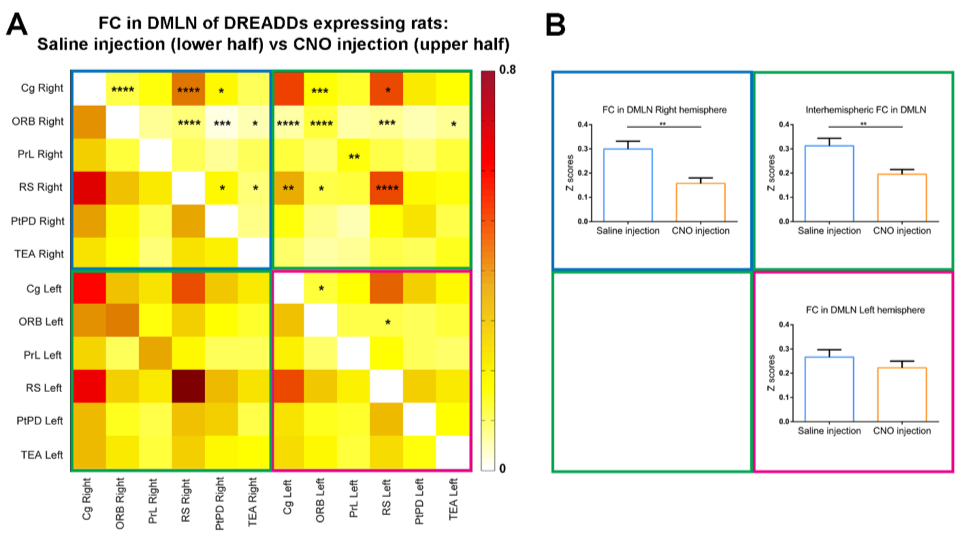
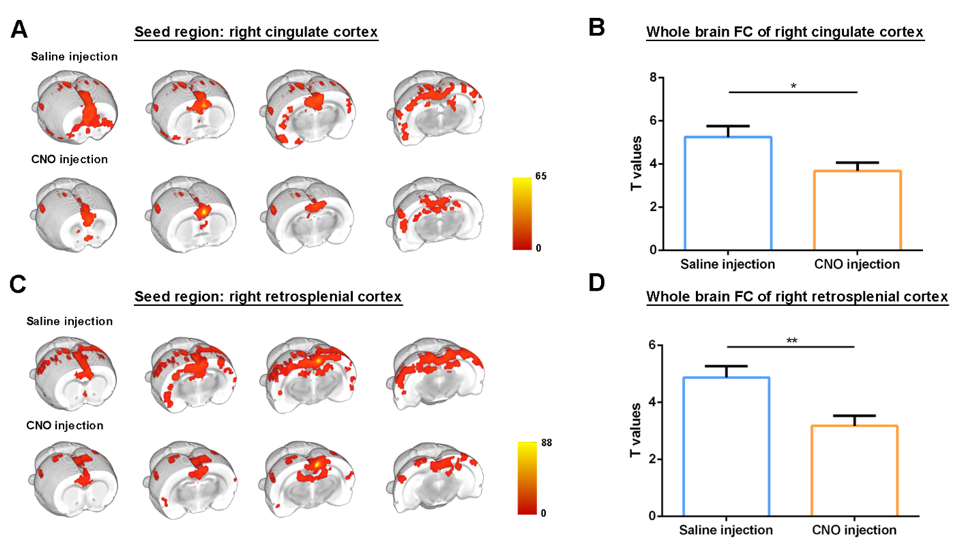
Regions of interest (ROIs) were drawn in brain regions of the DMLN in rats and their FC alterations were followed up over time after administration of Clozapine-N-oxide (CNO). It has been demonstrated that DREADDs-induced neural activity modulations become apparent at 5 minutes after administration of its ligand CNO and lasts for at least 1 hour [9]. Similarly, in this study, significantly decreased FC in the right DMLN could be observed in the DREADDs-expressing rats starting at 5 – 10 minutes post-CNO injection which reached a plateau after 10-15 minutes (fig 2). Next, to better understand the effect of right BFB stimulation on bilateral DMLN FC, a ROI-based analysis was performed using bilateral DMLN ROIs. Results demonstrated that CNO-induced stimulation of the right BFB cholinergic system significantly decreased the FC between various DMLN ROI pairs (fig 3A). Additionally, comparing the average intra-hemispheric and inter-hemispheric FC of the DMLN between both groups revealed significantly decreased FC in the right hemisphere and between both hemispheres (fig 3B). Furthermore, a seed based analysis on two hub regions of the DMLN showed significant decreases in FC after injection of CNO (fig 4). In contrast, CNO injection in the sham group and saline injection in the DREADDs-expressing animals, did not elicit FC alterations. Interestingly, various functional imaging studies have identified anti-correlations between the attentional networks, or “task-positive networks” and the DMN or “task-negative network” [6, 10, 11]. Additionally, a recent study in humans demonstrated that negative BOLD responses in DMN brain regions can be induced by the presentation of random flashing checkerboard visual stimuli [12]. Other studies observed significantly decreased FC in the DMN when subjects were preforming a cognitive task [13, 14]. More recently, Hinz et al. (2019) evaluated the BOLD responses in DMLN regions upon visual stimulation in sedated rats. The authors demonstrated that visual stimulation could deactivate nodes of the DMLN which was associated with decreased FC within the DMLN [15]. The similarity between the latter finding and our results might suggest involvement of the basal forebrain cholinergic system in mediating decreased FC in DMLN upon presentation of visual stimuli in sedated rats.CONCLUSION
Our study demonstrates decreased right intra- and interhemispheric FC in the DMLN upon activation of basal forebrain cholinergic neurons in sedated rats. We conjecture that our DREADDs-induced stimulation mediates decreased DMLN FC through similar pathways as task-related DMLN suppression. To conclude, our findings provide new critical insights into the interplay between attentional networks and DMLN in rodents.Acknowledgements
This study was supported by the Fund of Scientific Research Flanders (FWO G048917N) and the Research Fund of the University of Antwerp (BOF DOCPRO FFB150340). Johan van Audekerke provided excellent technical support. We thank Dr. Gaurav Majumdar for supervising the immunohistochemistry as well as Prof. Dr. Timmermans and Dr. Pintelon from the Laboratory of Cell Biology and Histology from the University of Antwerp for acquiring the histological images presented in Fig 1. The Leica SP 8 (Hercules grant AUHA.15.12) microscope was funded by the Hercules Foundation of the Flemish Government. The computational resources and services used in this work were provided by the HPC core facility CalcUA of the University of Antwerp, the VSC (Flemish Supercomputer Center), funded by the Hercules Foundation and the Flemish Government – department EWI.References
1. Chudasama, Y., et al., Cholinergic modulation of visual attention and working memory: dissociable effects of basal forebrain 192-IgG-saporin lesions and intraprefrontal infusions of scopolamine. Learn Mem, 2004. 11(1): p. 78-86.
2. Dalley, J.W., et al., Cortical cholinergic function and deficits in visual attentional performance in rats following 192 IgG-saporin-induced lesions of the medial prefrontal cortex. Cereb Cortex, 2004. 14(8): p. 922-32.
3. Gritton, H.J., et al., Cortical cholinergic signaling controls the detection of cues. Proc Natl Acad Sci U S A, 2016. 113(8): p. E1089-97.
4. Howe, W.M., et al., Prefrontal cholinergic mechanisms instigating shifts from monitoring for cues to cue-guided performance: converging electrochemical and fMRI evidence from rats and humans. J Neurosci, 2013. 33(20): p. 8742-52.
5. Parikh, V., et al., Prefrontal acetylcholine release controls cue detection on multiple timescales. Neuron, 2007. 56(1): p. 141-54.
6. Fox, M.D., et al., The human brain is intrinsically organized into dynamic, anticorrelated functional networks. Proc Natl Acad Sci U S A, 2005. 102(27): p. 9673-8.
7. Fransson, P., Spontaneous low-frequency BOLD signal fluctuations: an fMRI investigation of the resting-state default mode of brain function hypothesis. Hum Brain Mapp, 2005. 26(1): p. 15-29.
8. Nair, J., et al., Basal forebrain contributes to default mode network regulation. Proc Natl Acad Sci U S A, 2018. 115(6): p. 1352-1357.
9. Alexander, G.M., et al., Remote control of neuronal activity in transgenic mice expressing evolved G protein-coupled receptors. Neuron, 2009. 63(1): p. 27-39.
10. Greicius, M.D., et al., Functional connectivity in the resting brain: a network analysis of the default mode hypothesis. Proc Natl Acad Sci U S A, 2003. 100(1): p. 253-8.
11. Schwarz, A.J., et al., Anti-correlated cortical networks of intrinsic connectivity in the rat brain. Brain Connect, 2013. 3(5): p. 503-11.
12. Razlighi, Q.R., Task-Evoked Negative BOLD Response in the Default Mode Network Does Not Alter Its Functional Connectivity. Front Comput Neurosci, 2018 .(12): p.67.
13. Fransson, P., How default is the default mode of brain function? Further evidence from intrinsic BOLD signal fluctuations. Neuropsychologia, 2006. 44(14): p. 2836-45.
14. Gao, W., et al., The dynamic reorganization of the default-mode network during a visual classification task. Front Syst Neurosci, 2013. 7: p. 34.
15. Hinz, R., et al., Bottom-up sensory processing can induce negative BOLD responses and reduce functional connectivity in nodes of the default mode-like network in rats. Neuroimage, 2019. 197: p. 167-176.
Figures
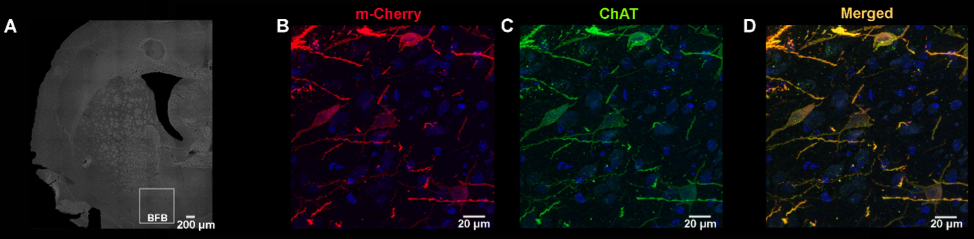
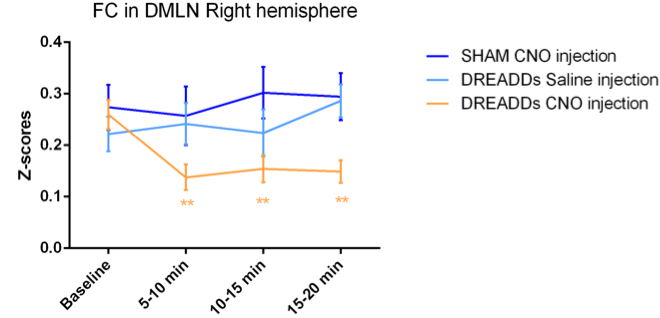
Fig. 2: DREADD-induced decreased FC in the right DMLN. Quantification of the FC strength in the right DMLN (z-scores) in different time-windows demonstrated significant decreases only after CNO injection in the DREADD-expressing group (orange). Saline injections in the same group (light blue) or CNO-injections in sham animals (dark blue) demonstrated no significant changes in comparison to baseline. Linear mixed model with Student’s T correction for multiple comparisons, ** p≤0.01