1952
Aryl hydrocarbon receptor antagonism before reperfusion attenuates cerebral ischemia/reperfusion injury in rats1Asan Institute for Life Sciences, Asan Medical Center, Seoul, Korea, Republic of, 2Convergence Medicine, University of Ulsan College of Medicine, Seoul, Korea, Republic of, 3Radiology, Asan Medical Center, Seoul, Korea, Republic of
Synopsis
Emerging evidence suggests that aryl hydrocarbon receptor (AhR) antagonism could attenuate neuronal damage caused by transient ischemic stroke. However, the optimal timing of AhR antagonist administration for maximum neuroprotective efficacy has yet to be established. The present study explored this issue via MRIs in rats with transient ischemic stroke and demonstrated that infarct volume and apoptosis were alleviated in rats that received AhR antagonists 10 or 50 minutes after ischemia. In addition, the timing of AhR antagonist administration was shown to affect edema formation caused by transient ischemic stroke.
INTRODUCTION
Recent studies suggest that aryl hydrocarbon receptor (AhR) antagonism can mitigate cellular damage associated with cerebral ischemia and reperfusion (I/R) injury by apoptosis.1-3 This study evaluated the neuroprotective effects of AhR antagonists when administered before reperfusion in a rat cerebral acute stroke model, and whether the timing of AhR antagonist administration influenced its neuroprotective effects as assessed by magnetic resonance imaging (MRI) and histological analysis.METHODS
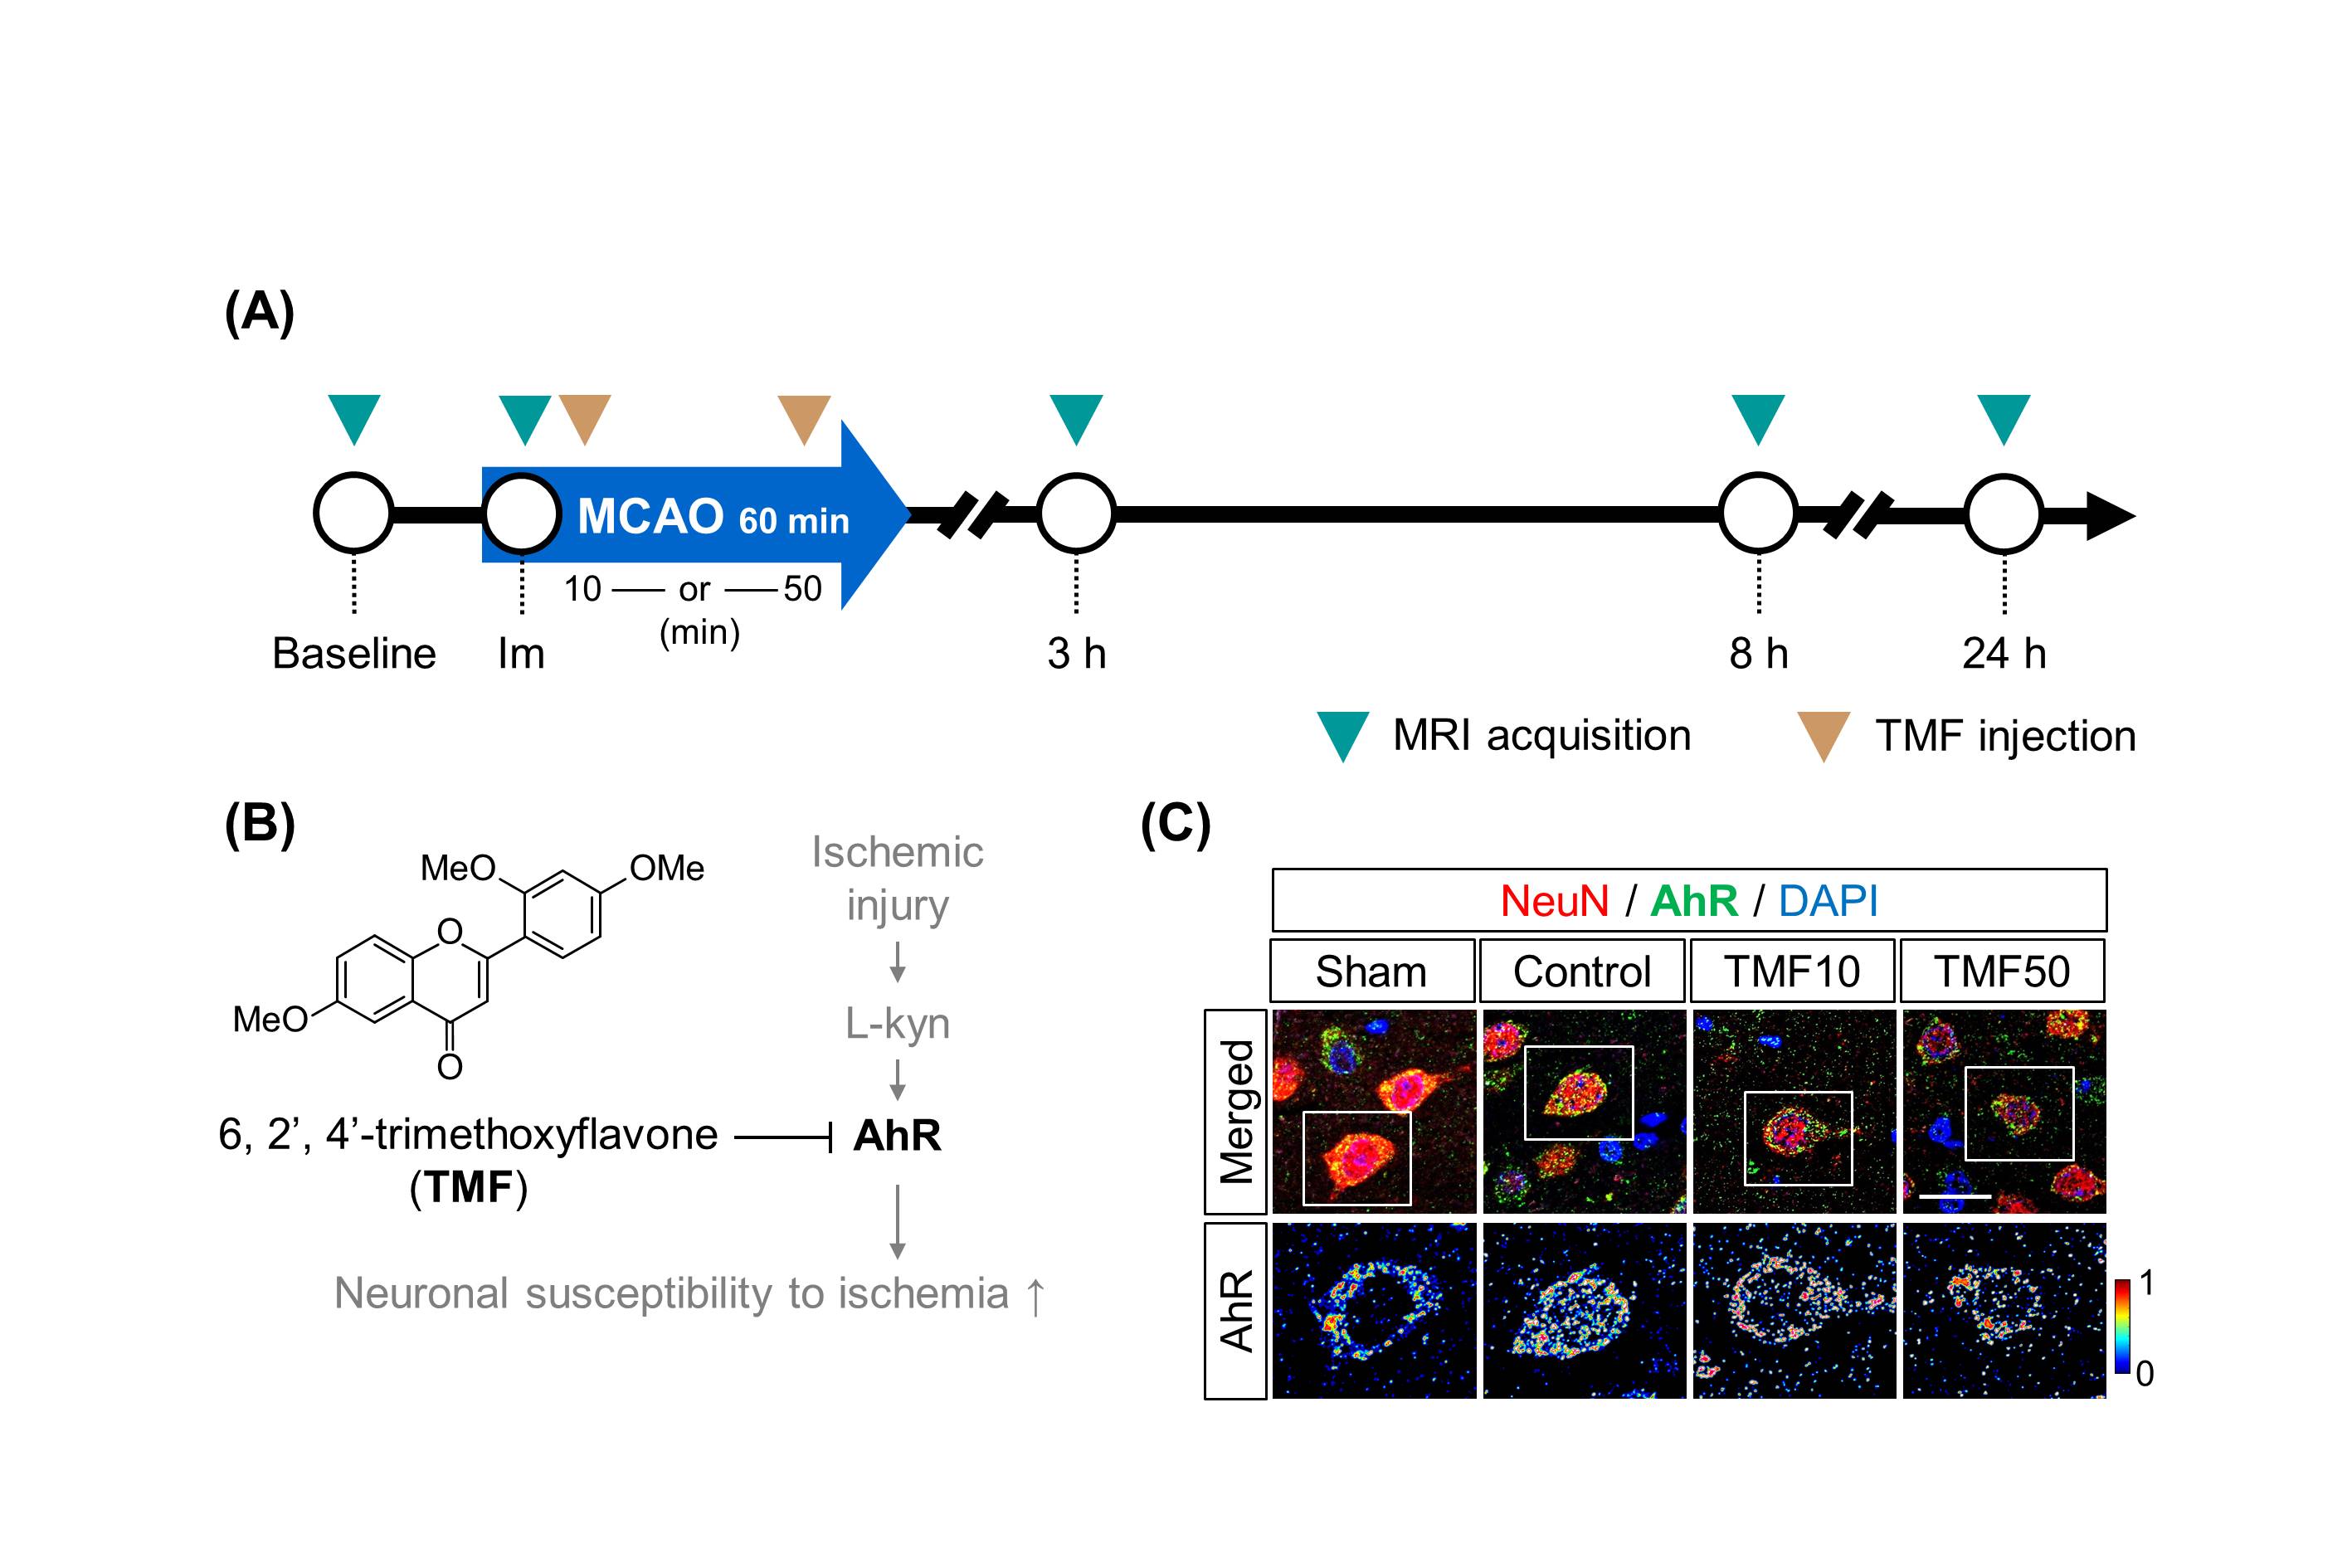
Animal model A transient middle cerebral artery (MCA) occlusion via temporary intraluminal thread insertion for 60 minutes was used to generate cerebral I/R injury in a rat model. Five mg/kg of 6,2',4'-trimethoxyflavone (TMF) dissolved in dimethyl sulfoxide (DMSO) was used as an AhR antagonist. Thirty-two rats were randomly divided into four groups: sham (no I/R injury), control (I/R injury), TMF10, and TMF50 (TMF administration 10 and 50 minutes after ischemia, respectively) groups. Rats were sacrificed 24 hours after ischemia, and apoptotic cells were detected using a terminal deoxynucleotidyl transferase dUTO nick end labeling (TUNEL) assay. AhR immunodetection was conducted by rabbit polyclonal antibody against AhR and mouse monoclonal antibody anti-neuronal nuclei (NeuN) in brain tissue.MRI Scans were taken at baseline (before ischemia), immediately after, and 3, 8, and 24 h after ischemia (Fig. 1). The MRI protocol consisted of T2-weighted images (T2-WIs), T2 maps, and apparent diffusion coefficient (ADC) maps. T2 maps were not obtained immediately after ischemia because it is insensitive to ischemic alteration.
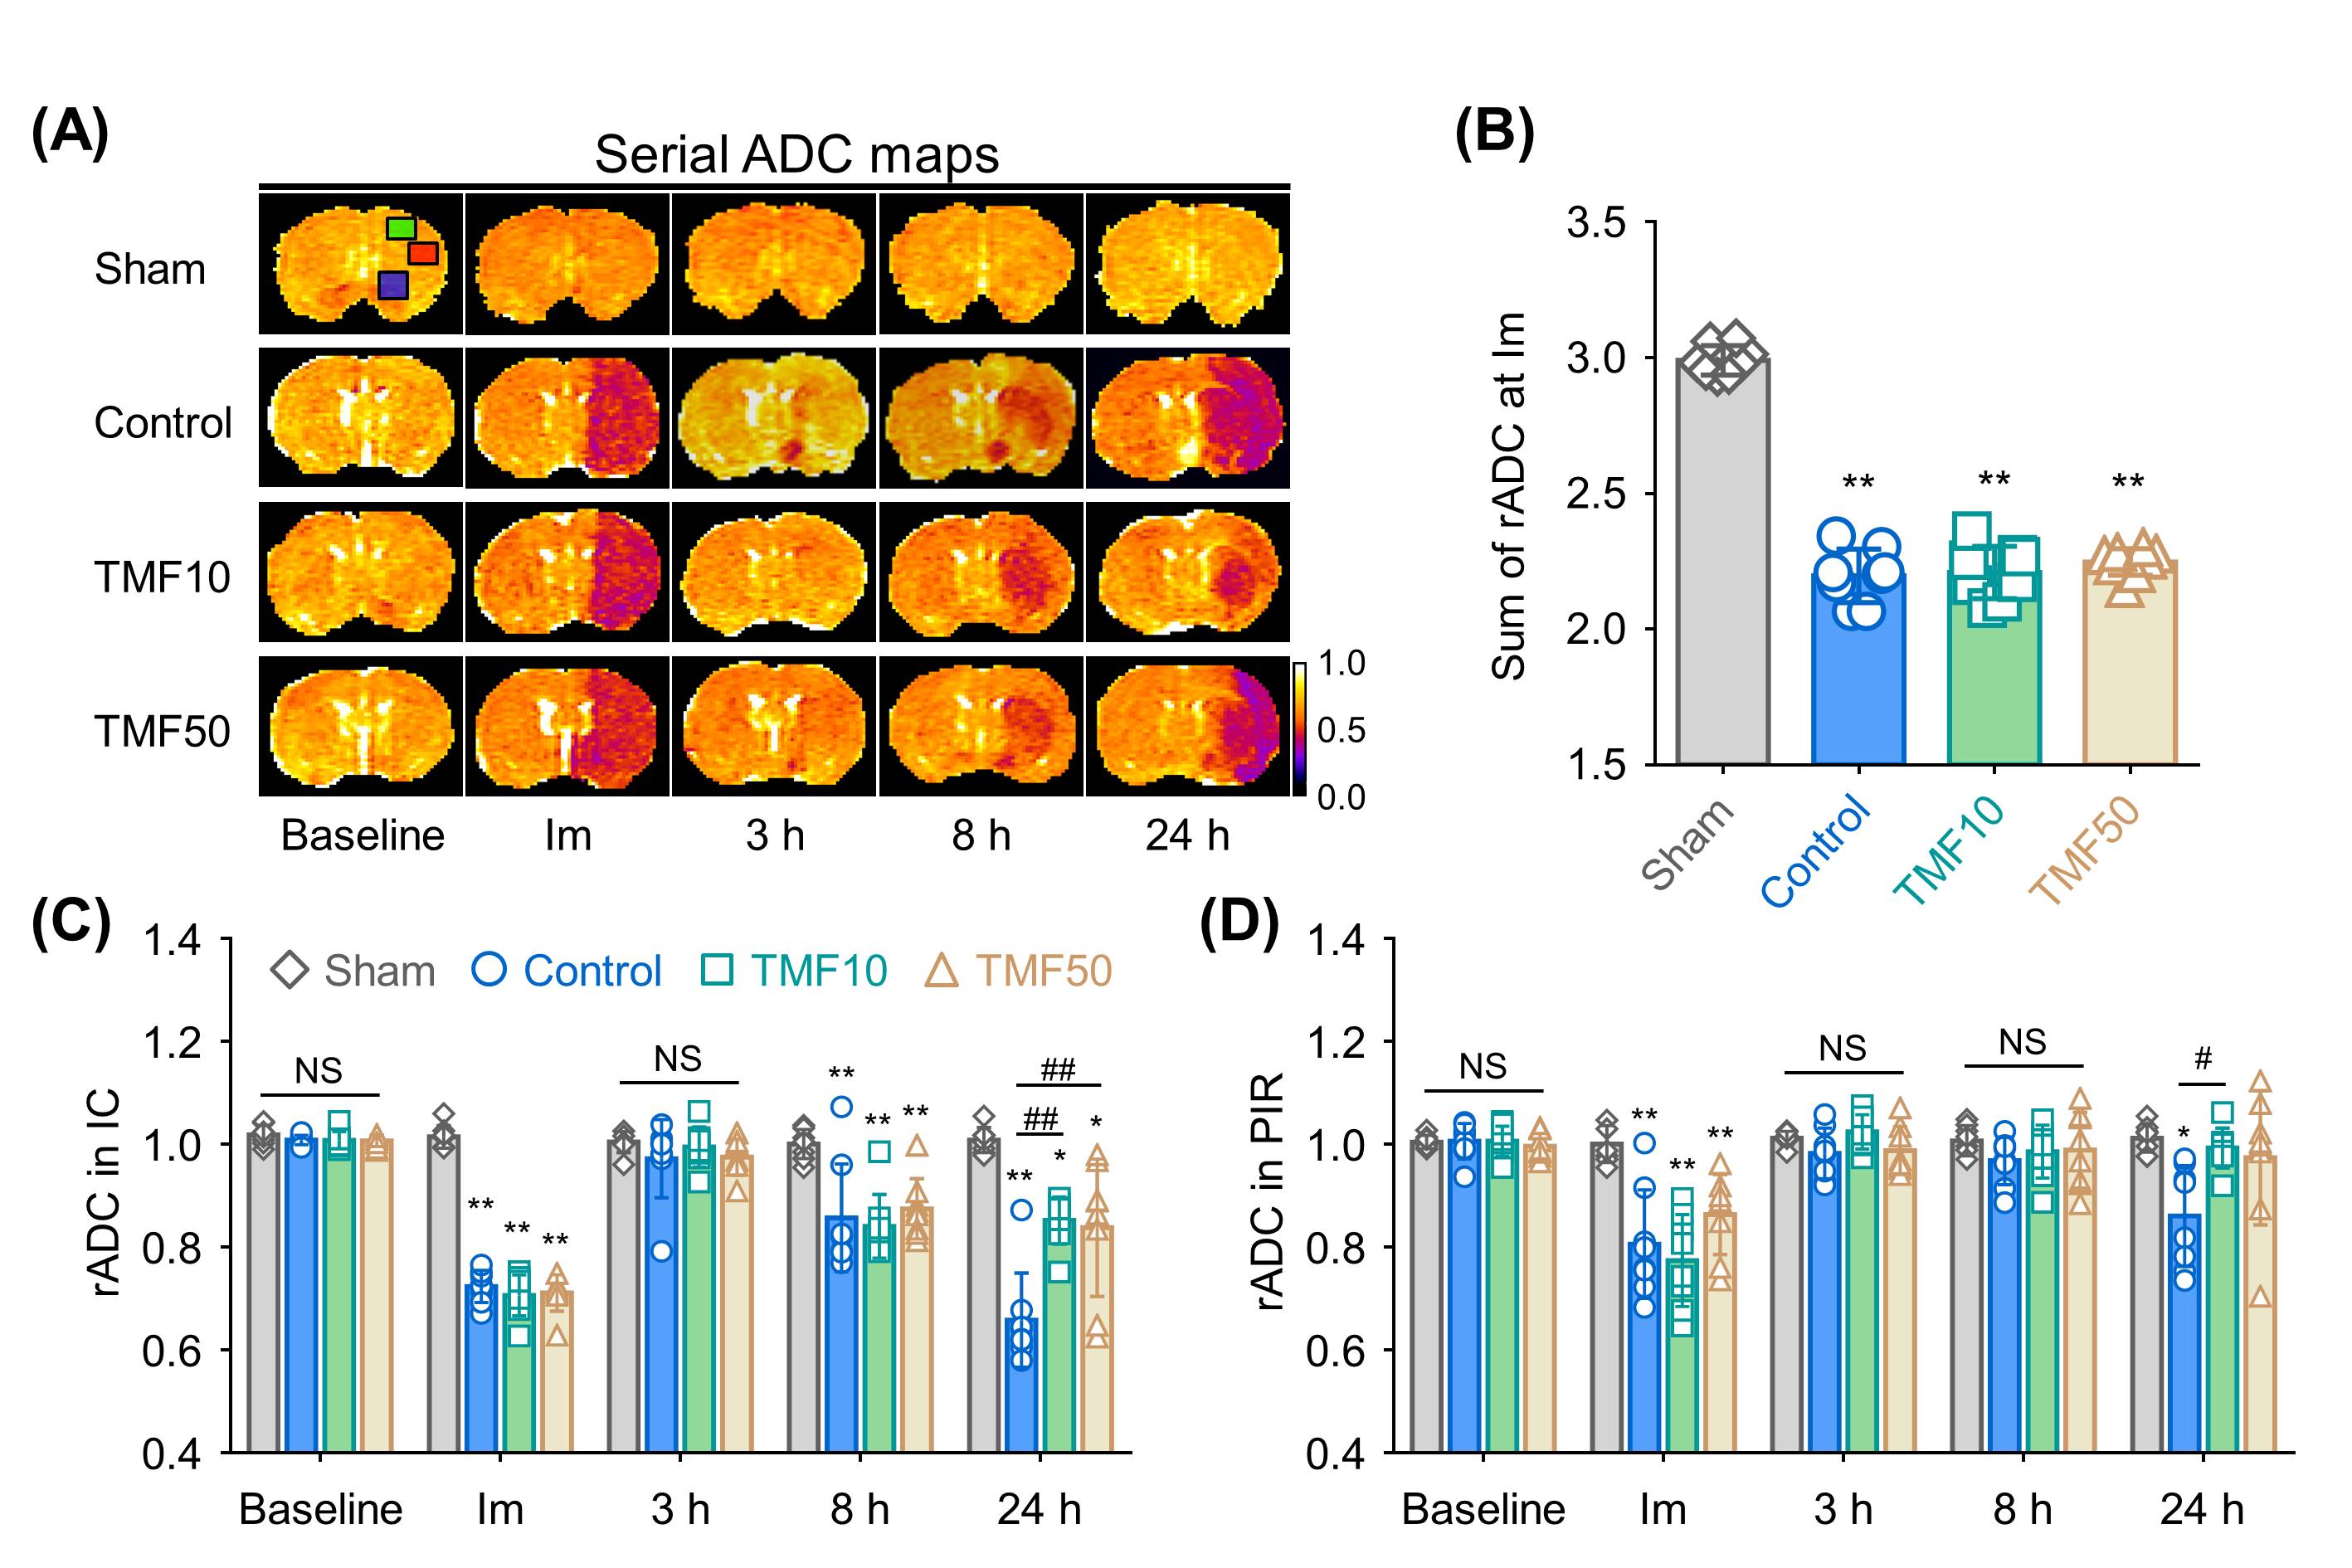
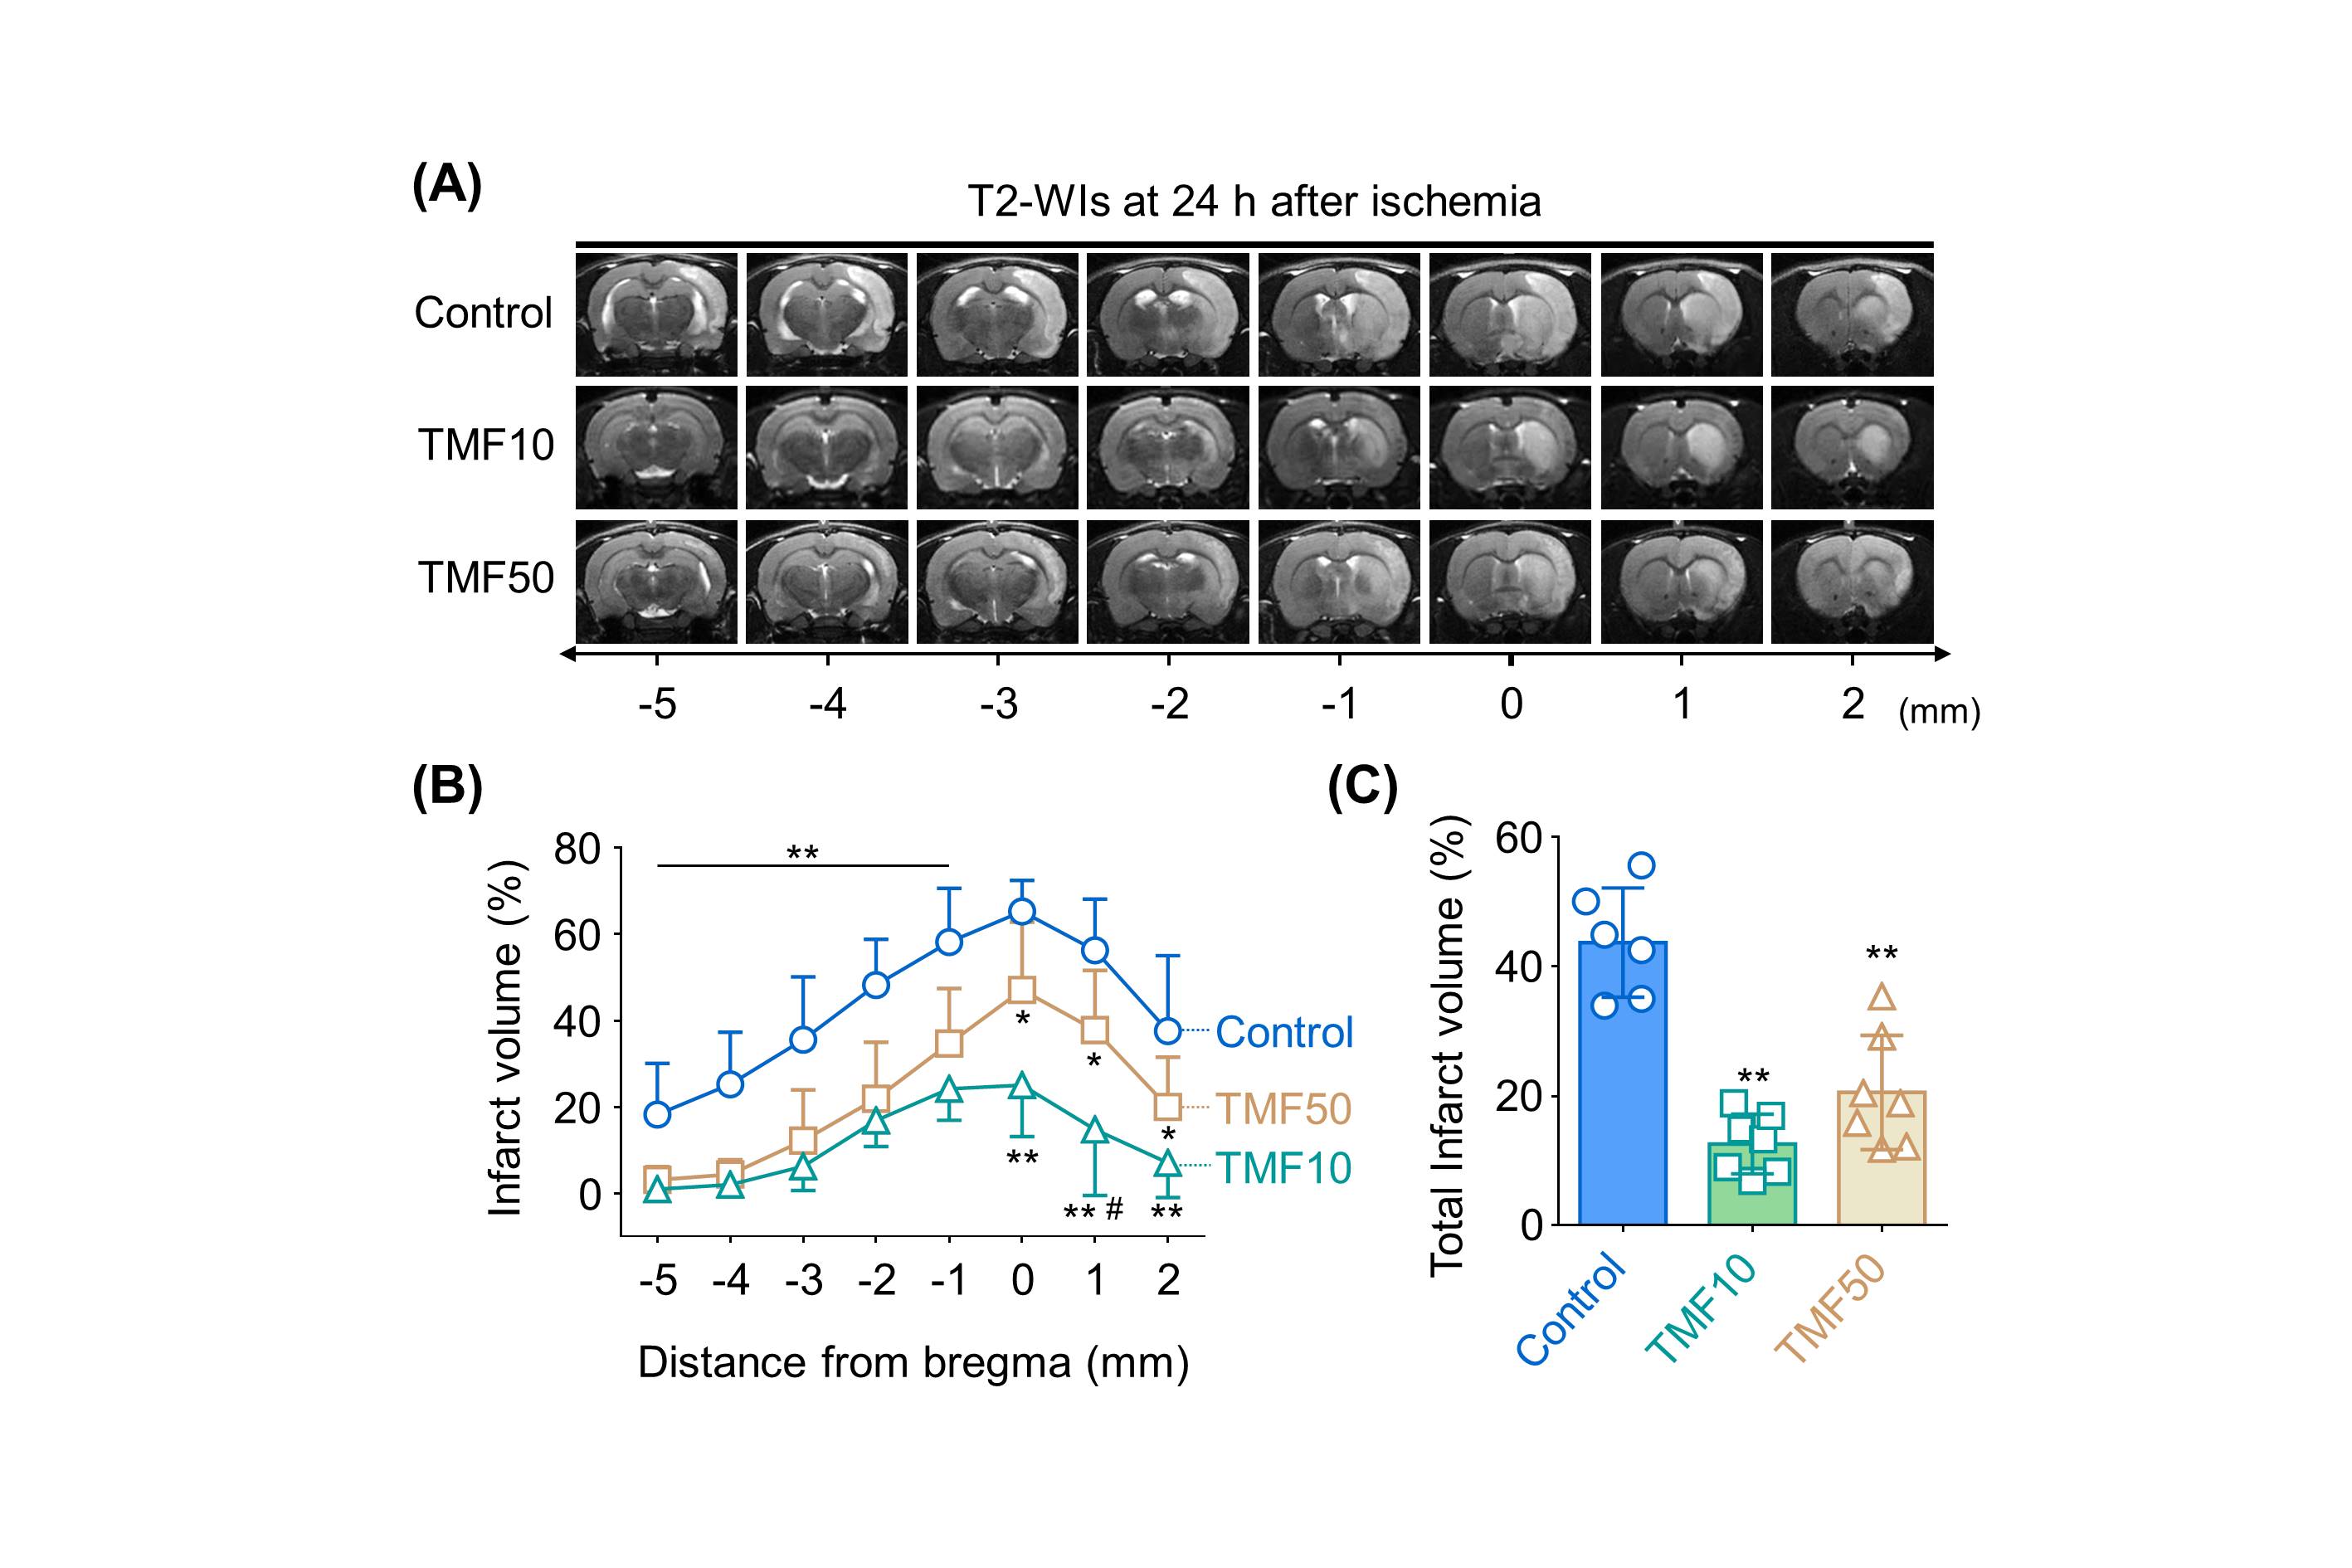
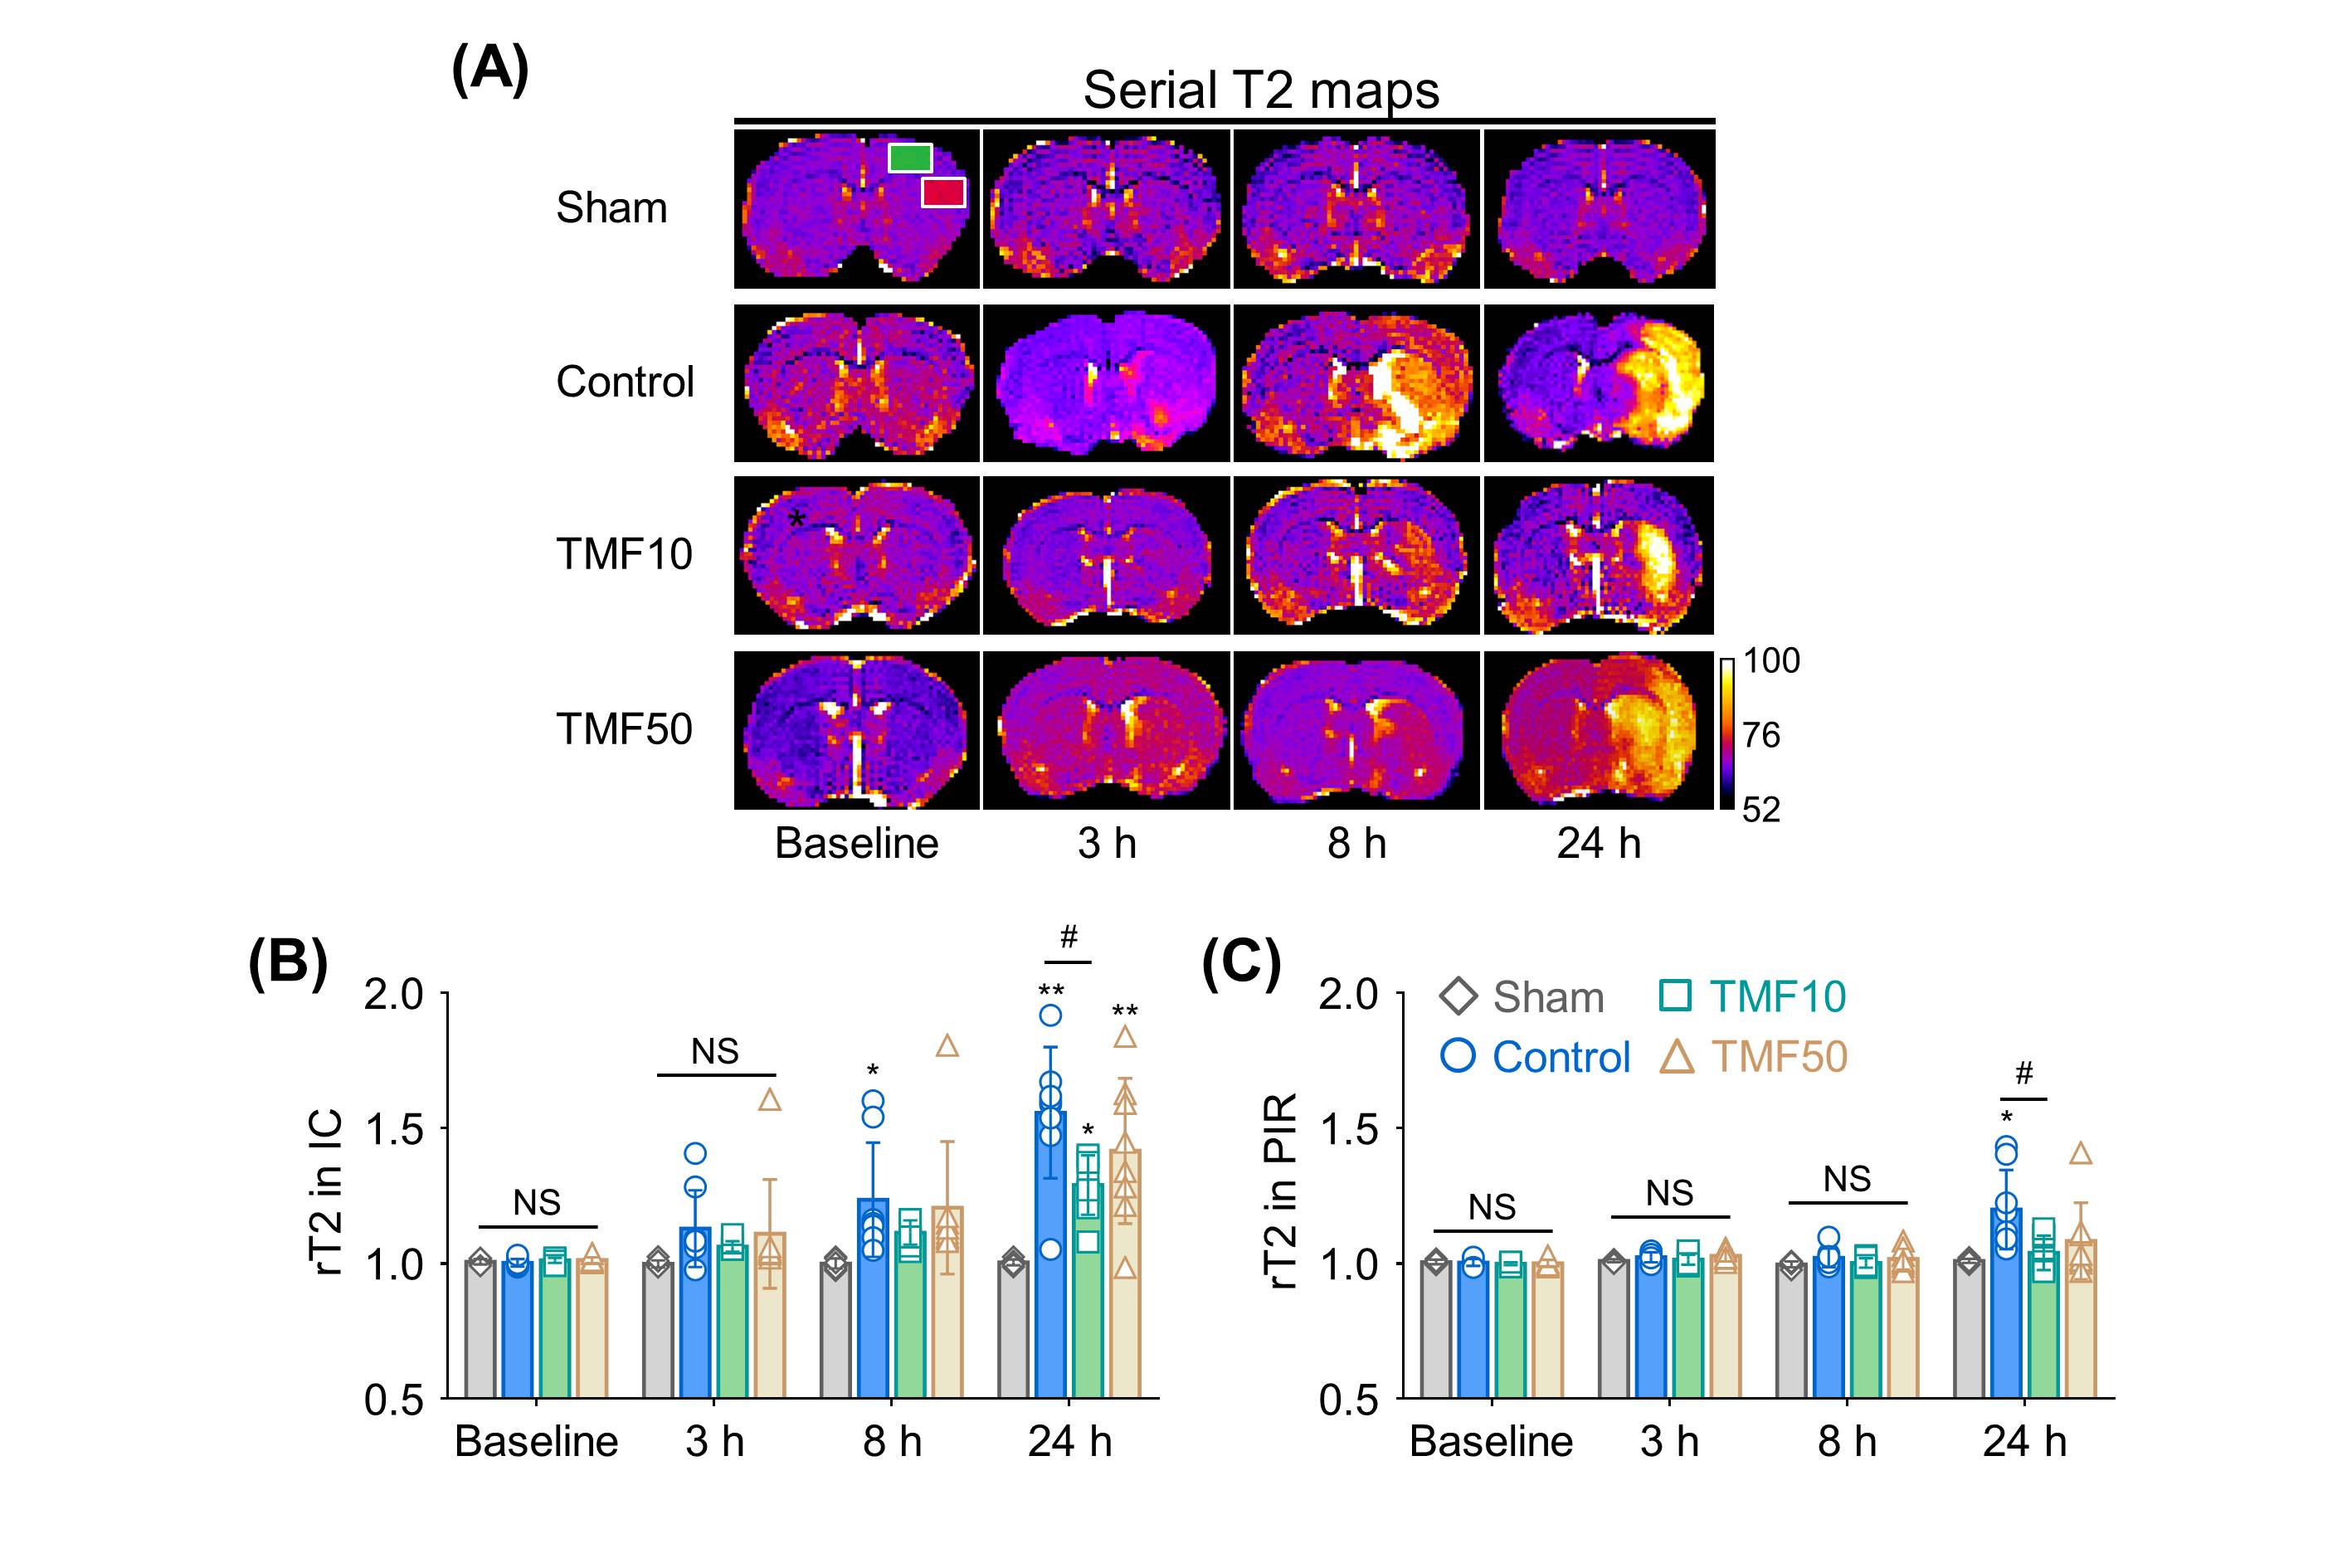
Image analysis ADC values were measured in the ischemic core (IC), peri-infarct region (PIR), and anterior choroidal and hypothalamic region (AHR) of the ipsilateral hemisphere and contralateral hemisphere to identify animals for which MCA occlusion was successfully established; then, the relative rADC (rADC) value was calculated as a ratio (ipsilateral value:contralateral value).4 The infarct volume at 24 hours after ischemia was measured in the nearest eight slices of T2-WIs on stereotactically predetermined coronal planes (from posterior -5.0 to anterior +2.0 mm, relative to bregma), and was calculated as follows: Percentage of infarct volume = (contralateral hemisphere volume – ipsilateral intact volume)/contralateral hemisphere volume × 100%. The total infarct volume (%) was the sum of the infarct volumes of each slice. The rADC and relative T2 (rT2) values indicating formation of cellular and vasogenic edema, respectively, were measured in the IC and PIR during the follow-up period.5,6
Statistics The infarct volume, rADC, rT2, and TUNEL positive (+) cells (%) were compared across groups with one-way ANOVA and Turkey’s post-hoc test.
RESULTS
MCA occlusion and total infarct volume Immediately after ischemia, rats in the TMF10, TMF50, and control groups showed more than 20% reduction in their sums of rADC values compared to the sham-operated group (Fig. 2). There were no significant differences in the sums of rADC values among the TMF10, TMF50, and control groups. The total infarct volume showed that TMF treatment groups had significantly less infarct than the control group, although no significant differences were observed between the TMF10 and TMF50 groups (Fig. 3).Effect of TMF treatment on ADC and T2 values The rADC values of the IC and PIR in the TMF10 groups were significantly higher than in the control group at 24 hours. Conversely, the mean rADC values of the IC and PIR in the TMF50 group were higher than control at 24 hours, but significant differences were limited to the IC (Fig. 2). The rT2 values of the IC and PIR were significantly lower in the TMF10 group than in the control group at 24 hours (Fig 4). However, the rT2 values of the IC and PIR did not differ significantly between the TMF50 and control groups at 24 hours.
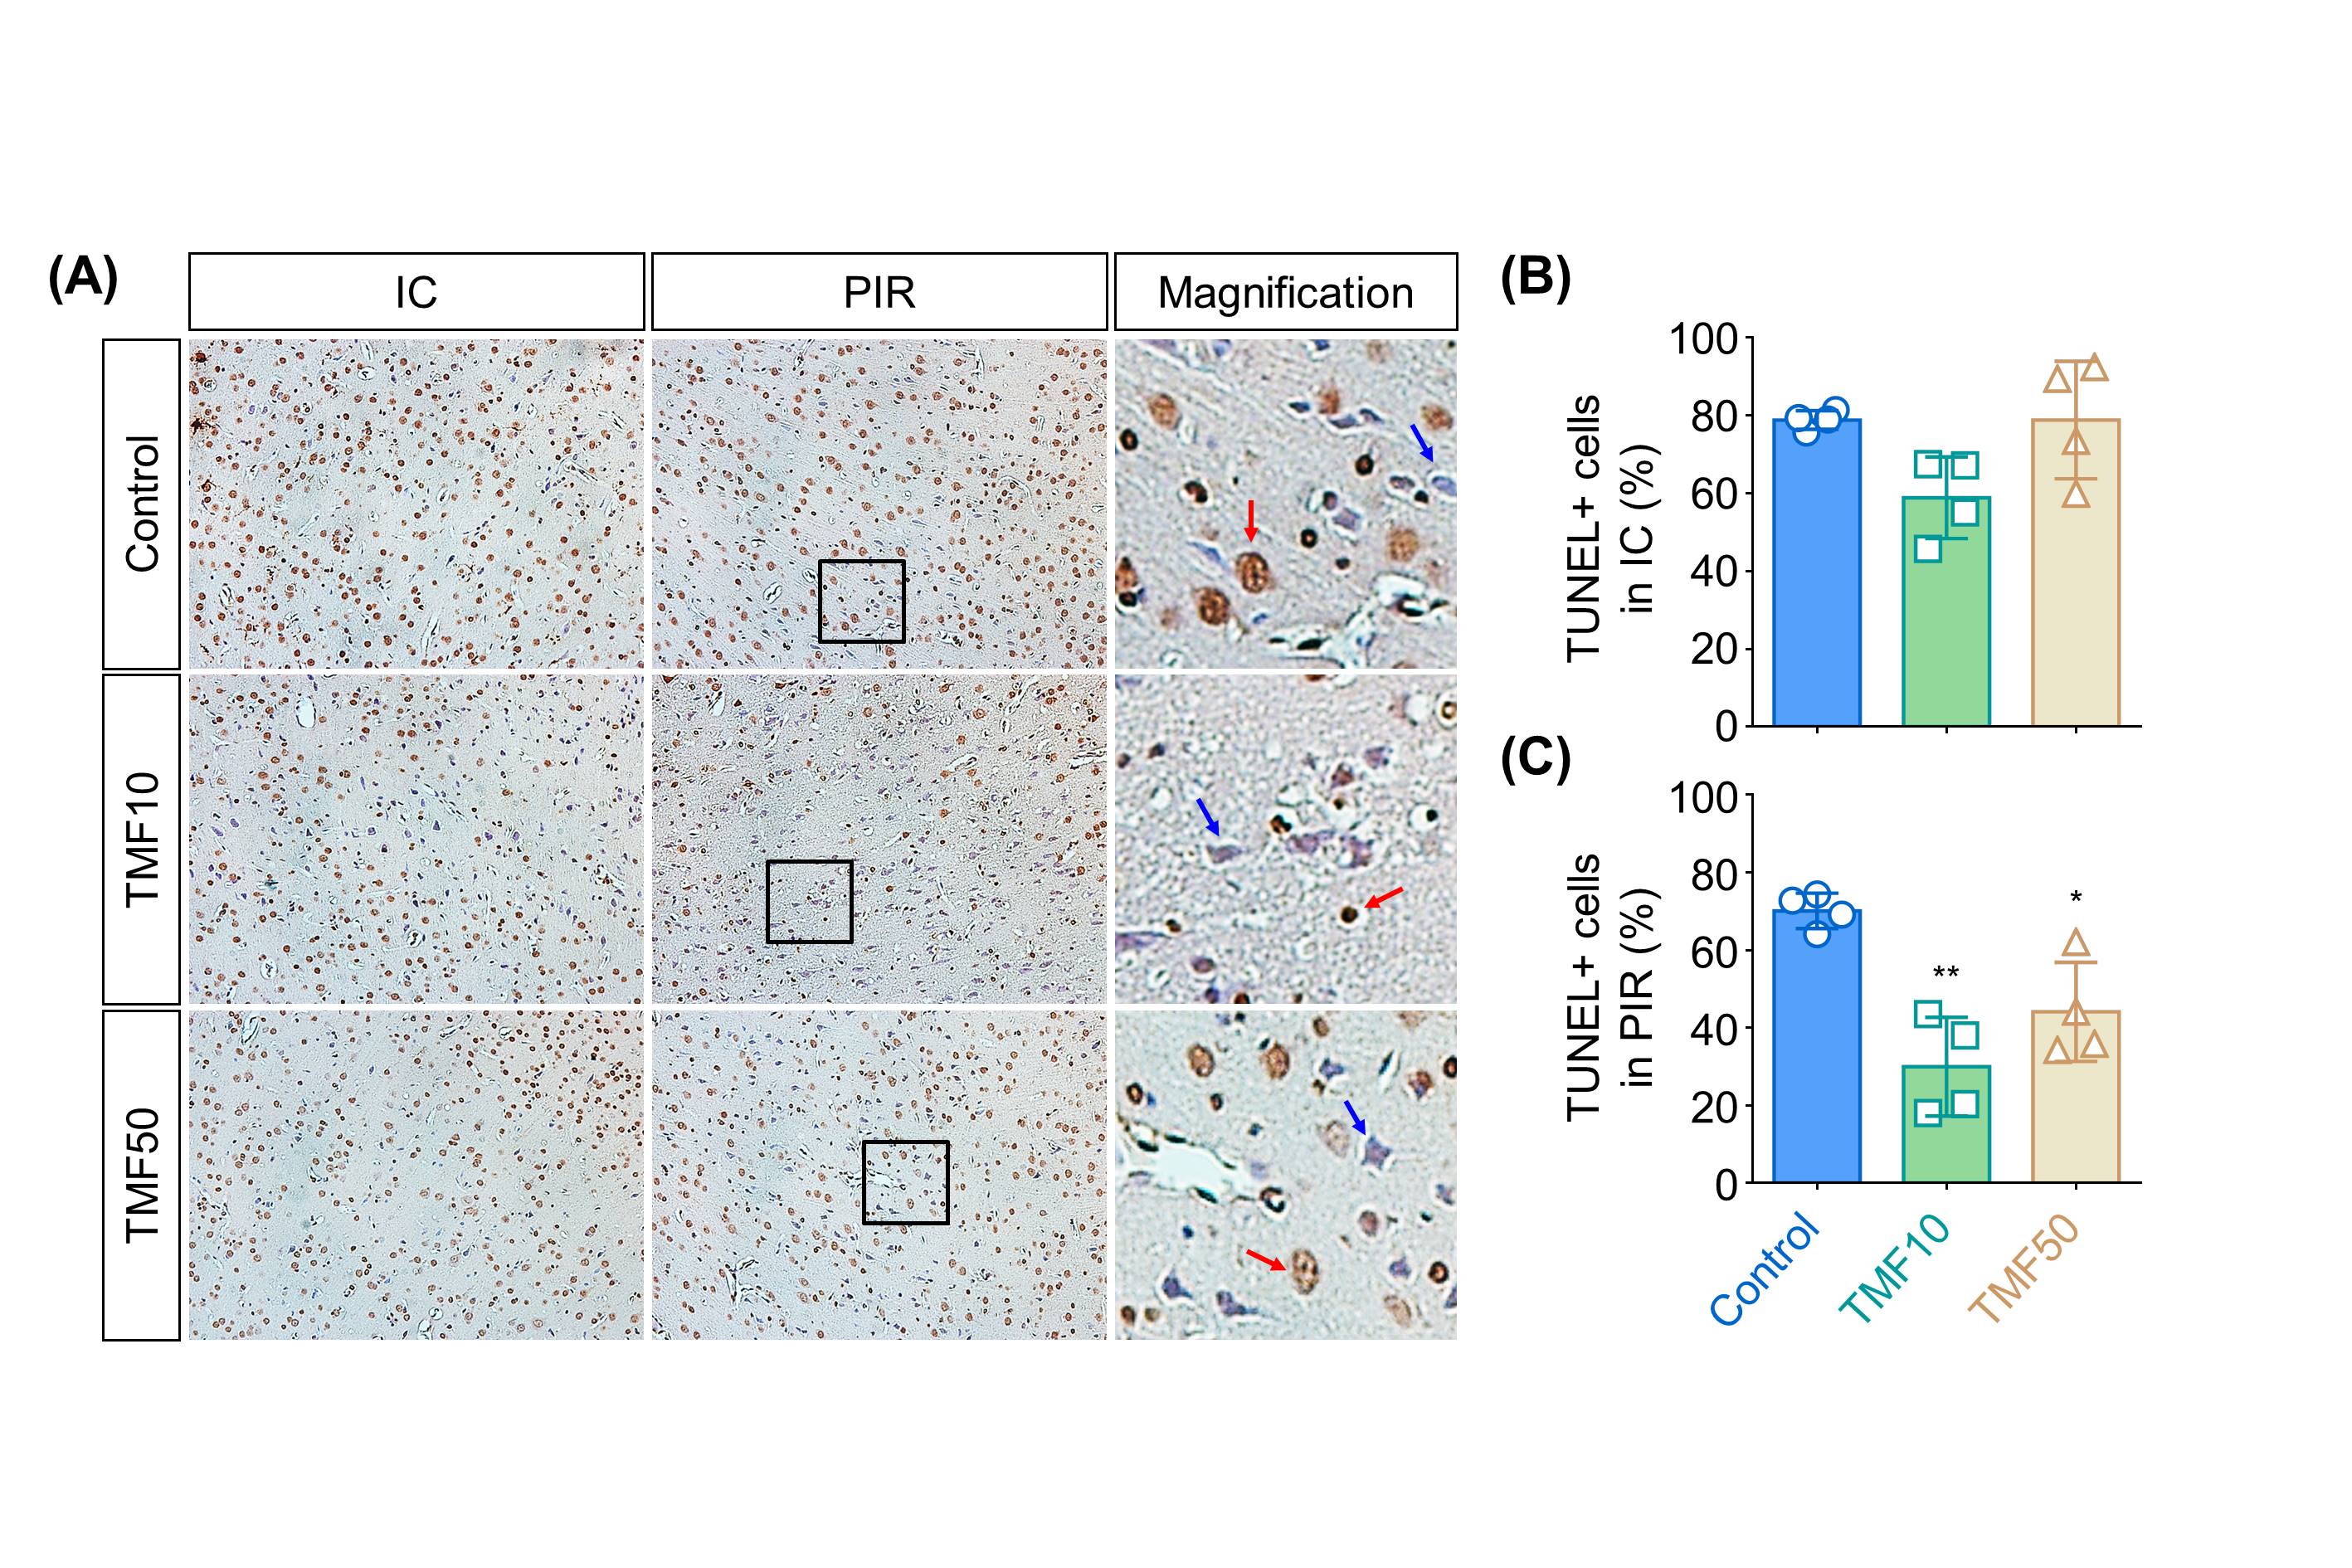
Histological analysis In the PIR, nuclear AhR expression in the TMF treatment groups was lower than in the control group (Fig. 1). TUNEL + cells (%) did not differ significantly between the TMF treatment and control groups in the IC. Conversely, TMF treatment groups showed significantly less TUNEL+ cells (%) than the control group. No significant differences were observed between the TMF10 and TMF50 groups in the PIR (Fig. 5).
DISCUSSION
The present study demonstrated that TMF treatment 10 or 50 minutes after ischemia alleviated brain damage, as evidenced by volumetric and histologic examination. TMF treatment timing after ischemia also affected cellular or vasogenic edema inhibition by cerebral I/R.CONCLUSION
AhR antagonism might be a viable therapeutic for cerebral I/R injury. However, further studies are needed to elucidate the exact time dependency of AhR antagonist efficacy on cerebral I/R injury and underlying mechanisms of neuroprotective effects to assess potential clinical applications.Acknowledgements
This research was supported by the Basic Science Research Program through the National Research Foundation of Korea (NRF) funded by the Ministry of Education (NRF-2018R1C1B6003879).References
1. Kajta M, Wojtowicz AK, Mackowiak M, Lason W. Aryl hydrocarbon receptor-mediated apoptosis of neuronal cells: a possible interaction with estrogen receptor signaling. Neuroscience. 2009;158(2):811-22.
2. Cuartero MI, Ballesteros I, de la Parra J, Harkin AL, Abautret-Daly A, Sherwin E, et al. L-kynurenine/aryl hydrocarbon receptor pathway mediates brain damage after experimental stroke. Circulation. 2014;130(23):2040-51.
3. Padmanabhan A, Haldar SM. Neuroprotection in ischemic stroke: AhR we making progress? Circulation. 2014;130(23):2002-4.
4. Kwon JI, Woo CW, Kim KW, Choi Y, Kim ST, Kim YJ, et al. Does the Apparent Diffusion Coefficient Value Predict Permanent Cerebral Ischemia/Reperfusion Injury in Rats? Acad Radiol. 2019. In press.
5. O'Shea JM, Williams SR, van Bruggen N, Gardner-Medwin AR. Apparent diffusion coefficient and MR relaxation during osmotic manipulation in isolated turtle cerebellum. Magnetic resonance in medicine. 2000;44(3):427-32.
6. Neumann-Haefelin T, Kastrup A, de Crespigny A, Yenari MA, Ringer T, Sun GH, et al. Serial MRI after transient focal cerebral ischemia in rats: dynamics of tissue injury, blood-brain barrier damage, and edema formation. Stroke; a journal of cerebral circulation. 2000;31(8):1965-72
Figures