1951
A Whole-Brain Map and Assay Parameter Analysisof Mouse VTA Dopaminergic Activation
Horea-Ioan Ioanas1, Bechara John Saab2, and Markus Rudin1
1Institute for Biomedical Engineering, ETH and University of Zurich, Zurich, Switzerland, 2Preclinical Laboratory for Translational Research into Affective Disorder, University of Zurich Psychiatric Hospital, Zurich, Switzerland
1Institute for Biomedical Engineering, ETH and University of Zurich, Zurich, Switzerland, 2Preclinical Laboratory for Translational Research into Affective Disorder, University of Zurich Psychiatric Hospital, Zurich, Switzerland
Synopsis
The definition of neurophenotypes for the function of key neurotransmitter systems is vital to the improvement of drug development in psychopharmacology. In this study we present a whole-brain map of stimulus-evoked VTA dopaminergic function in mice, alongside a parameter analysis for this novel assay. This study shows overall coherence between functional and known structural connectivity, but provides additional evidence for functional connectivity towards the dorsal striatum (first indicated in the rat model). We propose that this thoroughly explored new assay can provide an invaluable read-out for dopaminergic dysfunction and dopaminergic intervention modelling.
Introduction
Ascending dopaminergic projections from neurons located in the Ventral Tegmental Area (VTA) are key to the etiology, dysfunction, and control of motivation, learning, and addiction. Due to the evolutionary conservation of this nucleus and the extensive use of mice as disease models, establishing an assay for VTA dopaminergic activation in the mouse is highly relevant for the translational investigation of neuronal function phenotypes of diseases and interventions. Additionally, it is of foremost importance that such an assay be formulated after a fashion in which both the experimental protocol, and the analysis, are easily reproducible across preclinical imaging centers.Methods
In this article we use optogenetic stimulation for targeted VTA dopaminergic neuron control, and acquire data via functional Magnetic Resonance Imaging (fMRI), a method widely used in human deep brain imaging. This combination of methods is closely keeping with the establishment of dorsal raphe functional serotonergic projection mapping in the mouse1 and VTA functional dopaminergic projection mapping in the rat2.In order to ensure appropriate documentation for this assay we document controlled variation of experimental parameters, such as exact implant targeting and stimulation protocol, as well as the interaction thereof. We compare our results to state-of-the-art population-level structural connectivity maps sourced from the Allen Brain Institute (ABI) mouse brain connectome dataset.
In order to ensure maximal data analysis reproducibility, we publish the source code for the map generation from the raw data in full, according to publicly available a research article reproduction guidelines3.
Results
We report functional responses to VTA dopaminergic stimulation which are sensitive to both the stimulation protocol category (F1,52 = 32.61, p = 5.48×10⁻⁷) and the implant coordinates (depth: F4,52 = 3.342, p=0.016; posteroanterior coordinates: F3,52 = 4.393, p = 0.0079; and their interaction: F12,52= 2.621,p= 0.021). This break-down is visually depicted in figures 1 and 2, where the most salient feature is the low response rate for phasic stimulation protocols.Based on this parameter breakdown we perform a cluster analysis (figure 2) to determine the best parameters for VTA functional dopaminergic projection mapping and present the resulting projection map (figure 3). This map includes prominent projection areas such as the nucleus accumbens, includes additional areas for which evidence to date is more sparse (in the dorsal striatum), and excludes areas more prominent in electrophysiological literature such as the amygdala and the hippocampus.
We compare and contrast this map to published population-level structural projection maps and observe a moderately strong (ρ= 0.52, p = 1.95×10⁻²²) correlation at the brain parcellation level (figure 4). The most salient differences are observed in the contralateral striatum and the medial and dorsal ipsilateral striatum (figure 5).
Discussion
The functional map shows broad coherence with structural connectivity from population-level data. The differences are notable in the contralateral hemisphere, indicating contralateral VTA activation, which is confirmed by inspection of midbrain functional activation. The absence of connectivity towards the hippocampus and amygdala, seen in both functional and structural maps, indicates that fiber density is a clear determinant of functional activation, and encourages the use of whole-brain imaging techniques to obtain a more standardized read-out of dopaminergic activation effects. The activation of dorsal striatal regions is coherent with previous results from rat opto-fMRI2 and provides additional evidence for this not well established projection.Conclusion
The results presented herein offer both a functional map of VTA dopaminergic activity at the whole-brain level, and an evidence-based selection of parameters for assay reuse. This assay can find significant application as a read-out for dopaminergic dysfunction as well as dopaminergic interventions in model animals. A possible use for this assay is to provide neurophenotype-resolved drug profiling, a vial and much needed stepping stone for improved drug design in psychopharmacology.Acknowledgements
No acknowledgement found.References
1. Joanes Grandjean, Alberto Corcoba, Martin C.Kahn, A. Louise Upton, Evan S. Deneris, ErichSeifritz, Fritjof Helmchen, Edward O. Mann,Markus Rudin, and Bechara J. Saab. A brain-wide functional map of the serotonergic responsesto acute stress and fluoxetine.Nature Commu-nications, 10(1), January 2019. doi: 10.1038/s41467-018-08256-w. URLhttps://doi.org/10.1038/s41467-018-08256-w2. S Lohani, A J Poplawsky, S-G Kim, andB Moghaddam. Unexpected global impact of VTAdopamine neuron activation as measured by opto-fMRI.Molecular Psychiatry, 22(4):585–594, July2016. doi: 10.1038/mp.2016.102. URLhttps://doi.org/10.1038/mp.2016.102
3. Horea-Ioan Ioanas and Markus Rudin. Re-producible self-publishing for Python-basedresearch.EuroSciPy, August 2018.doi:10.6084/m9.figshare.7247339.v1. URLhttps://figshare.com/articles/Reproducible_Self-Publishing_for_Python-Based_Research/7247339
Figures
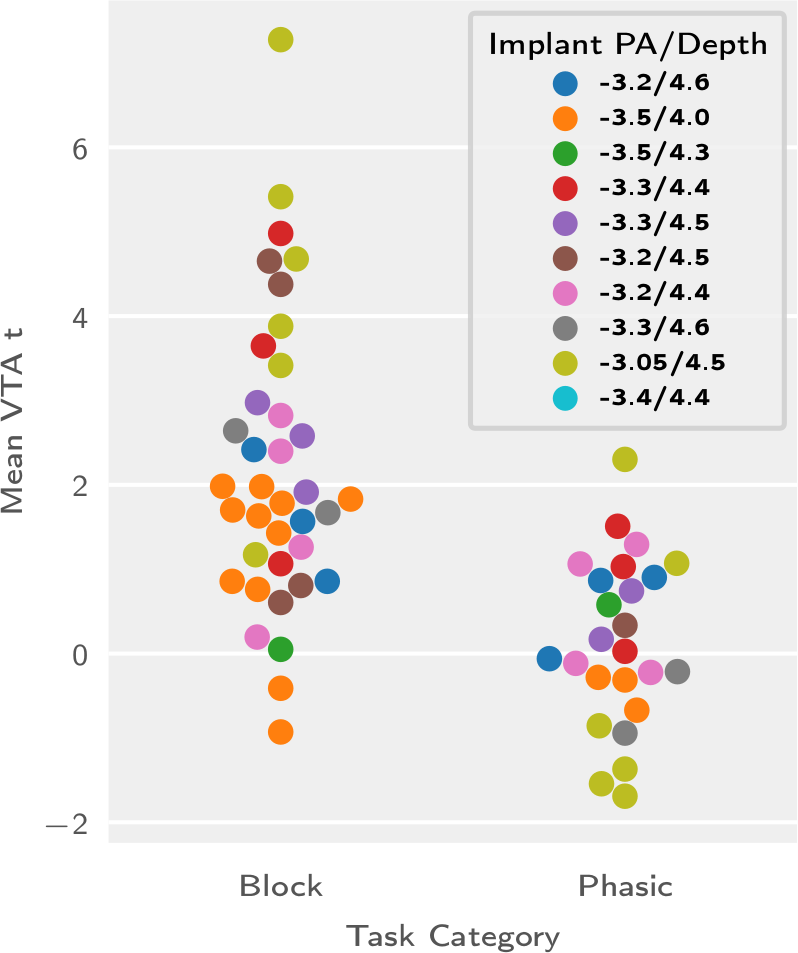
Figure 1: Task group comparison for animals targeted at all explored combinations of implant coordinates.
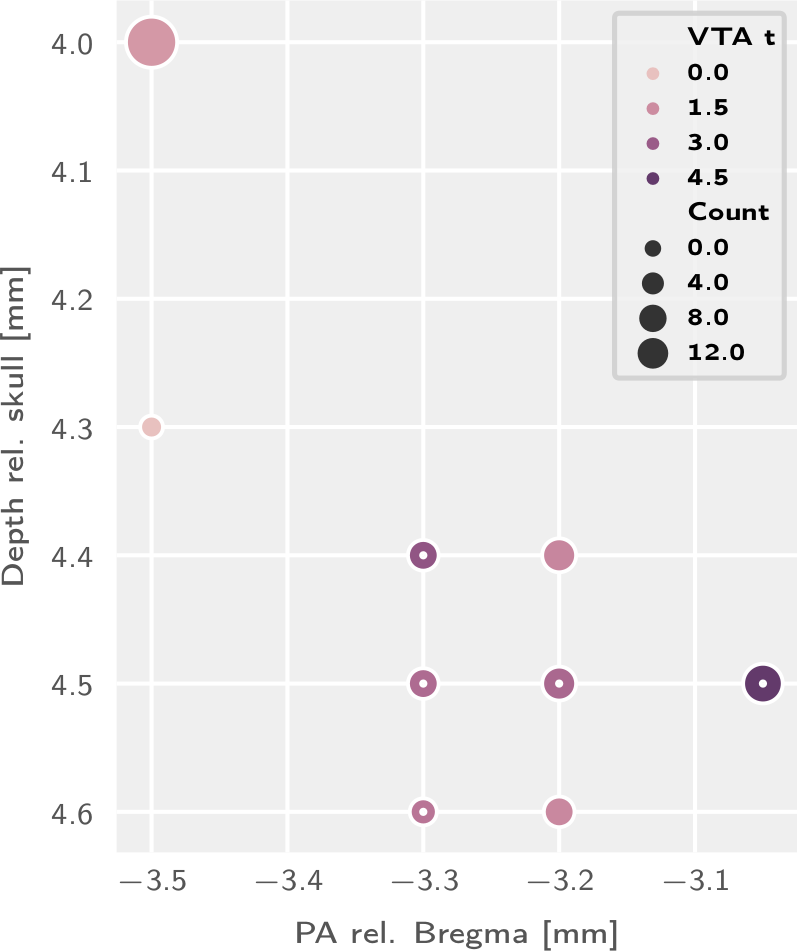
Figure 2: Implant coordinate comparison for block stimulation trials. Inner dots indicate best category group as determined by k-means clustering.

Figure 3: The volumetric population t-statistic map, considering for block stimulus evoked activity observed in the best implant group animals, and corrected for the negative control baseline, and thresholded at t ≥ 3.
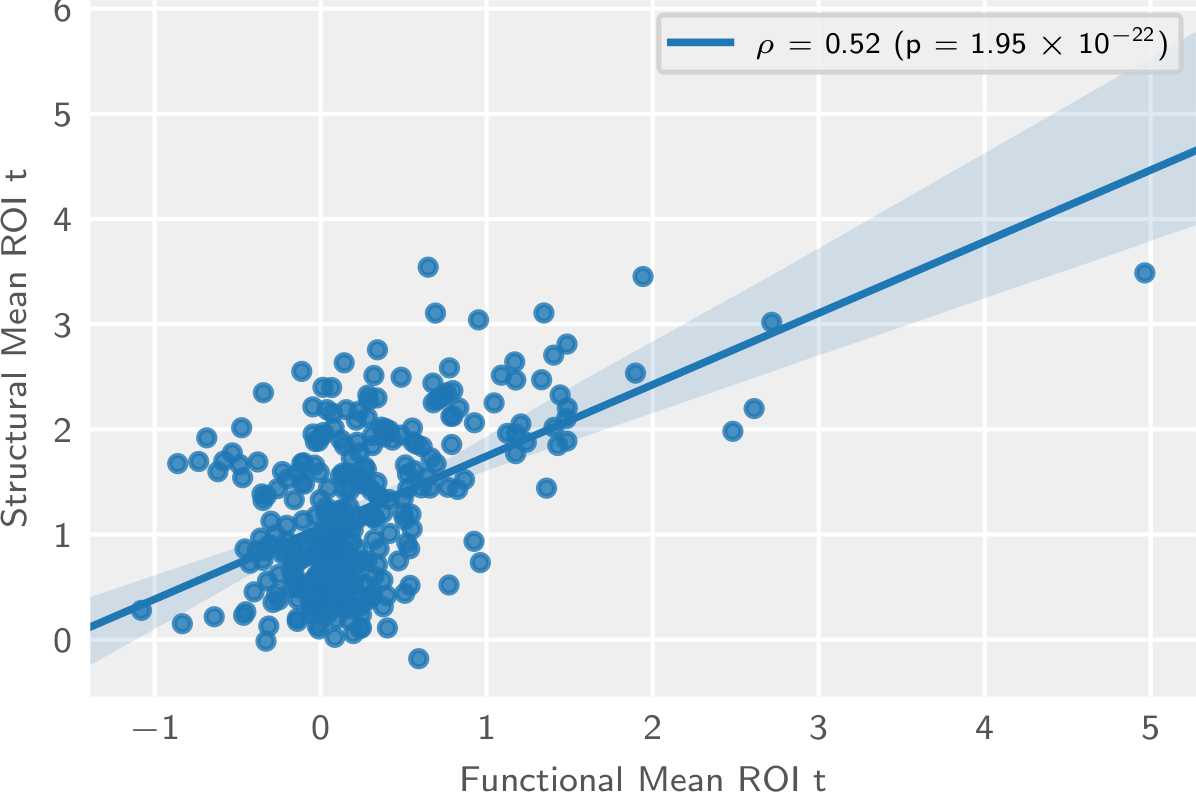
Figure 4: Region-wise regression plot between functional and structural projection maps. Tinted area indicates the 99% confidence interval of the regression estimate.
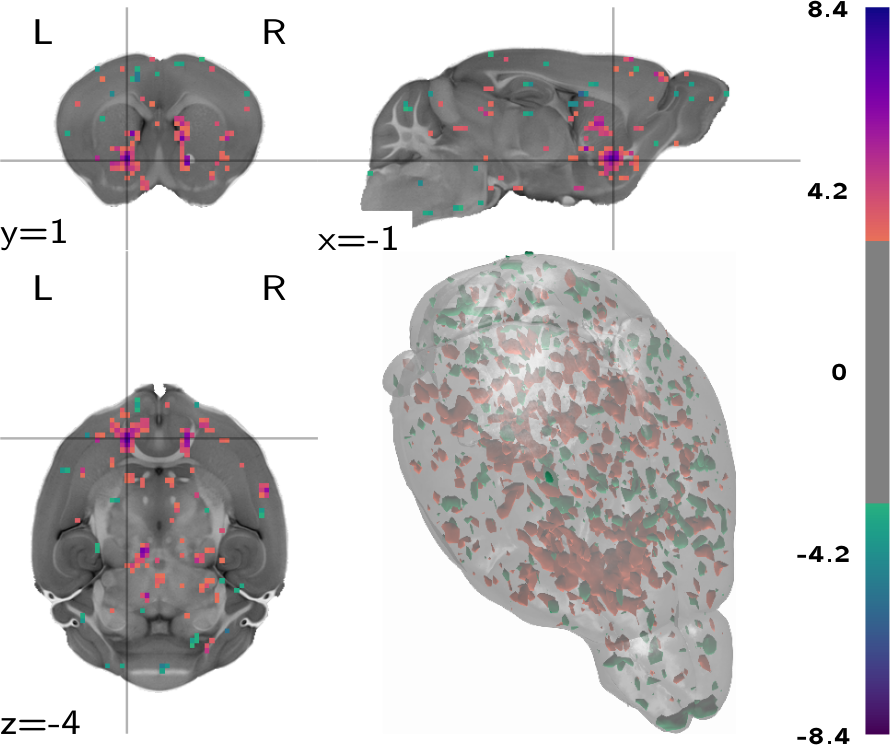
Figure 5: Contrast between VTA functional activation and structural projections, showing slices centered on the largest cluster and thresholded at 3 ≥ t ≥ -3.