1949
Effects of anesthetic conditions on the mouse cerebral oxygen saturation measured by QSM1Sherbrooke Molecular Imaging Center (CIMS), Department of Nuclear Medicine and Radiobiology, Université de Sherbrooke, Sherbrooke, QC, Canada, 2Faculty of Medicine, Universitätsklinikum Halle, Halle, Germany, 3Medical Physics Group, Institute of Diagnostic and Interventional Radiology, Jena University Hospital - Friedrich Schiller University Jena, Jena, Germany
Synopsis
Anesthetic conditions may have important effects on the blood oxygen saturation in rodents. However, the size of those effects has not been directly quantified in the mouse brain. We use Quantitative Susceptibility Mapping to provide a direct estimate of the oxygen saturation in the mouse brain under anesthesia. Three commonly used anesthetics, namely isoflurane, dexmedetomidine, and ketamine-xylazine, are evaluated. The effect of breathing gas is also evaluated.
Introduction
Although promising methods are being developed for awake mouse imaging, it is still a useful and common practice to anesthetize animals during imaging to minimize their stress as well as motion artefacts. However, anesthesia can alter blood oxygen saturation (sO2). Changes in sO2, in addition to having physiological impacts, can significantly influence various T2*-weighted MR measures such as blood-oxygen-level-dependent-fMRI (BOLD-fMRI). Even if the mouse is widely used as a preclinical model, scarce data is available on the effects of anesthesia on cerebral sO2. We propose to use Quantitative Susceptibility Mapping (QSM) to directly quantify blood oxygen saturation in the mouse brain under anesthesia with three commonly used anesthetics: isoflurane (ISO), ketamine-xylazine (KX), and dexmedetomidine (DEX).Methods
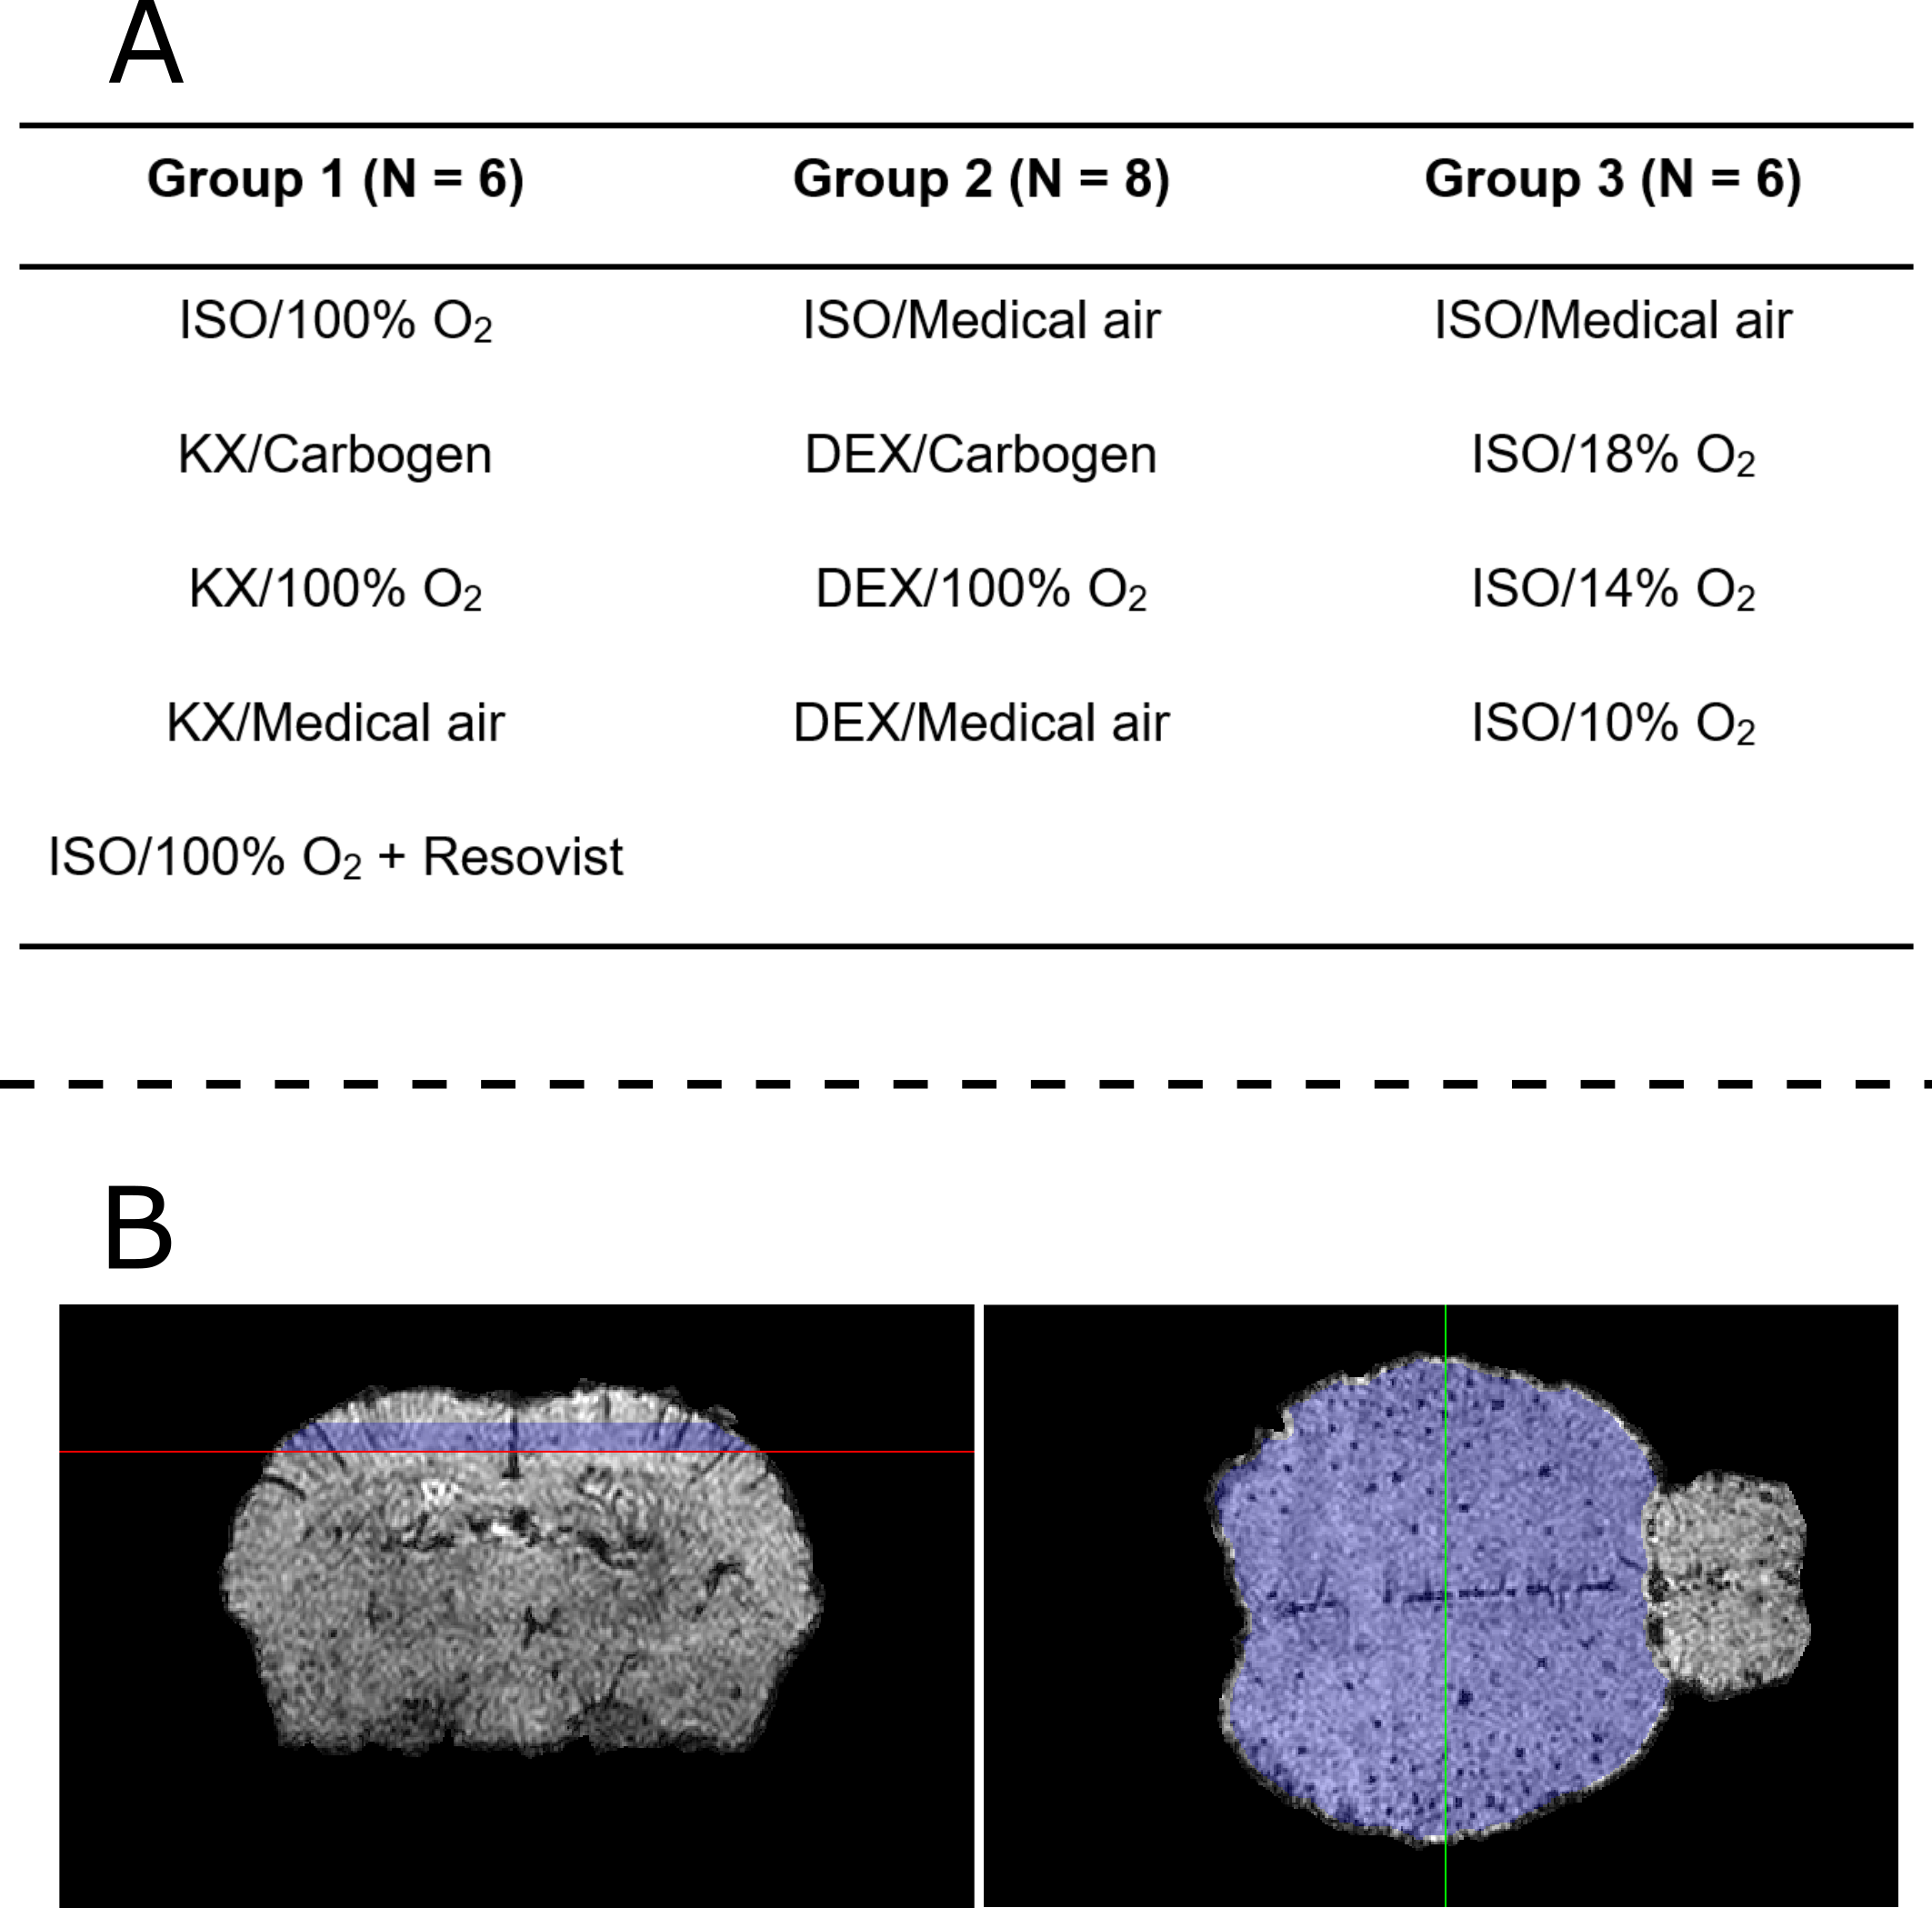
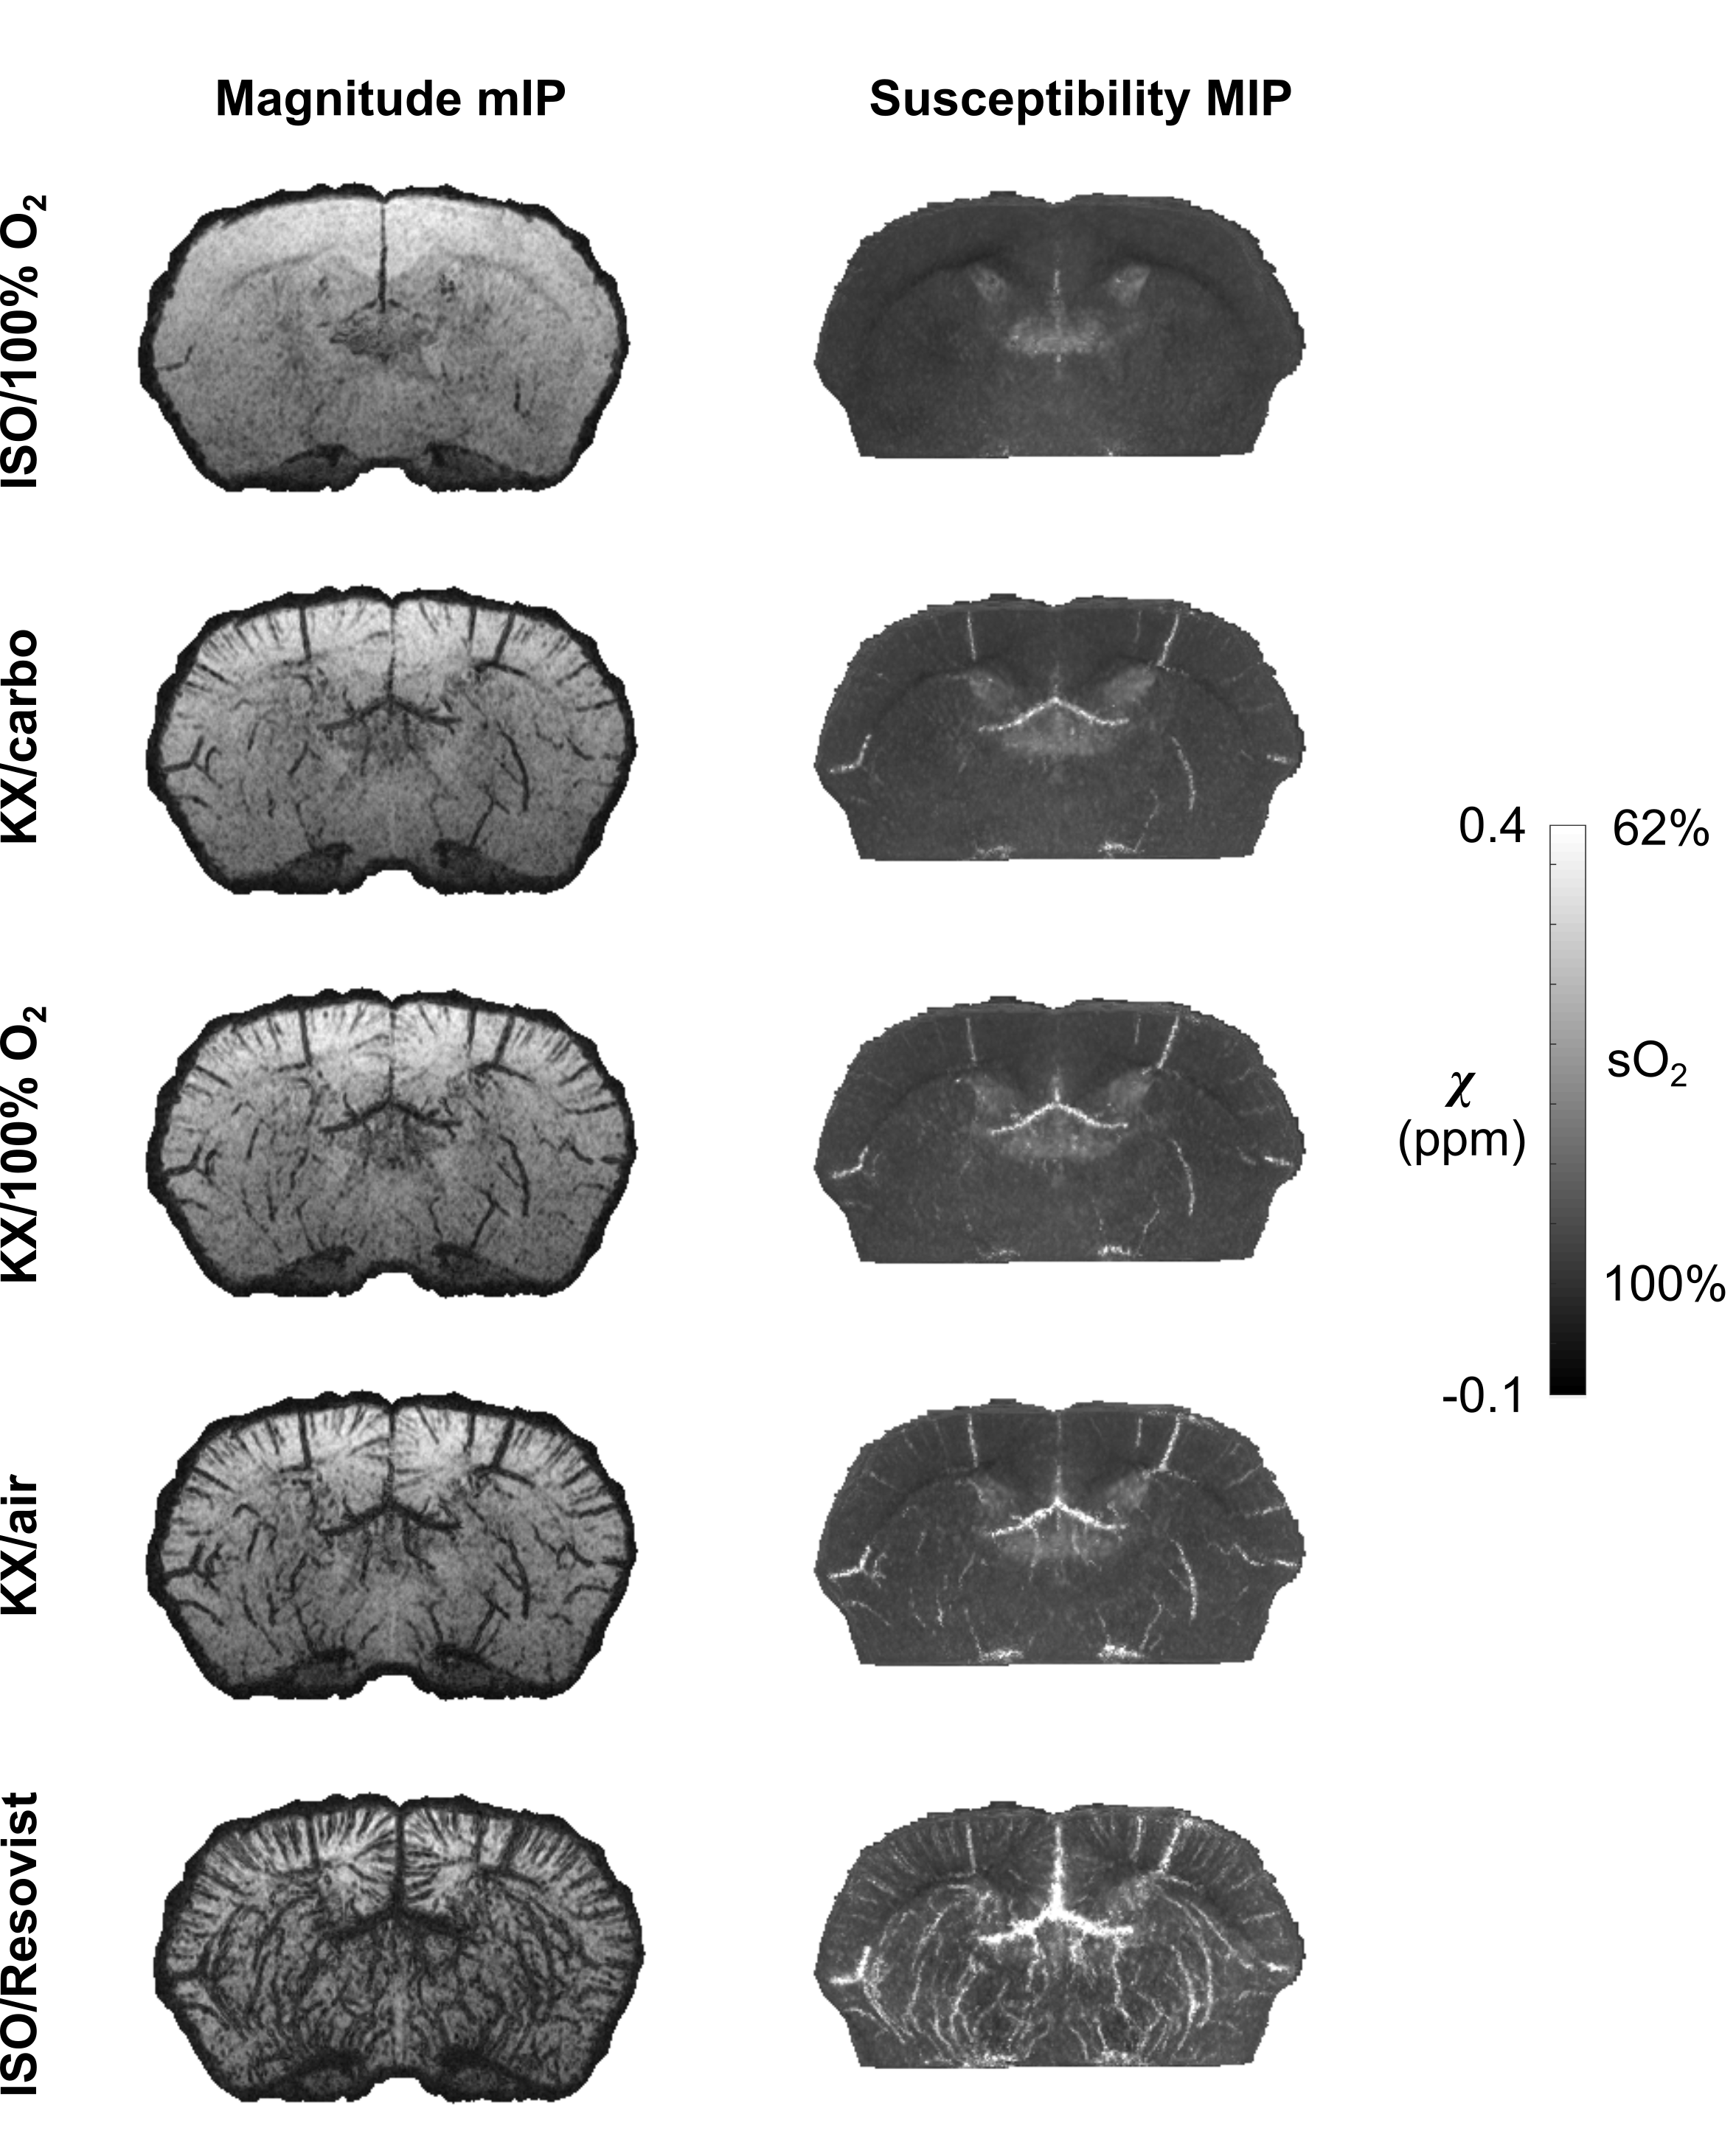
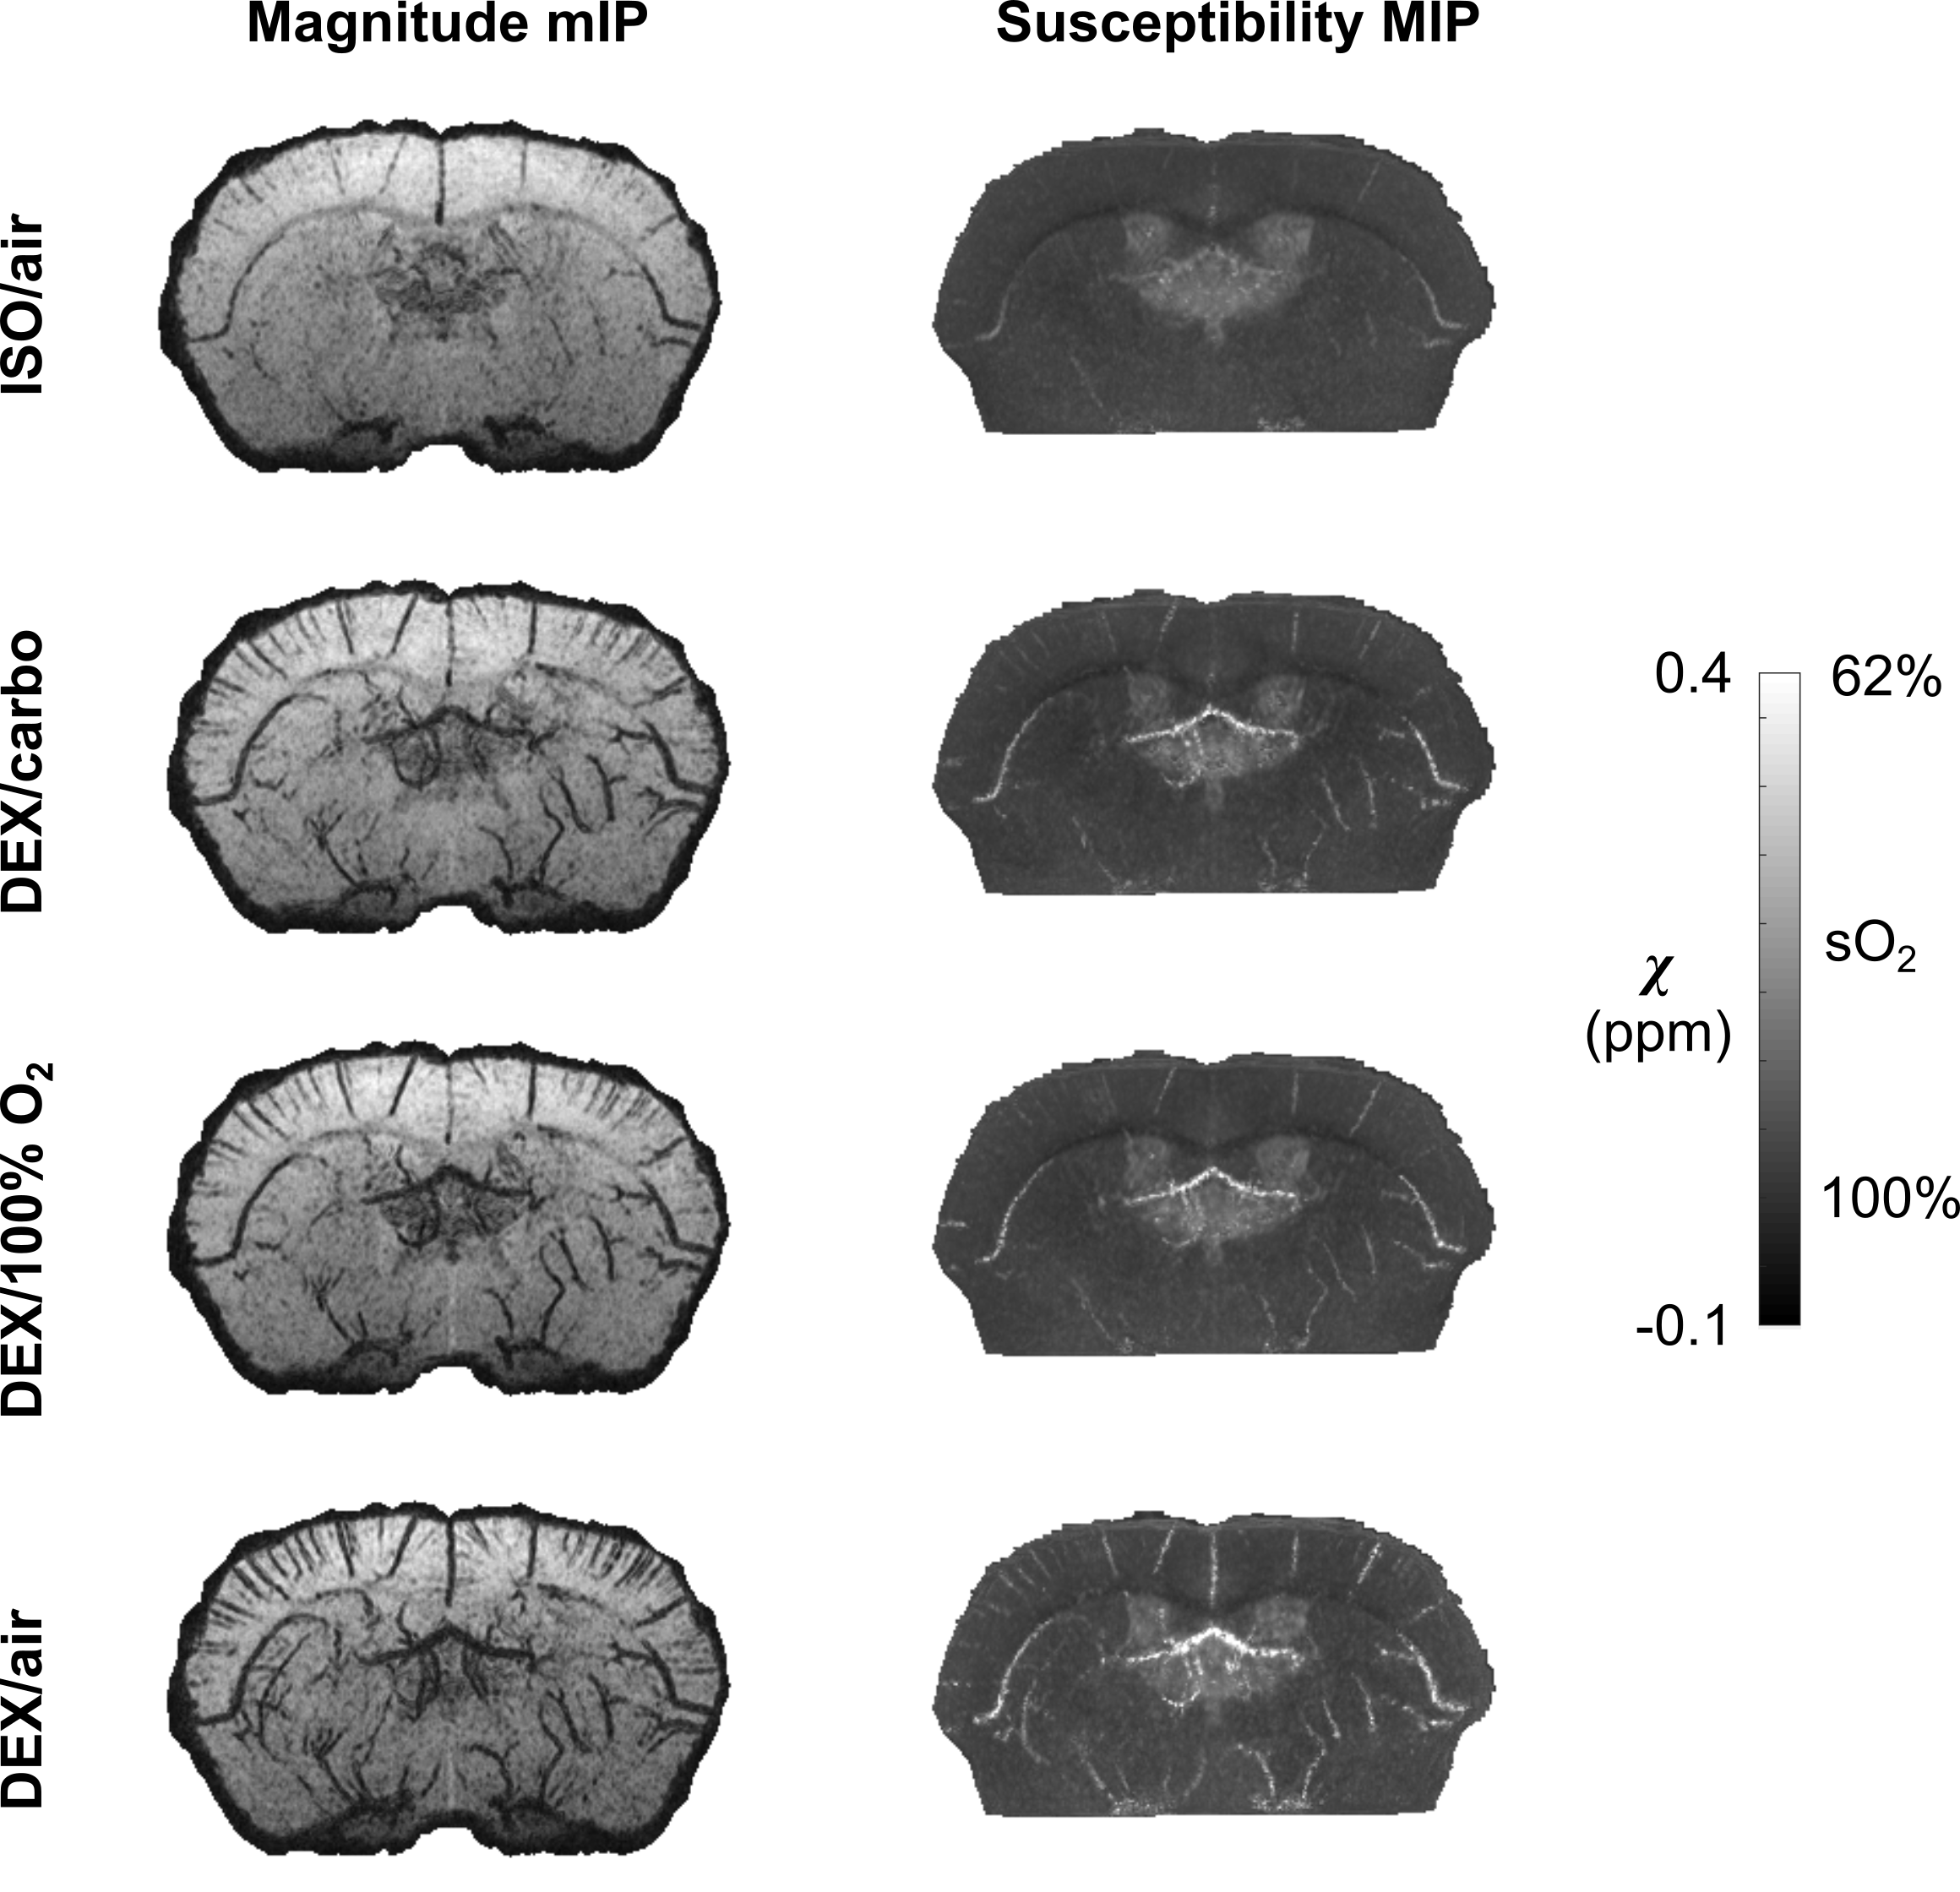
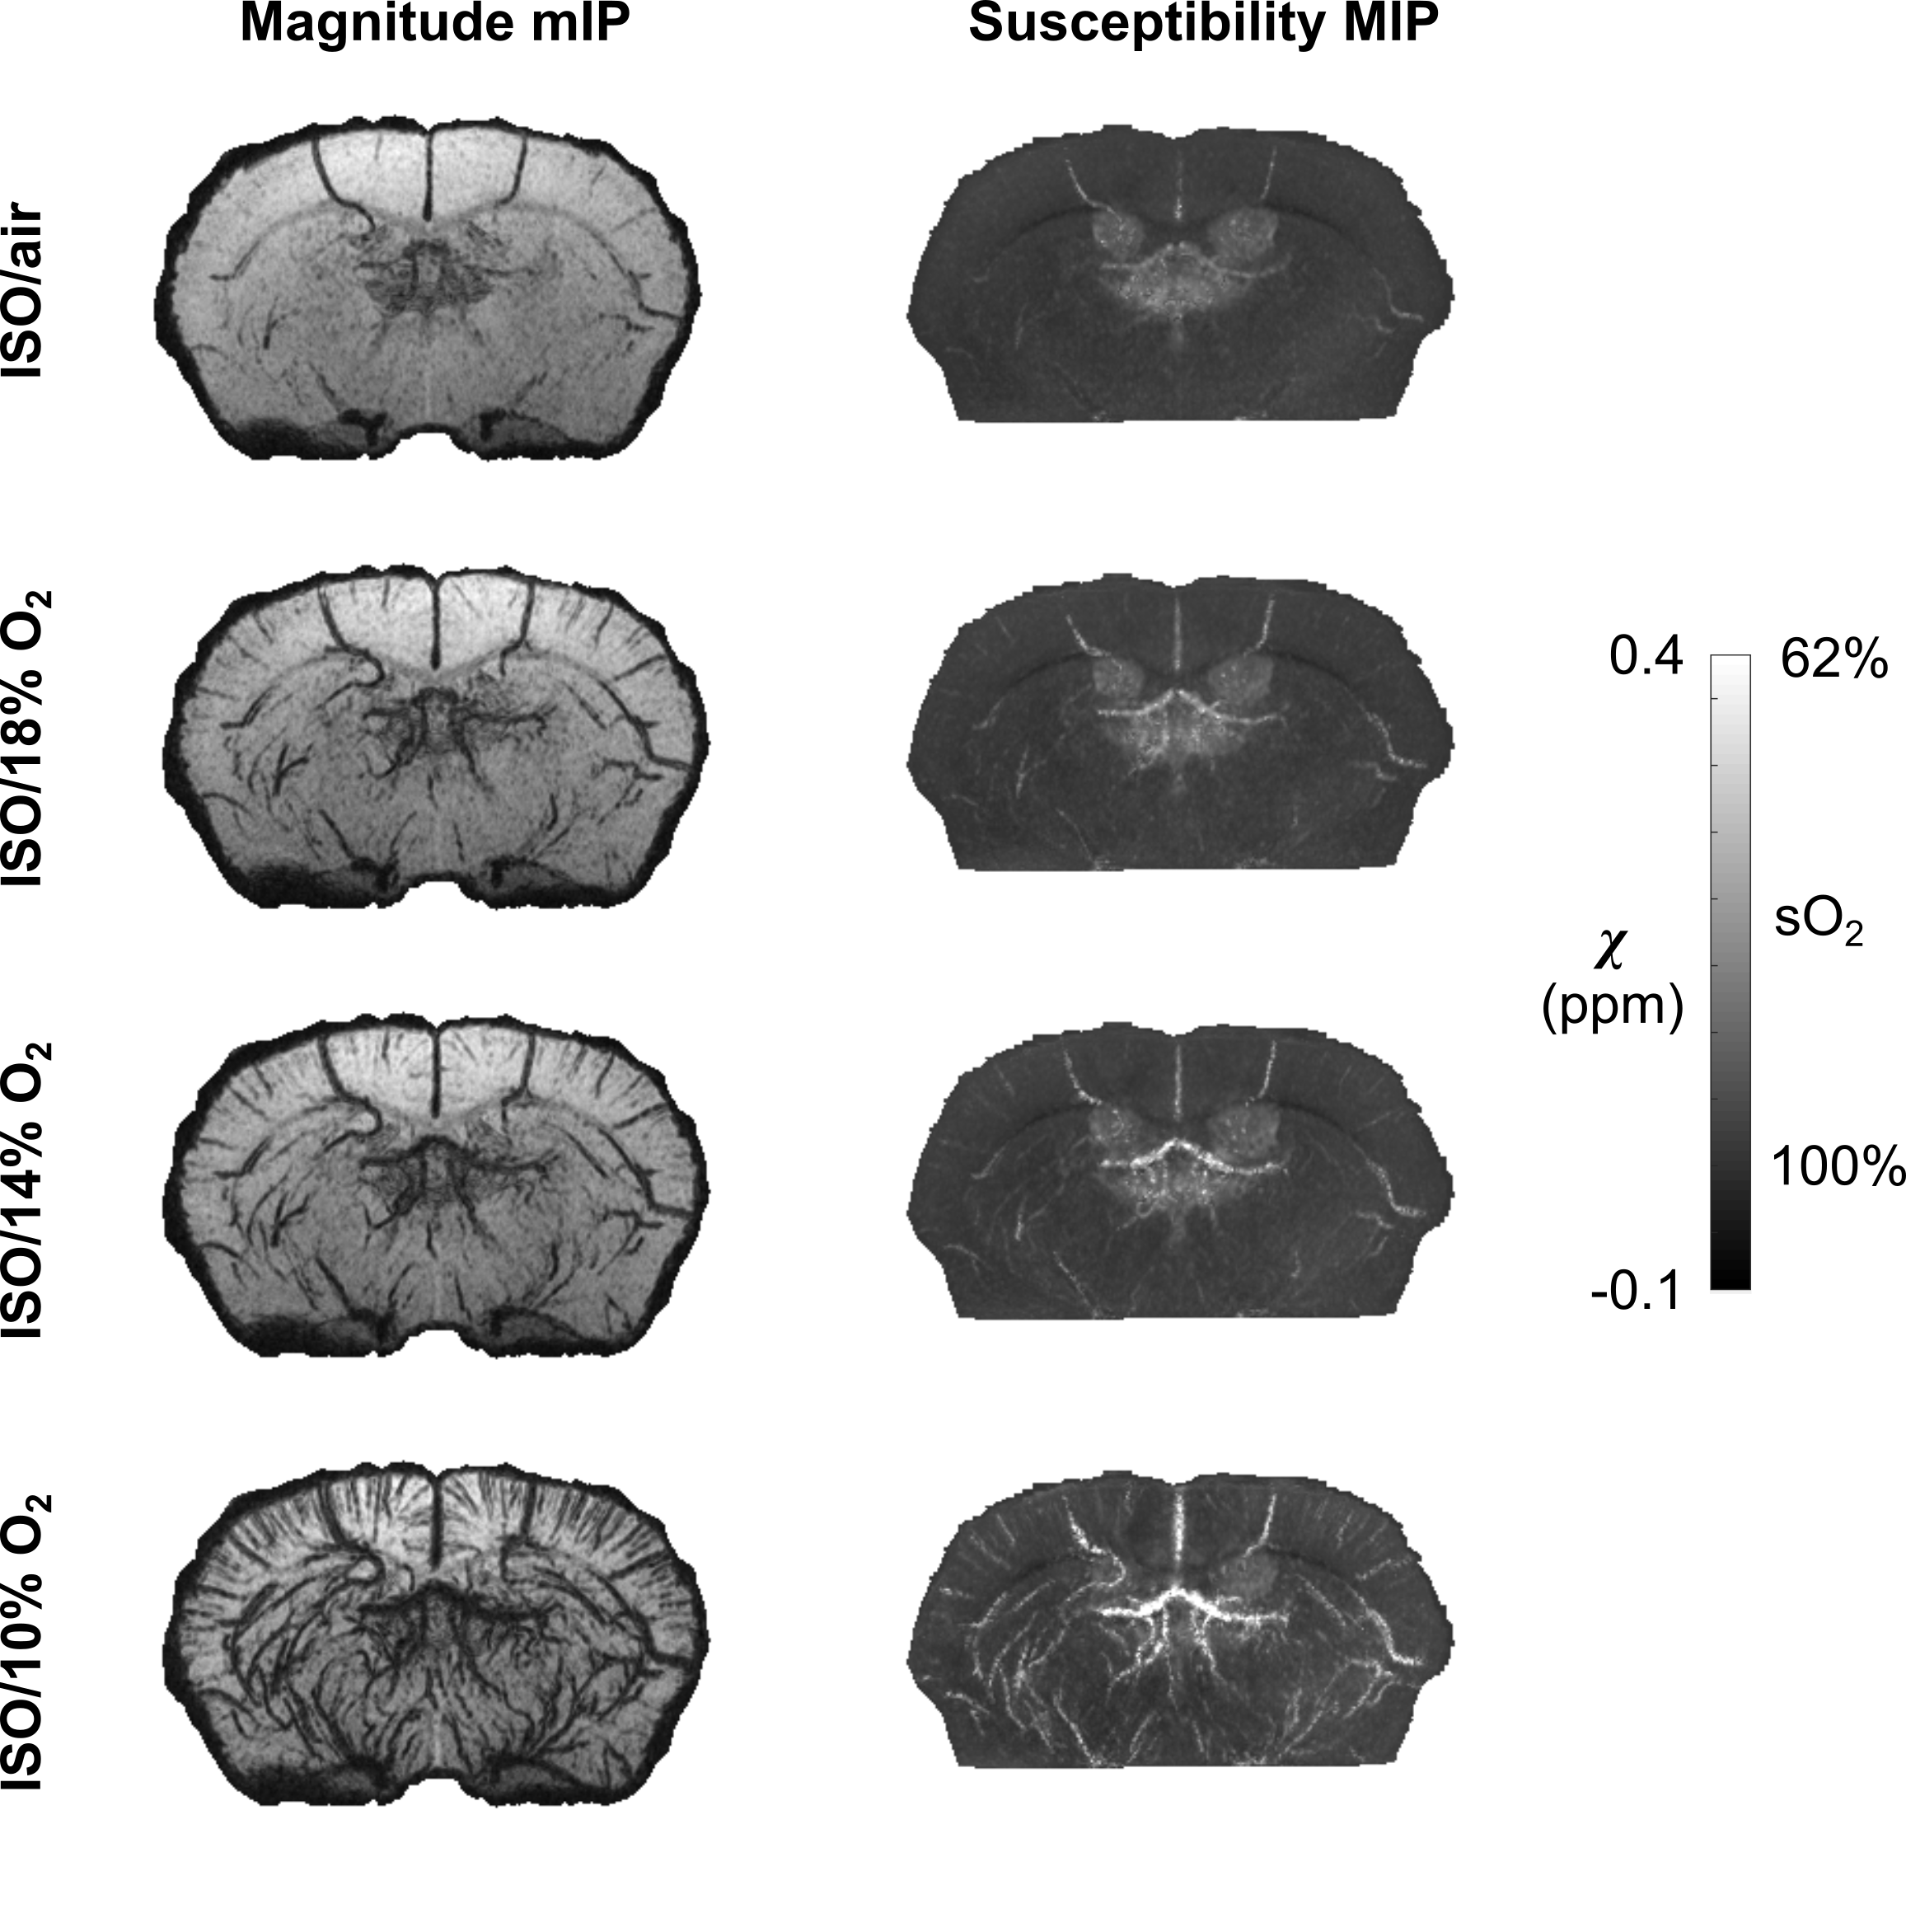
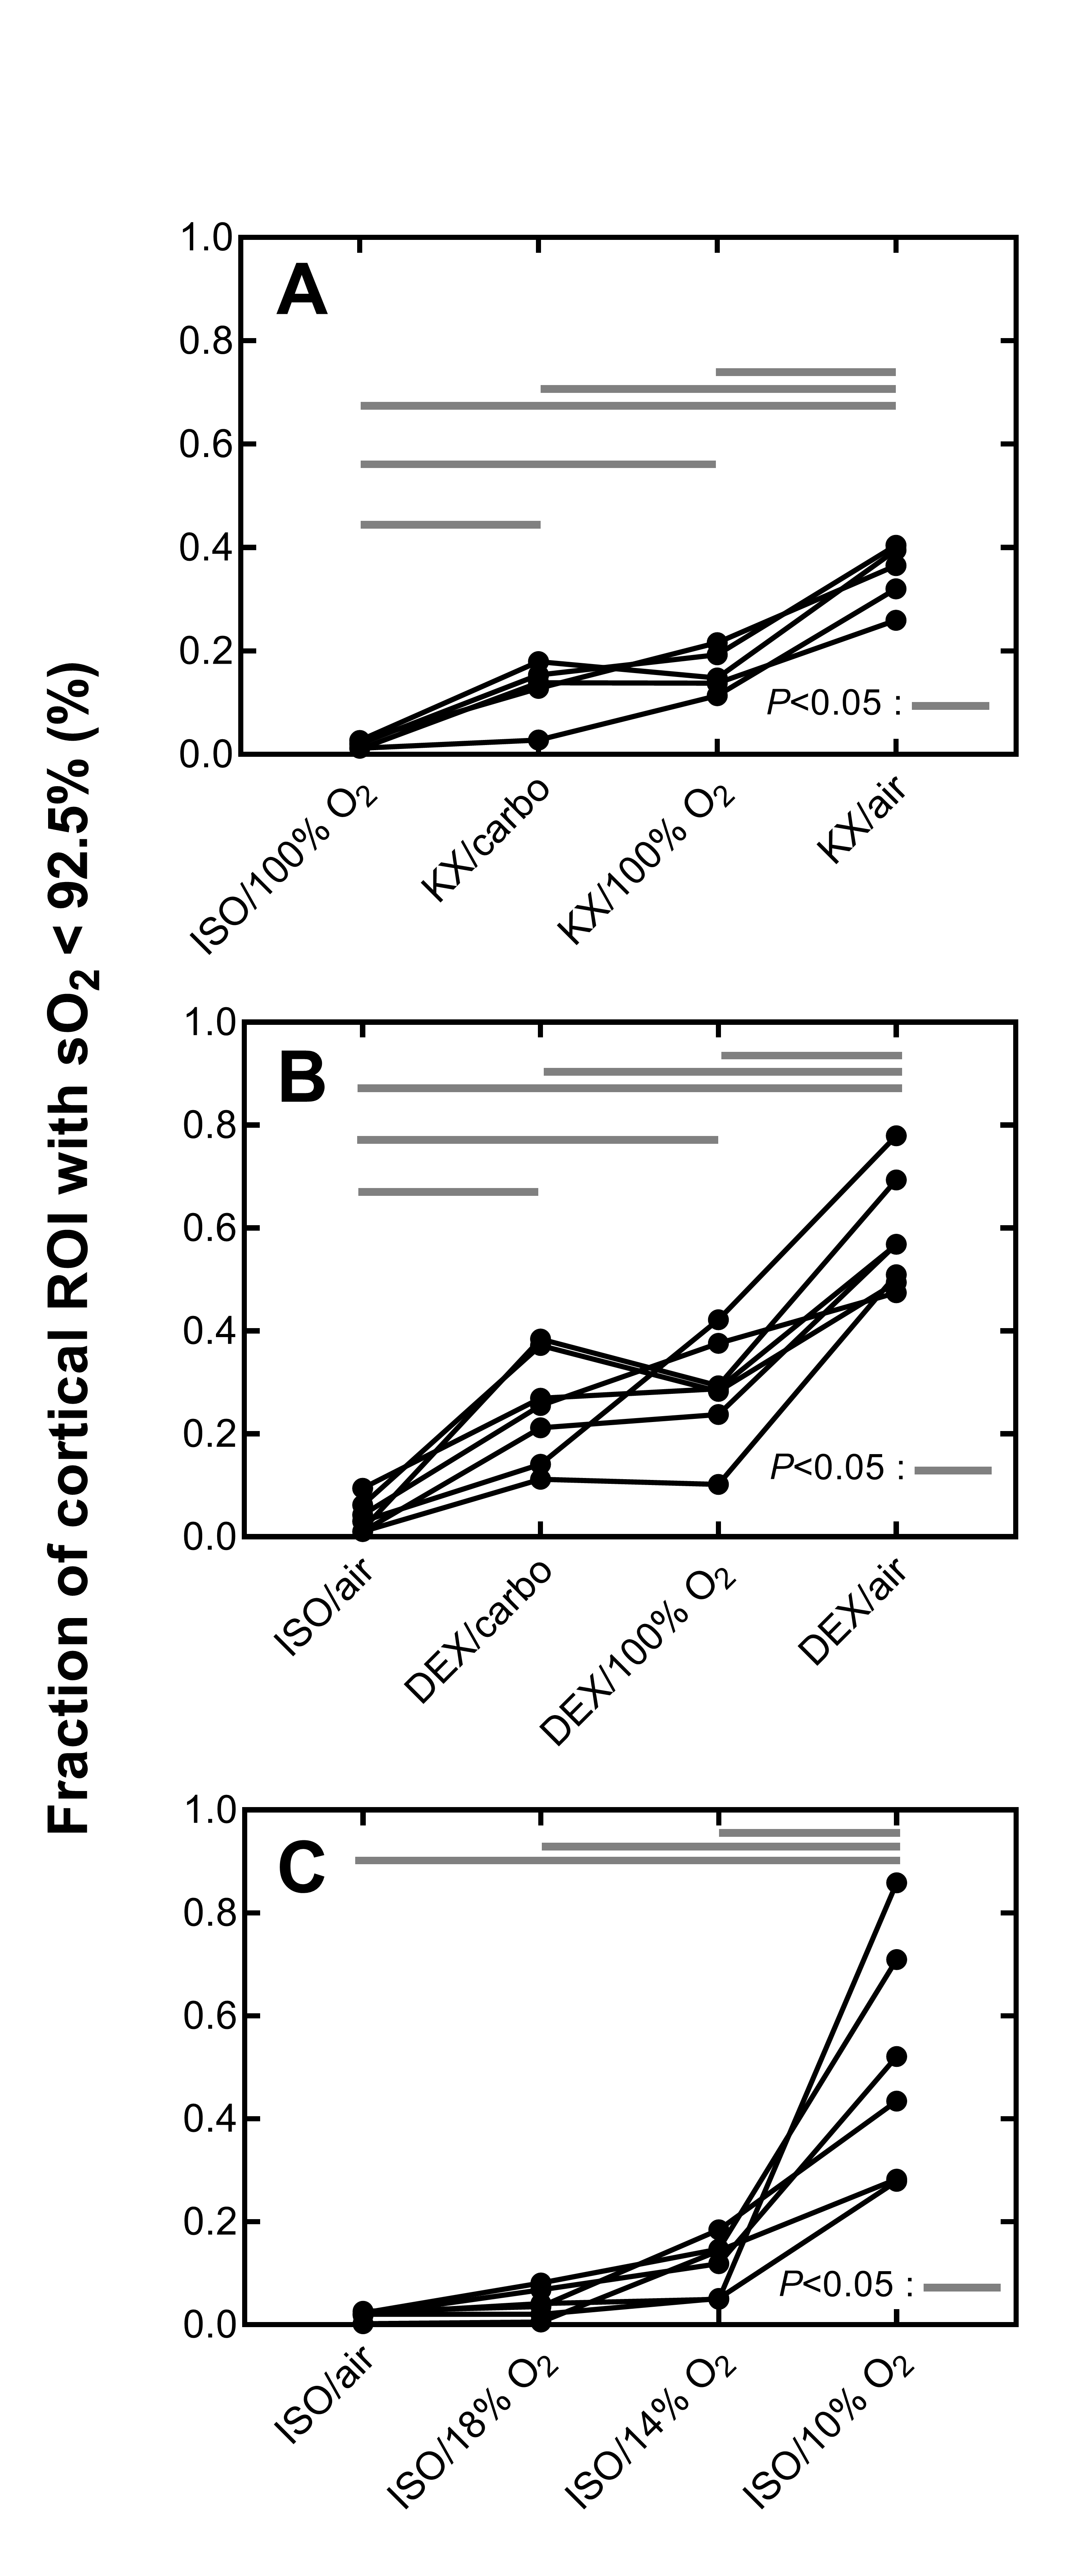
Anesthetic conditions: The anesthetics dosage was: for ISO, 1.5% in gas with flow rate 1.5 L/min; for KX, mixture of ketamine (87 mg/kg) and xylazine (13mg/kg) injected intraperitoneally; for DEX, initial bolus of 50 µg/kg followed by continuous infusion of 100 µg/kg/h, starting eight minutes after initial bolus (injections in the caudal vein). The mice breathed through a nose cone, through which gas was administered at 1.5 L/min. We tested three different gases under DEX and KX anesthesia: carbogen (5% CO2 + 95% O2), 100% O2, and medical air (21% O2 + 79% N2). Under ISO anesthesia, we tested 100% O2, medical air, 18% O2, 14% O2, and 10% O2 (the balance of the latter three gas mixtures was N2). MRI started 20 to 30 minutes after the induction of the anesthesia.Animal groups: 20 Balb/c mice were divided in three groups. Each group was imaged under a selection of four of the abovementioned anesthetic conditions, which are listed in Figure 1A. Within each group, every selected anesthetic condition was tested on each mouse, one week apart in a different and random order. As a positive control, mice in Group 1 were also imaged under ISO/100% O2 after intravenous injection of Resovist.
MRI: A 7T scanner (Varian Inc., Palo Alto, CA) and a dedicated mouse head-coil (RAPID MR International, Columbus, OH) were used to acquire a slab-selective 3D gradient-echo sequence with TR=50ms, TE=25ms, flip angle=15˚, acquisition bandwidth=26.2kHz, FOV=20x15x10 mm3, voxel size=78.1x78.1x104.2 µm3, 2 averages, and flow compensation in all directions.
Image analysis: An in-house atlas was registered to each data set for brain segmentation and region identification. QSM susceptibility ($$$\chi$$$) maps were generated from the gradient-echo images using scaling of the phase with 1/TE for frequency estimation, path-based phase unwrapping1, V-SHARP2 for background field removal, and HEIDI3 for field-to-susceptibility inversion. For referencing the susceptibility maps, the average susceptibility value in a region-of-interest (ROI) excluding large vessels in the cerebral cortex was subtracted (the ROI is shown in figure 1B). Susceptibility values were then scaled to blood sO2 values using:
$$\mathrm{sO_2}=1-\frac{\Delta\chi_{blood-ROI}}{\Delta\chi_{do}\cdot\mathrm{Hct}}$$
where $$$\Delta\chi_{blood-ROI}$$$ is the susceptibility difference between blood and a ROI (in our case the cerebral cortex ROI), $$$\Delta\chi_{do}=$$$2.26ppm is the susceptibility difference between fully deoxygenated and oxygenated blood at 100% hematocrit4, and Hct is the hematocrit, estimated to be 0.45,6. To analyze changes in sO2 between anesthetic regimes, the voxels with susceptibility difference larger than 0.08 ppm (corresponding to sO2 lower than 92.5% for voxels primarily composed of blood; see scale bar in Figures 2-4) were thresholded within the cerebral cortex ROI (Figure 1B). This yielded a cortical low-sO2 volume fraction, which was used for statistical comparison between conditions using a one-way ANOVA with a Tukey correction for multiple comparisons. P<0.05 was considered significant.
Results and discussion
Both magnitude and susceptibility maps are strongly affected by anesthetic regimes. This is apparent visually (Figures 2-4) and quantitatively (Figure 5). Statistical comparisons within Groups 1 and 2 show that for equivalent breathing gases, KX and DEX produce larger low-sO2 volumes than ISO in the cerebral cortex (Figure 5 A and B). This is in line with results obtained in the rat with other methods7,8 and with the fact that xylazine and DEX are $$$\alpha_\mathrm{2}$$$-adrenergic receptor agonists causing significant reduction in rodents cerebral blood flow compared to ISO9–12. Figure 5C shows that under ISO, the fraction of inhaled oxygen has to be lowered between 10% and 14% to yield low-sO2 volume fractions similar to those obtained under KX/medical air and DEX/medical air.Reported sO2 values for ISO conditions are within the same range as those reported for the rat with a similar method13 and for the mouse with microscopy14. The assumptions made in scaling susceptibility maps to absolute values of sO2 require further validation.
Conclusion
QSM is a sensitive tool for the non-invasive detection and quantification of changes in mouse cerebral sO2 associated with the use of common anesthetics. It allowed us to quantify how the mouse’s cerebral sO2 changes under ISO, KX, or DEX anesthesia. QSM is useful to better understand the effects of anesthesia on mouse brain physiology and on various MR measures linked to sO2, such as BOLD-fMRI.Acknowledgements
Jérémie P. Fouquet is supported by a NSERC scholarship and by a QBIN international training award. The authors thank Mélanie Archambault and Dina Sikpa for animal manipulation. This work was funded by CIHR. Andreas Deistung was supported by the German Research Foundation (DFG, DE 2516/1-1).References
1. Abdul-Rahman, H. S. et al. Fast and robust three-dimensional best path phase unwrapping algorithm. Appl. Opt. 46, 6623–6635 (2007).
2. Li, W., Wu, B. & Liu, C. Quantitative susceptibility mapping of human brain reflects spatial variation in tissue composition. Neuroimage 55, 1645–1656 (2011).
3. Schweser, F., Sommer, K., Deistung, A. & Reichenbach, J. R. Quantitative susceptibility mapping for investigating subtle susceptibility variations in the human brain. Neuroimage 62, 2083–2100 (2012).
4. Weisskoff, R., Zuo, C. S., Boxerman, J. L. & Rosen, B. R. Microscopic susceptibility variation and transverse relaxation: Theory and experiment. Magn. Reson. Med. 31, 601–610 (1994).
5. O’Connell, K. E. et al. Practical murine hematopathology: A comparative review and implications for research. Comp. Med. 65, 96–113 (2015).
6. Lin, W., Paczynski, R. P., Celik, A., Hsu, C. Y. & Powers, W. J. Experimental hypoxemic hypoxia: Effects of variation in hematocrit on magnetic resonance T2*-weighted brain images. J. Cereb. Blood Flow Metab. 18, 1018–1021 (1998).
7. Ciobanu, L., Reynaud, O., Uhrig, L., Jarraya, B. & Le Bihan, D. Effects of anesthetic agents on brain blood oxygenation level revealed with ultra-high field MRI. PLoS One 7, e32645 (2012).
8. Uhrig, L., Ciobanu, L., Djemai, B., Le Bihan, D. & Jarraya, B. Sedation Agents Differentially Modulate Cortical and Subcortical Blood Oxygenation: Evidence from Ultra-High Field MRI at 17.2 T. PLoS One 9, e100323 (2014).
9. Petrinovic, M. M. et al. A novel anesthesia regime enables neurofunctional studies and imaging genetics across mouse strains. Sci. Rep. 6, 24523 (2016).
10. Lei, H. et al. The effects of ketamine-xylazine anesthesia on cerebral blood flow and oxygenation observed using nuclear magnetic resonance perfusion imaging and electron paramagnetic resonance oximetry. Brain Res. 913, 174–179 (2001).
11. Franceschini, M. A. et al. The effect of different anesthetics on neurovascular coupling. Neuroimage 51, 1367–1377 (2010).
12. Maekawa, T., Tommasino, C., Shapiro, H. M., Keifer-Goodman, J. & Kohlenberger, R. W. Local cerebral blood flow and glucose utilization during isoflurane anesthesia in the rat. Anesthesiology 65, 144–51 (1986).
13. Hsieh, M. C., Kuo, L. W., Huang, Y. A. & Chen, J. H. Investigating hyperoxic effects in the rat brain using quantitative susceptibility mapping based on MRI phase. Magn. Reson. Med. 77, 592–602 (2017).
14. Lyons, D. G., Parpaleix, A., Roche, M. & Charpak, S. Mapping oxygen concentration in the awake mouse brain. Elife 5, 1–16 (2016).
Figures