1948
Quantitative in vivo 19F MRI of mouse brain inflammation using a cryogenic RF surface probe and RARE
Paula Ramos Delgado1, Christian Prinz1, Jason M. Millward1, Helmar Waiczies2, Ludger Starke1, Joao Periquito1, Laura Boehmert1, Thoralf Niendorf1,3, Andreas Pohlmann1, and Sonia Waiczies1
1Berlin Ultrahigh Field Facility (B.U.F.F), Max Delbrück Center for Molecular Medicine in the Helmholtz Association, Berlin, Germany, 2MRI.tools GmbH, Berlin, Germany, 3Experimental and Clinical Research Center, a joint cooperation between the Charité Medical Faculty and the Max Delbrück Center for Molecular Medicine in the Helmholtz Association, Berlin, Germany
1Berlin Ultrahigh Field Facility (B.U.F.F), Max Delbrück Center for Molecular Medicine in the Helmholtz Association, Berlin, Germany, 2MRI.tools GmbH, Berlin, Germany, 3Experimental and Clinical Research Center, a joint cooperation between the Charité Medical Faculty and the Max Delbrück Center for Molecular Medicine in the Helmholtz Association, Berlin, Germany
Synopsis
The low SNR inherent to fluorine (19F) MRI necessitates sensitivity-enhancing methods. SNR-efficient imaging techniques such as RARE and SNR-enhancing cryogenically-cooled RF coils (CRP) create new challenges. The strong spatially-varying B1 fields of transceive surface RF coils hamper quantification and no analytical signal intensity equation for B1+ correction exists for RARE. We developed a B1 correction method that makes use of experimental data to model the signal intensity from RARE and we established a workflow to correct and quantify 19F MR signals originating from inflammatory regions of the mouse brain that were acquired using a 19F-CRP.
Introduction
Fluorine (19F) MRI shows promise in a broad range of biomedical applications1-8 and supports in vivo quantification of exogenous fluorinated compounds9-10. However, 19F MRI is constrained by inherently low detection limits and SNR. To overcome these challenges, sensitivity-promoting technologies such as surface RF coils11 are used. In particular, cryogenically-cooled transceive surface RF antennas (CRP) have meant a paradigm shift in preclinical imaging of X-nuclei, providing impressive SNR gains compared with room temperature RF coils12-13. However, a major limitation of surface coils is their strong B1 inhomogeneities11,13-14 which hamper quantification. Moreover, quadrature CRP technologies are only offered as single-tuned for some X-nuclei such as 19F, which complicates registration on anatomical images13. Likewise, B1+ correction techniques are only available for MRI sequences for which an analytical equation that relates signal intensity (SI) and flip angle (FA) exists15-16. Recently we showed a method to correct B1 inhomogeneities employing a CRP and an SNR-efficient technique like RARE using 1H-MRI based on experimentally-modeling its SI as a function of FA and T117. Here we have established a workflow to facilitate 19F quantification for 19F-CRP and RARE imaging with the ultimate goal of monitoring and quantifying inflammation in the experimental autoimmune encephalomyelitis (EAE) mouse model.Methods
Experiments were performed on a 9.4T animal MR scanner (Bruker BioSpin, Ettlingen, Germany).Phantom and in vivo MR measurements
A phantom was prepared with nanoparticles (NPs) containing perfluoro-15-crown-5-ether (PFCE) diluted in phosphate buffered saline at 4 concentrations (10/10/25/50mM) in micro-haematocrit tubes embedded in a 15ml tube, (Fig.4A). EAE was induced in n=4 SJL/J mice3 and 10μM of NP was administered i.v. for 12 days18. Mice were euthanized and fixed with 4% paraformaldehyde and the skull embedded in 15ml tubes for ex vivo phantoms (n=3).
T1 values of two NPs preparations (300mM, 20mM in 2% agarose) and the ex vivo samples were calculated using non-localized spectroscopy (block pulse: 10TRs, 250-10000ms). T1 values in the brain after NP administration were calculated using localized spectroscopy (PRESS) in the ex vivo phantoms (12TRs, 250-15000ms) and in vivo (n=2, 8TRs, 412.5-13000ms). All T1 measurements were performed with a 18.4mm-mouse head volume RF coil.
Anatomical images (FLASH: TE/TR=3.72/120ms, resolution=(260x260)µm2, 5 slices of 2mm thickness with 0.5mm gap, 13.5min) were acquired with a 72mm-volume resonator placed around the center tube of the 19F-CRP using an in-house built system to keep positioning consistent between measurements. 19F MRI of the phantom (RARE: TE/TR=5.08/1000ms, ETL=32, BW=50kHz, centric encoding with flipback, same geometry, 30min) was acquired with the 19F-CRP. In vivo measurements were performed using the same procedure (n=1, RARE: same parameters, 50min). 19F-CRP reference power adjustments were performed on a 2mm coronal slice close to the surface using a flexible reference band containing 300mM PFCE-NPs in 2% agarose placed on top of the phantom/ mouse.
Model-based B1 correction method
B1 maps were computed on a 15ml tube filled with 33% TFE in water doped with gadolinium (T1:530ms) using the double FA method (B1+)19-20 and the low FA approximation (B1-)21-22. A RARE SI model was calculated from RARE scans (parameters as above, FA 5º-165º) of 16 NMR tubes containing aqueous solutions of gadolinium (T1:190–2870ms) using a volume resonator. The corrected images were calculated as described17 and overlaid on the anatomical images. Image post-processing was performed using MATLAB. The acquisition and post-processing pipeline is described in Fig.1.
Quantification
The reference band image acquired with the 19F-CRP was used to quantify the corrected 19F MR signal, using a correction factor calculated from the SI model (regression) that approximates its B1-corrected SI (related to its T1 value) and that of the sample (different T1 value) to avoid over-/underestimations.
Results
We first performed FA and B1- maps of the 19F-CRP (Fig.2A-B) and studied the RARE SI dependency on FA and T1 (Fig.2C) to perform B1 correction. T1 values for PFCE-NPs agreed with published values23-25 (1035.7±25.9ms, Fig.3A); ex vivo T1 values were 810.8±57.2ms and 818.1±13.4ms for non-localized (Fig.3B) and PRESS (Fig.3C), respectively, and in vivo T1 values in the brain were 1868.7±43.9ms (Fig.3D). We corrected the original phantom (Fig.4C-D) and in vivo (Fig.4E-H) 19F MR images acquired with the 19F-CRP, and showed that errors in corrected capillary phantom images were reduced relative to reference images (volume resonator), when compared to uncorrected images (Fig. 4A). Using the concentration of PFCE-NPs in the reference band, we calculated concentration maps for two exemplary in vivo slices (Fig.5).Conclusions
Here we show the first in vivo 19F images of the inflamed mouse brain using the 19F-CRP and RARE, and the first T1 values calculated for 19F NP in the mouse brain under physiological conditions. With this information and with data from phantom experiments we created a RARE SI model and could correct the strong B1 inhomogeneities and quantify the 19F MR signal. We established a workflow that enables 19F and anatomical imaging with a single-tuned cryogenic RF surface probe, to correct B1 inhomogeneities produced by the transceive characteristics of the 19F-CRP and to allow 19F signal quantification. These results will be invaluable for spearheading future studies that implement the superior SNR benefits of the 19F-CRP13 to monitor and quantify inflammation as well as 19F compounds in vivo and longitudinally.Acknowledgements
This work was supported by the Deutsche Forschungsgemeinschaft to S.W. (DFG-WA2804) and A.P. (DFG-PO1869).References
- Khalil AA, et al. Longitudinal 19F magnetic resonance imaging of brain oxygenation in a mouse model of vascular cognitive impairment using a cryogenic radiofrequency coil. MAGMA (2019); 32(1): 105-14.
- Waiczies H, et al. Visualizing brain inflammation with a shingled-leg radio-frequency head probe for 19F/1H. Sci Rep (2013); 3: 1280.
- Flögel U, et al. Noninvasive detection of graft rejection by in vivo 19F MRI in the early stage. Am J Transplant (2011); 11(2): 235-44.
- van Heeswijk RB, et al. Fluorine-19 magnetic resonance angiography of the mouse. PloS ONE (2012); 7(7): e42236.
- Bar-Shir A, et al. Single 19F probe for simultaneous detection of multiple metal ions using miCEST MRI. J Am Chem Soc (2015); 137(1): 78-81.
- Moonshi S, et al. A unique 19F MRI agent for the tracking of non phagocytic cell in vivo. Nanoscale (2018); 10: 8226-39.
- Ribot EJ, et al. In vivo MR detection of fluorine-labeled human MSC using the bSSFP sequence. Int J Nanomedicine (2014); 9: 1731-39.
- Bonetto F, et al. A novel 19F agent for detection and quantification of human dendritic cells using magnetic resonance imaging. Int J Cancer (2012); 129(2): 365-73.
- Ruiz-Cabello J, et al. Fluorine (19F) MRS and MRI in biomedicine. NMR Biomed (2011); 24(2):114-129.
- Waiczies S, Ji Y, Niendorf T. Tracking methods for dendritic cells. Fluorine Magnetic Resonance Imaging (2017); chapter 9: 243-281.
- Axel L, Hayes C. Surface coil magnetic resonance imaging. Archives Internationales de Physiologie et de Biochimie (1985); 93(5): 11-18.
- Sack M, et al. Signal-to-noise ratio of a mouse brain 13C CryoProbeTM system in comparison with room temperature coils: spectroscopic phantom and in vivo results. NMR Biomed (2014); 27(6): 709-715.
- Waiczies S, et al. Enhanced fluorine-19 MRI sensitivity using a cryogenic radiofrequency probe: technical developments and ex vivo demonstration in a mouse model of neuroinflammation. Sci Rep (2017); 7: 9808.
- Baltes C, et al. Micro MRI of the mouse brain using a novel 400 MHz cryogenic quadrature RF probe. NMR Biomed (2009); 22(8): 834-42.
- Wang J, Qiu M, Constable R T. In vivo method for correcting transmit/receive nonuniformities with phased array coils. Magn Reson Med (2005); 53: 666-674.
- Vernikouskaya, I, et al. Quantitative 19F MRI of perfluoro-15-crown-5-ether using uniformity correction of the spin excitation and signal reception. MAGMA (2019); 32(1): 25-36.
- Ramos Delgado P, et al. Retrospective transmission field (B1+) and sensitivity profile (B1-) correction for transceive surface RF coils: an empirical solution for RARE. Proceedings of ISMRM Montréal 2019.
- Waiczies H, et al. Perfluorocarbon particle size influences magnetic resonance signal and immunological properties of dendritic cells. PLoS One (2011); 6(7): e21981.
- Akoka, S, et al. Radiofrequency map of an NMR coil by imaging. Magn Reson Imaging (1993); 11:437-441.
- Insko, EK, et al. Mapping of the radiofrequency field. J Magn Reson (1993); A103:82-85.
- Ibrahim T S, Hue Y-K, Tang L. Understanding and manipulating the RF fields at high field MRI. NMR in Biomed (2009); 22: 927-36.
- Pauly J, Nishimura D, Macovski A. A k-space analysis of small-tip-angle excitation. J Magn Reson (1989); 43-56.
- Prinz C, et al. Toward 19F magnetic resonance thermometry: spin-lattice and spin-spin relaxation times and temperature dependence of fluorinated drugs at 9.4 T. MAGMA (2019); 32(1): 51-61.
- Kadayakkara DK, et al. 19F spin-lattice relaxation of perfluoropolyethers: dependence on temperature and magnetic field (7.0-14.1 T). J Magn Reson (2014); 242C: 18-22.
- Colotti R, et al. Characterization of perfluorocarbon relaxation times and their influence on the optimization of fluorine-19 MRI at 3 tesla. Magn Reson Med (2017); 77(6):2263-2271.
Figures
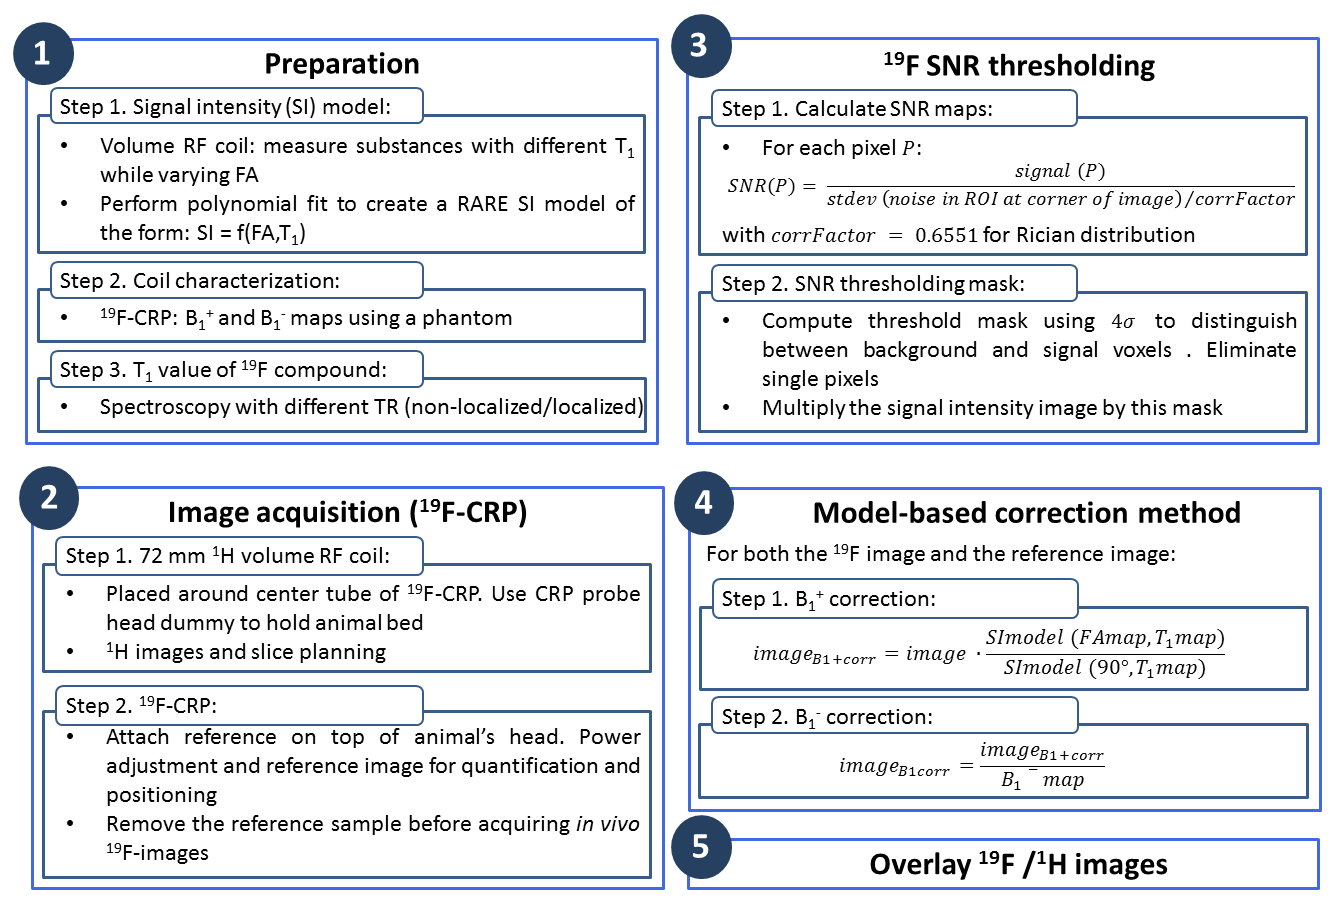
Figure 1. Acquisition and post-processing
pipeline description used for 19F imaging with the
cryogenically-cooled transceive quadrature surface 19F probe and 1H
imaging with a volume resonator.
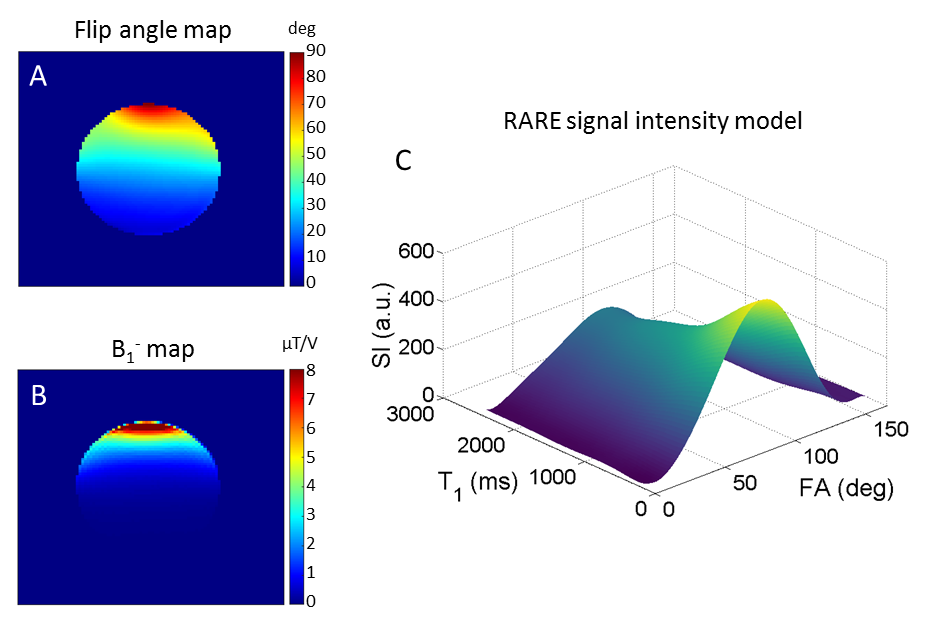
Figure 2. (A) Flip angle (FA) map and (B) B1- map
associated to the 19F-CRP, (C)
3D view of the calculated RARE
signal intensity (SI) model for retrospective B1 correction. The strong intrinsic spatial gradient in the excitation
field produces a spatially-varying excitation FA, severely hampering
quantification. Coil sensitivity (B1-) is also spatially
dependent. The computed model relates SI with FA and T1, replacing
the otherwise needed analytical SI equation.
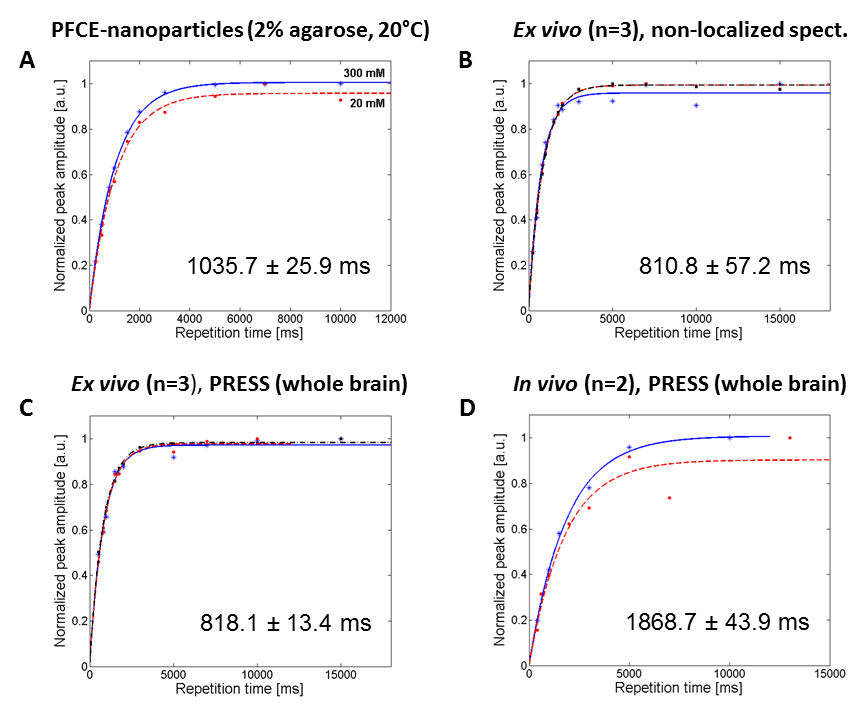
Figure 3. (A) T1 curves corresponding
to 20mM and 300mM PFCE nanoparticles in 2% agarose at room temperature with
non-localized spectroscopy, (B) T1
curves ex vivo (n=3, each a different
color) with non-localized spectroscopy, (C)
T1 curves ex vivo with
PRESS (n=3, each a different color), (D)
T1 curves in vivo with
PRESS (n=2, each a different color).
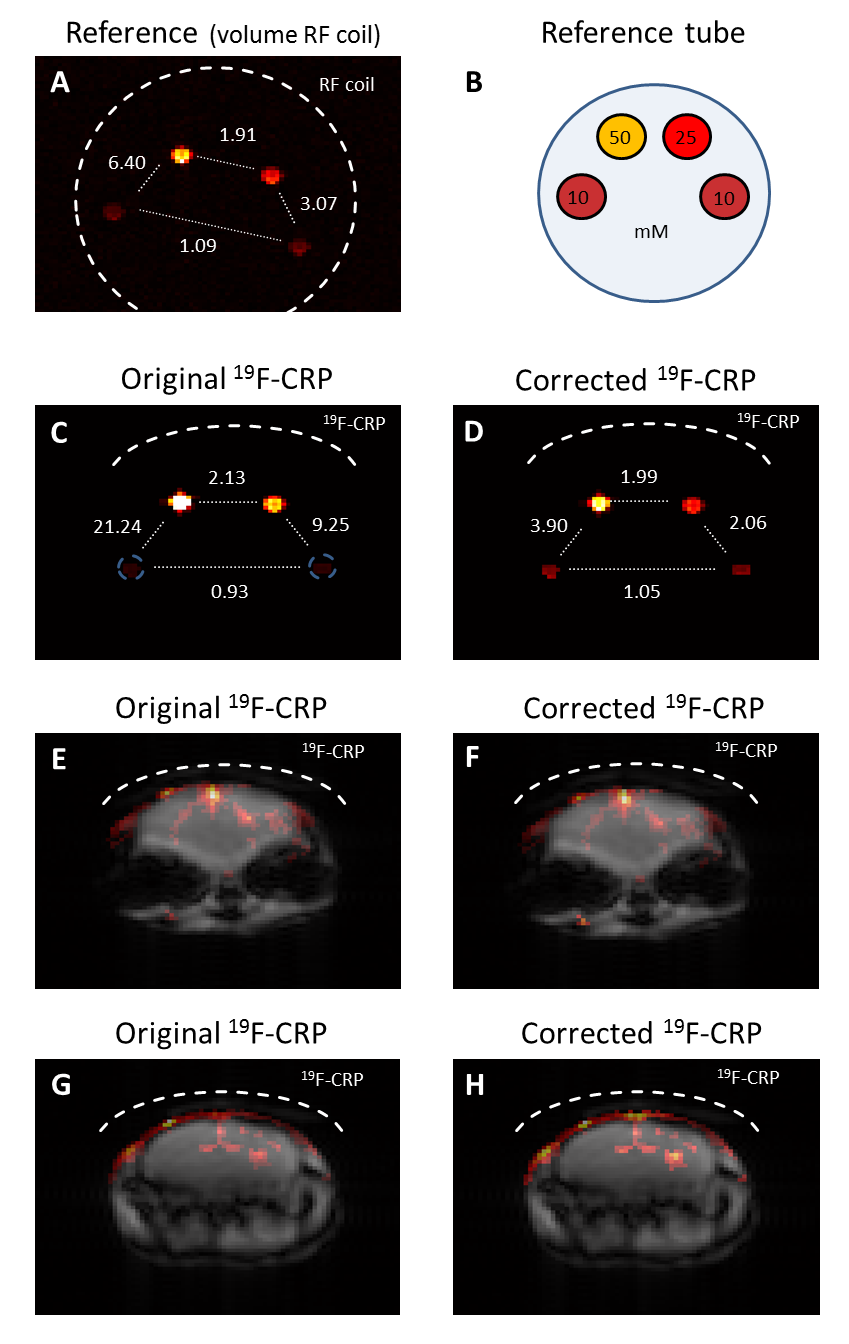
Figure 4. First in vivo 19F MRI of inflamed
mouse brain using the 19F-CRP including correction of 19F
signal intensity. (A) reference capillary
phantom image, (B) setup of
reference capillary phantom showing different NP concentrations (mM), (C-D) original and corrected 19F-CRP
images for the capillary tube. Ratios of the signal intensities were calculated for pairs of tubes and
are shown between them. (E-H) original
and corrected in vivo images for two exemplary
slices. The dashed lines show the RF coil position.
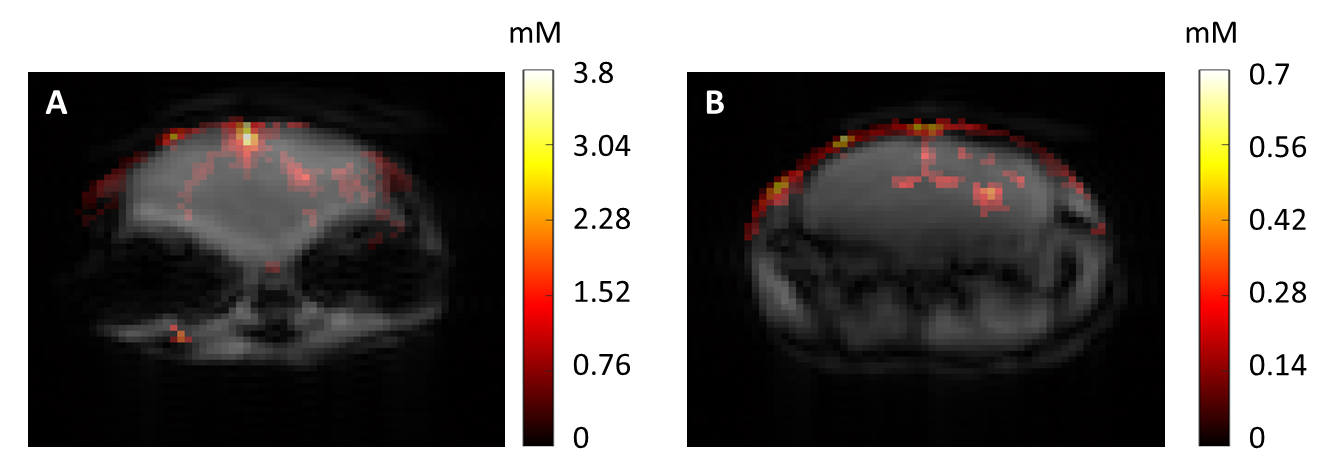
Figure 5. In vivo quantification of mouse brain inflammation
using the superior SNR of the 19F-CRP and B1 correction
method. The red colour scale represents the concentration of
nanoparticles in the in vivo images
(in mM).