1946
In-vivo measurements of physiological optics of mouse crystallin lens using MRI1School of Optometry and Vision Science, University of Auckland, Auckland, New Zealand, 2Department of Radiology, School of Medicine, Stony Brook University, Stony Brook, NY, United States, 3Department of Physiology, School of Medical Sciences, University of Auckland, Auckland, New Zealand, 4Department of Physiology & Biophysics, School of Medicine, Stony Brook University, Stony Brook, NY, United States
Synopsis
The physiological optics of the crystallin lens depend on its water content, water-bound protein ratios and surface geometry1,2. To maintain these properties, the lens generate a circulating flux of ions that actively removes water from the lens center via an intracellular pathway mediated by gap junction channels3. In this study, we established and optimised T1&T2 mapping and structural scan to study the physiological optics the mouse lens at 7T. These protocols were then applied to a transgenic mouse model in which we have genetically modified the number of gap junction channels to alter the removal of water from the lens.
Purpose
MR-parametric (T1&T2) mappings and high-resolution structural imaging have been previously used to investigate the water content, water-bound protein ratios and geometry of the lens, which are essential for the lens physiological optics.2,3 In this study, we aim to develop and optimise in-vivo MR-parametric (T1&T2) mapping and high-resolution structural protocols, which can non-invasively be applied to wild type and transgenic mouse models to study the physiological optics of the lens using a 7T pre-clinical MRI.Methods
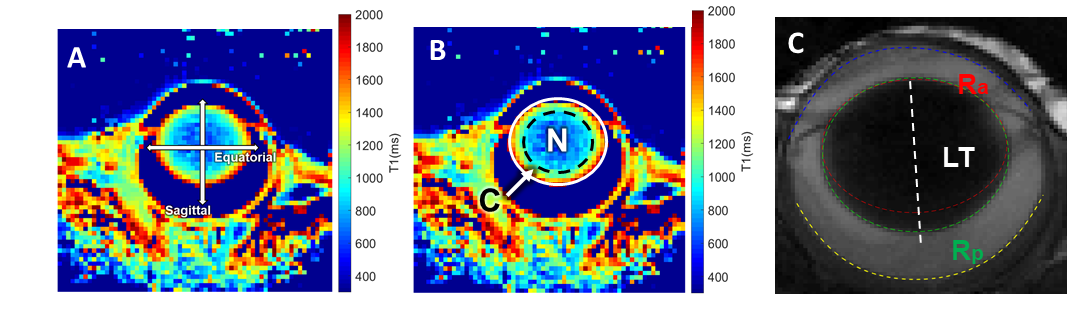
MRI was performed on a 7T preclinical scanner (Brucker, Billerica, MA) with a 650mT/m gradient and a customised circular surface coil receiver (6mm) placed on the left eye of the mouse. The imaging plane was located on the central axis of the lens, bisecting the eye into superior and inferior halves. T1 mapping utilised a rapid acquisitions with refocused echoes (RARE) with variable TRs (200, 380, 620, 950, 1500 and 4000ms) and a constant TE of 2.62ms. T2 mapping utilised a multi-spin echo sequence with twelve TEs (minimum TE = 2.78ms, echo spacing = 2.78ms). Both T1 and T2 were acquired with FOV = 6.4×6.4mm and matrix size = 64×64, and one slice with thickness = 0.5mm. A structural scan was acquired using a balanced steed state free precession (bSSFP) sequence with TE/TR = 2.5/5ms, FOV = 6.4×6.4mm, matrix size = 128×128, and one slice with thickness = 0.5mm.Five C57BL/6 Mice (weight: 26±2g, age = 10 weeks) and four Cx50KI46 mice (weight: 27±2g, age = 10 weeks) were studied. Cx50KI46 mice have genetically-modified lens gap junction proteins4. Mice were anesthetised with 1% isoflurane and a bolus of xylazine (6mg/k, IP). Eyes were treated with topical 1% tropicamide and 0.5% tetracaine. MRI data were post-processed using costume-written Matlab function. T1 and T2 maps were analysed by 1) taking values along equatorial/sagittal axes (Fig. 1A) and fit with a power function as in terms of distance, 2) averaging data within two regions of interests (ROI): lens nucleus (central 70% of the lens) and lens cortex (outer 30% of the lens) (Fig. 1B). Anterior and posterior lens surfaces were extracted from the bFFSP image and fitted with two ellipses, where the radius of curvatures (Ra & Rp) and lens thickness (LT) were calculated (Fig. 1C). Statistical comparisons were performed by two-sided t-test with p < 0.05 considered as significant. All results are in mean ± SD.
Results
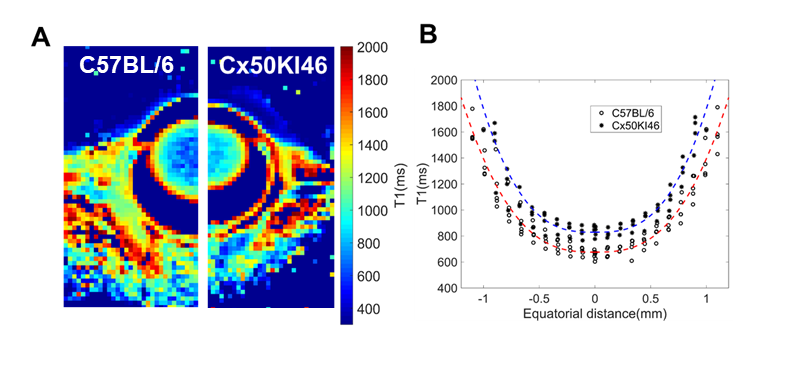
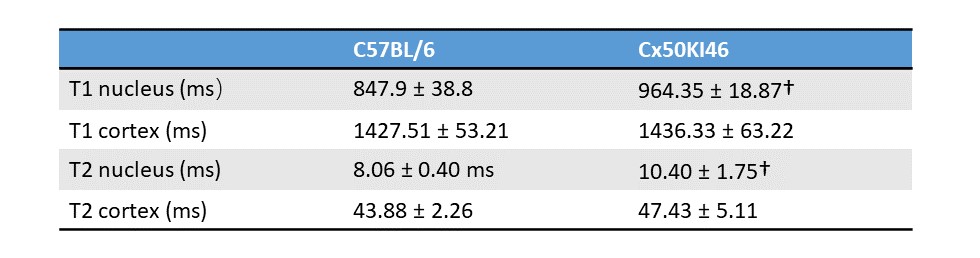
Fig. 2 and 3 show the T1 and T2 maps, along with the trend fittings for both C57BL/6 and Cx50KI46 mice. T1 and T2 ROI analysis results were presented in Fig.4. For C57BL/6J mice, the mean lens nucleus T1 and T2 were significantly higher in Cx50KI46 mice. There were no significant differences between mean T1 and T2 for the lens cortex of C57BL/6 and Cx50KI46. All lens geometry data were presented in Fig. 5. Cx57KI46 mice had reduced LT and decreased Ra and Rp compared to C57BL/6.Discussion
The optimised sequences produce high quality of the lens T1 and T2 maps, and accurately measured the lens geometry. MRI of the lens nucleus is difficult in mice due to the short T2, which is reported to be 2.1ms from an ex vivo study of rats at 9.4T5. Both T1 and T2 trends show parabolic shapes that were consistent with the patterns of water and water-bound protein ratio gradients that exist in the lens. These spatial-varying patterns produce the gradient of refractive index that is essential for the physiological optics of the lens. The bFFSP image provides high SNR, resolutions and fast acquisitions for measuring the lens geometry. Cx50KI46 mice have smaller lens size due to reduced cell proliferation6. The changes in lens size could be accurately reflected from the bSSFP imaging. Both T1 and T2 of the lens nucleus increased significantly in Cx50KI46 mice, consistent with decreasing in gap junctional coupling seen in Cx50KI467. These MRI-based methods could be useful to assess the lens physiology and optics for small animal models in-vivo and have great potential to facilitate translational studies in future.Acknowledgements
This work was supported by National Institute of Health grant EY026911.References
1. Donaldson PJ, Grey AC, Heilman BM, Lim JC, Vaghefi E. The physiological optics of the lens. Progress in retinal and eye research. 2017;56:e1-e24. 2. Jones CE, Atchison DA, Meder R, Pope JM. Refractive index distribution and optical properties of the isolated human lens measured using magnetic resonance imaging (MRI). Vision Research. 2005;45(18):2352-2366. 3. Vaghefi E, Kim A, Donaldson PJ. Active maintaince of the gradient of refractive index is required to sustain the optical properties of the lens. Invest Ophthalmol Vis Sci. 2014;56:7195-7208. 4. White TW. Unique and redundant connexin contributions to lens development. Science. 2002;295(5553):319-320. 5. Dobretsov EA, Snyynikova OA, Koptyug IV, Kaptein R, Tsentalovich YP. Magnetic resonance imaging (MRI) study of the water content and transport in rat lenses. Experimental Eye Research. 2013;113:162-171. 6. Sellitto C, Li L, White TWJIo, science v. Connexin50 is essential for normal postnatal lens cell proliferation. 2004;45(9):3196-3202. 7. Gao J, Sun X, Moore LC, White TW, Brink PR, Mathias RT. Lens intracellular hydrostatic pressure is generated by the circulation of sodium and modulated by gap junction coupling. J Gen Physiol. 2011;137(6):507-520.
Figures