1945
Cellular correlates of gray matter volume changes identified with two-photon microscopy and magnetic resonance morphometry in the mouse brain1RG Translational Imaging, Central Institute of Mental Heath, Mannheim, Germany, 2Department of Functional Neuroanatomy, Institute for Anatomy and Cell Biology, Heidelberg University, Heidelberg, Germany, 3CellNetworks Math-Clinic, Bioquant BQ001, Heidelberg University, Heidelberg, Germany
Synopsis
Insights gained from Voxel Based morphometry (VBM) tremendously advance the understanding of neurologic and psychiatric diseases. However, the cellular basis of VBM changes remains largely unclear. We used longitudinal two-photon fluorescence and magnetic resonance imaging in mice to explore the cellular basis of VBM. Our data shows that MRI volume changes are only limited reflected by physical volume changes, yet dominated by cellular composition and cytoarchitectural characteristics. This has great implications for findings in neuroimaging in general, and the novel approach introduced by this study can be applied to various disease models to potentially unravel key mechanisms of brain pathophysiology.
Introduction
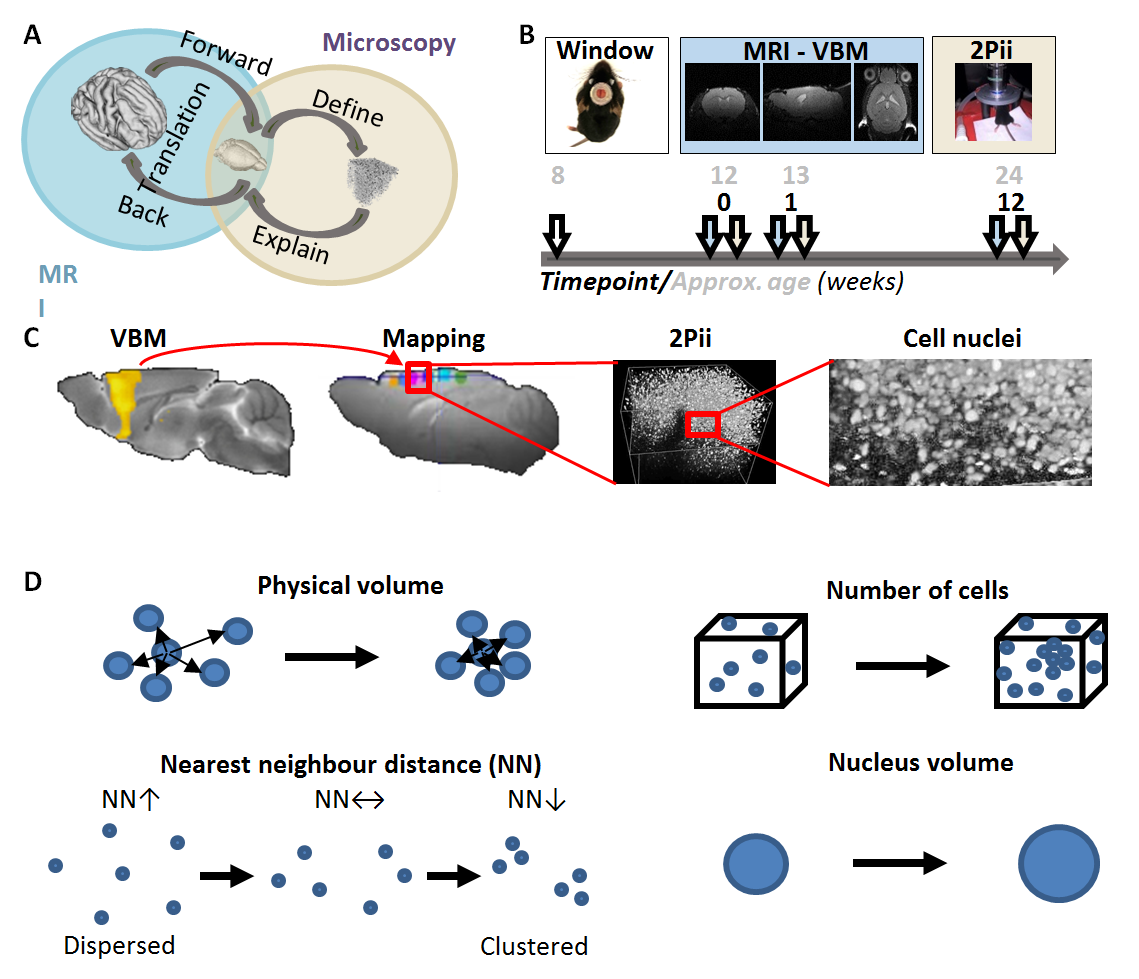
Voxel-based morphometry (VBM) has revealed changes in gray matter volume (GMV) in a range of disorders. However, the cellular basis of GMV changes remains largely unclear1,2,3. To investigate this, we designed a longitudinal neuroimaging approach that combines, in the same mice, structural MRI and two-photon in vivo imaging (2Pii), a microscopy technique well suited to image cortical volumes through implanted cranial windows4 (Fig. 1). We aimed to obtain a general, comprehensive readout to validate physical tissue volume changes on a microscopic level and gain information about cellular architecture. We used repetitive imaging of cell nuclei to determine: i) a defined physical three-dimensional space to quantify tissue shrinkage or expansion; ii) nucleus count (density); iii) the distances to neighboring nuclei; and iv) the mean volume of the nuclei as indicator for cell type composition changes. These parameters were individually correlated to the changes in VBM. The known age-dependent changes in brain volume5 were used as a test case.Methods
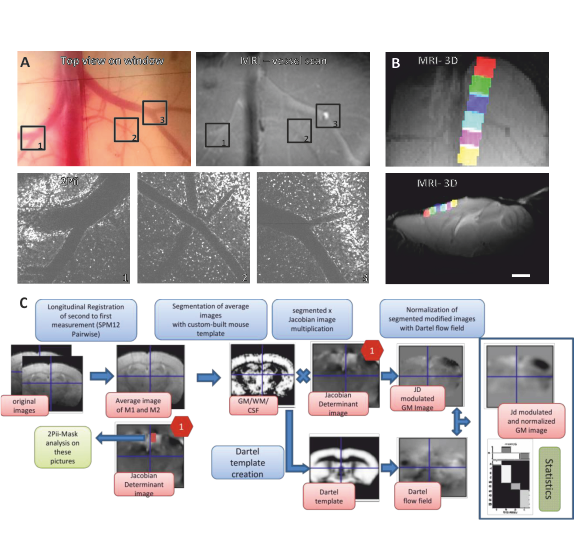
Twelve transgenic C57BL/6 mice expressing enhanced green-fluorescent protein fused to human histone H2B (‘Histone-GFP’)6, were used in this study. Cranial windows were implanted in eight week old mice. The natural brain curvature was preserved by using curved windows. Baseline MRI was acquired four weeks after window surgery and followed by 2Pii. Six 2Pii imaging positions were recorded in each animal per timepoint, linearly arranged from rostral to occipital covering large parts of the anterior- and midcingulate and motor cortices. Measurements were repeated 1 and 12 weeks after baseline.MR data were acquired under isoflurane anaesthesia in a 9.4T horizontal bore animal scanner (Bruker) with a cryogenic mouse coil. Images were acquired with a T2-weighted RARE sequence with a spatial resolution of 78x78x156µm³. Pairwise longitudinal non-linear registration was performed for each subject with SPM12 using the 1 and 12 weeks - timepoints as comparisons to baseline in order to analyse structural changes7. For the analysis of volume changes over time within the 2Pii voxels, values from the Jacobian Determinant images corresponding to each individual 2Pii mask were extracted with coregistered masks and used for correlation analysis (Fig.2).
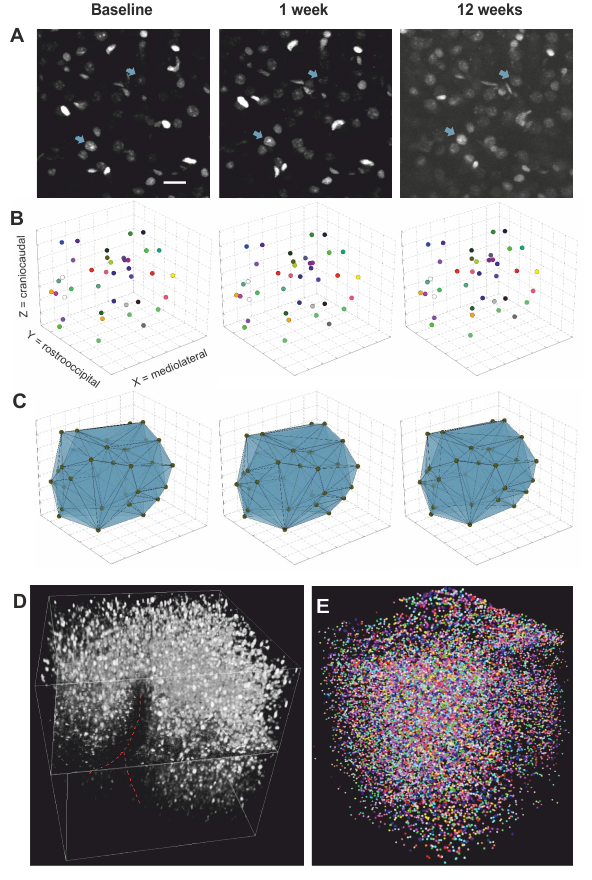
Two-Photon imaging was conducted with a TriM ScopeII microscope (LaVision) equipped with a pulsed Ti:Sapphire laser. Threedimensional image stacks where scanned with a 700x700µm² field of view in XY to a depth of 700µm below the cortex surface (voxel size 0.29x0.29x2µm³). To analyse regional cortical volume changes, we identified nuclei patterns in the image stacks that were stable over time. Every change of a volume spanned between markers was interpreted as an expansion/shrinkage of the tissue volume between them. A fully automated custom-written script using Fihi8 and the ImageJ-MATLAB plugin conducted 3D seed detection and 3D watershed segmentation. Center coordinates and volumes of all segmented nuclei were calculated. Cell density was assessed by counting all detected nuclei within the whole stack (Fig. 4).
Results
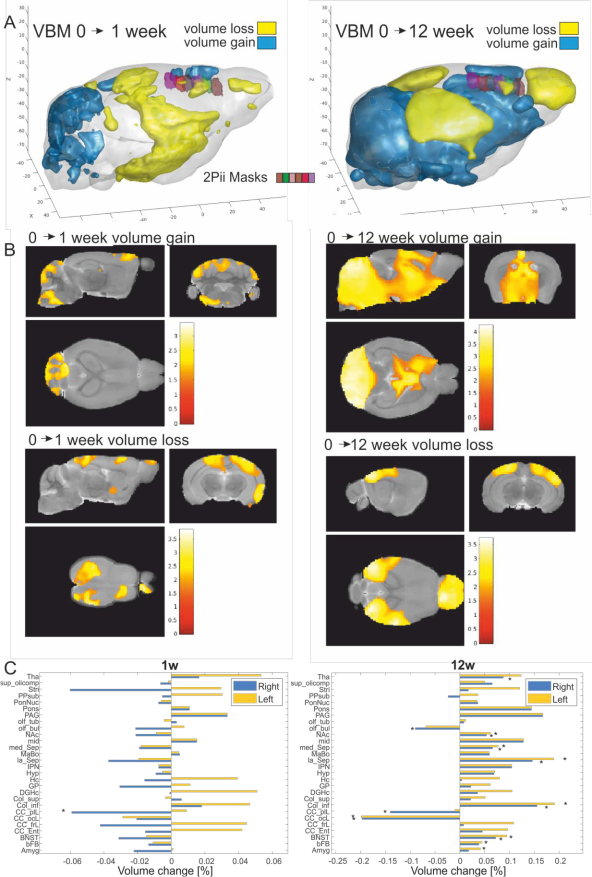
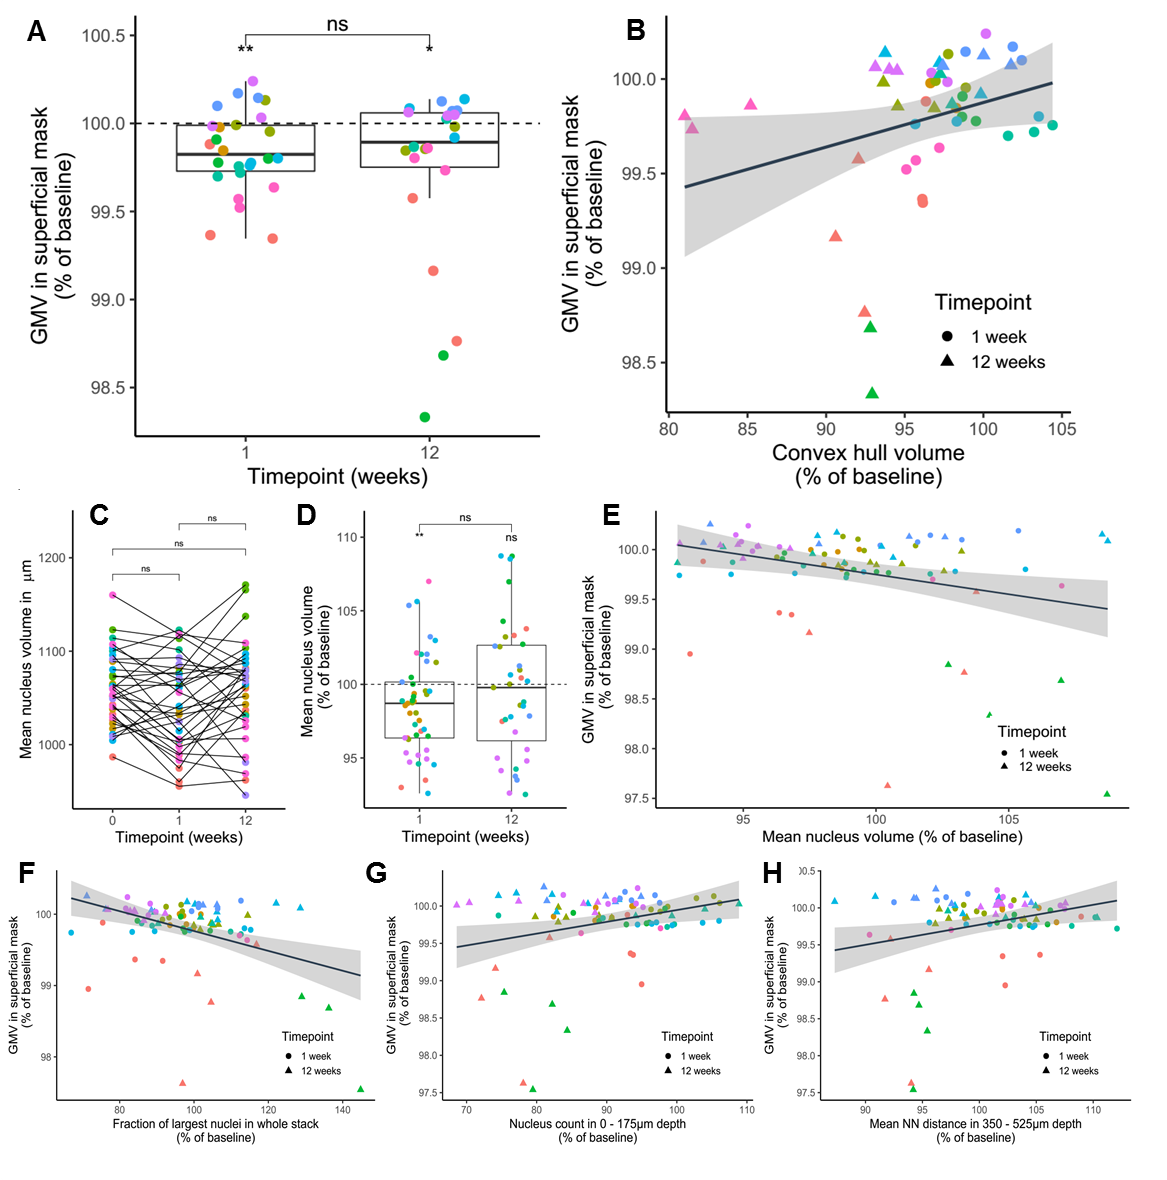
VBM (Fig. 3): Regions within the cerebellum and midbrain increased in GMV during the first week, while areas primarily lying in the frontal and parietal lobes showed GMV reduction. After 12 weeks, this pattern became more pronounced. These are within the range found in previous studies9. The imaging sites of 2Pii, were located on the right brain hemisphere and are superimposed in Fig. 3A.2PII-correlations: The convex hull volumes revealed a successive decrease in tissue volume from baseline to 1 and 12 weeks. At week 12, the volume decreased to 94% of baseline. In regions of interest corresponding to the 2Pii stack volumes, VBM showed a significantly decreased GMV relative to baseline at weeks 1 and 12. The individual changes in convex hull volumes were not correlated with VBM changes. By limiting the masks to the superficial cortex the convex hull volume changes correlated significantly with VBM (Fig. 5B).
Changes in nuclear volume exhibited a significant inverse correlation with the GMV (Fig. 5E). Thus, we subdivided all nuclei into four size categories and determined the fraction with which they contributed to the whole cell count. Correlating changes in these fractions with GMV, we found the fraction of largest nuclei (2250-3000µm³) best predicting GMV, explaining 16.2% of its variance and proving that a higher proportion of cells with large nuclei is associated with lower GMV (Fig. 5F). This finding could point towards the importance of cell type composition for the interpretation of VBM measurements. Together, the changes in convex hull volume, cell count at the surface, NN in deeper layers and the fraction of largest nuclei could explain 41.48% of the variance in GMV.
Discussion
This explorative study combined small animal MRI with alternating 2Pii to systematically correlate VBM measures with cellular metrics in vivo. The longitudinal design delivered intra-individual comparisons of age-dependent changes in GMV. We found a decrease in physical tissue volume contributing only little to GMV, whereas the average nucleus volume proved to correlate better. Restricting the correlations to layers of cellular imaging data revealed layer-specific correlation of nucleus count and NN distance. Nevertheless, these contributions do not fully explain changes observed in GMV. Overall, these results suggest that GMV changes are not solely dominated by changes in actual physical volume but that nuclear volume, local cell number and spatial cell clustering characteristics contribute.Acknowledgements
The data storage service SDS@hd, supported by the Ministry of Science, Research and the Arts Baden-Württemberg (MWK) and the German Research Foundation (DFG) through the grant INST 35/1314-1 We want to thankfully acknowledge the Michaela Kaiser, Claudia Kocksch and Felix Hoerner for their excellent FUGG, as well as the high performance cluster bwForCluster MLS&WISO, supported by the MWK and the DFG through grant INST 35/1134-1 FUGG, are gratefully acknowledged. We also acknowledge the support of the DFG within the SFB1158 grant project B08 (TK & WWF).References
1. Ashburner J & Friston KJ (2000) Voxel-based morphometry--the methods. NeuroImage 11(6 Pt 1):805-821.
2. Biedermann SV, et al. (2016) The hippocampus and exercise: histological correlates of MR-detected volume changes. Brain structure & function 221(3):1353-1363.
3. Keifer OP, Jr., et al. (2015) Voxel-based morphometry predicts shifts in dendritic spine density and morphology with auditory fear conditioning. Nature communications 6:7582.
4. Helmchen F & Denk W (2005) Deep tissue two-photon microscopy. Nat Methods 2(12):932-940.
5. Good CD, et al. (2001) A voxel-based morphometric study of ageing in 465 normal adult human brains. NeuroImage 14(1 Pt 1):21-36.
6. Hadjantonakis AK & Papaioannou VE (2004) Dynamic in vivo imaging and cell tracking using a histone fluorescent protein fusion in mice. BMC Biotechnol 4:33.
7. Ashburner J (2007) A fast diffeomorphic image registration algorithm. NeuroImage 38(1):95-113.
8. Schindelin J, et al. (2012) Fiji: an open-source platform for biological-image analysis. Nat Methods 9(7):676-682.
9. Bilbao A, et al. (2018) Longitudinal Structural and Functional Brain Network Alterations in a Mouse Model of Neuropathic Pain. Neuroscience.
Figures