1944
Early postoperative cerebral perfusion changes after direct revascularization surgery in moyamoya disease based on perfusion territory study1Beijing Tiantan Hospital, Capital Medical University, Beijing, China, 2GE Healthcare, China, Beijing, China
Synopsis
Early postoperative cerebral perfusion changes after direct revascularization surgery in moyamoya disease were studied. The preoperative and postoperative perfusion parameters from ASL and CT perfusion studied were compared based on perfusion territory showed by ssASL technique. Two types of perfusion changes were found, group I represented perfusion territory redistribution and group II represented perfusion improvement.
INTRODUCTION
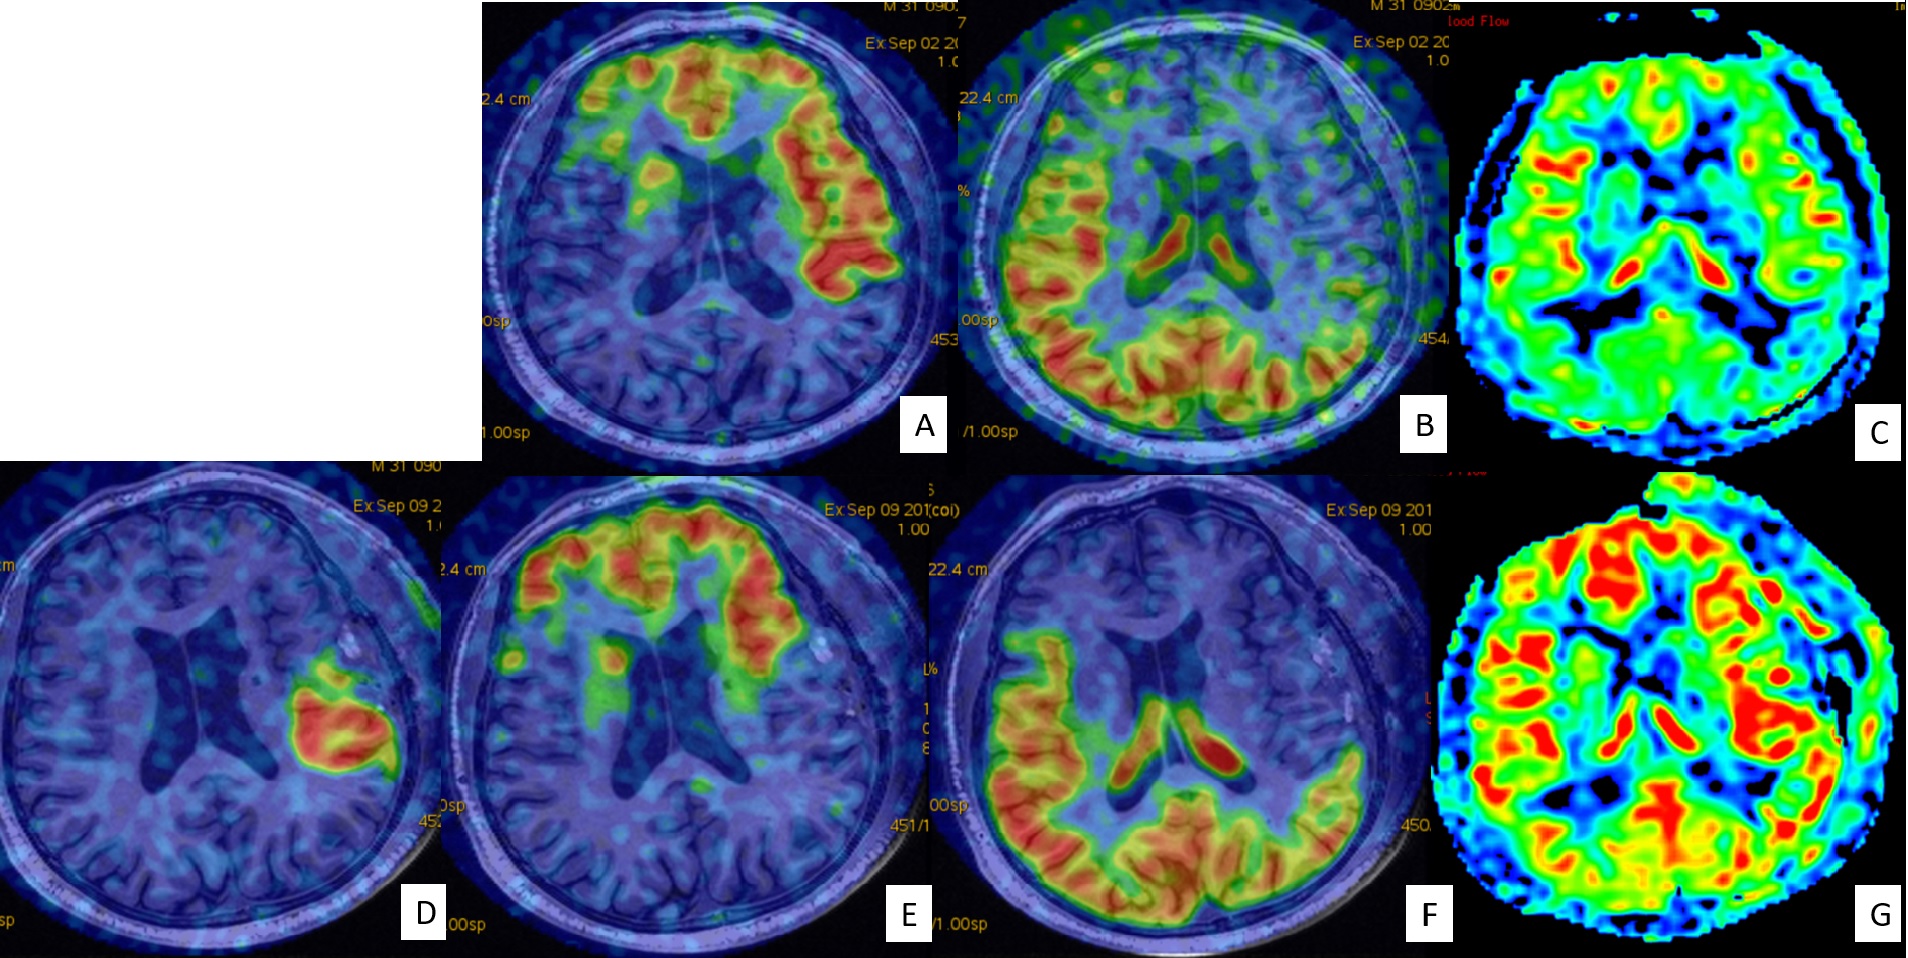
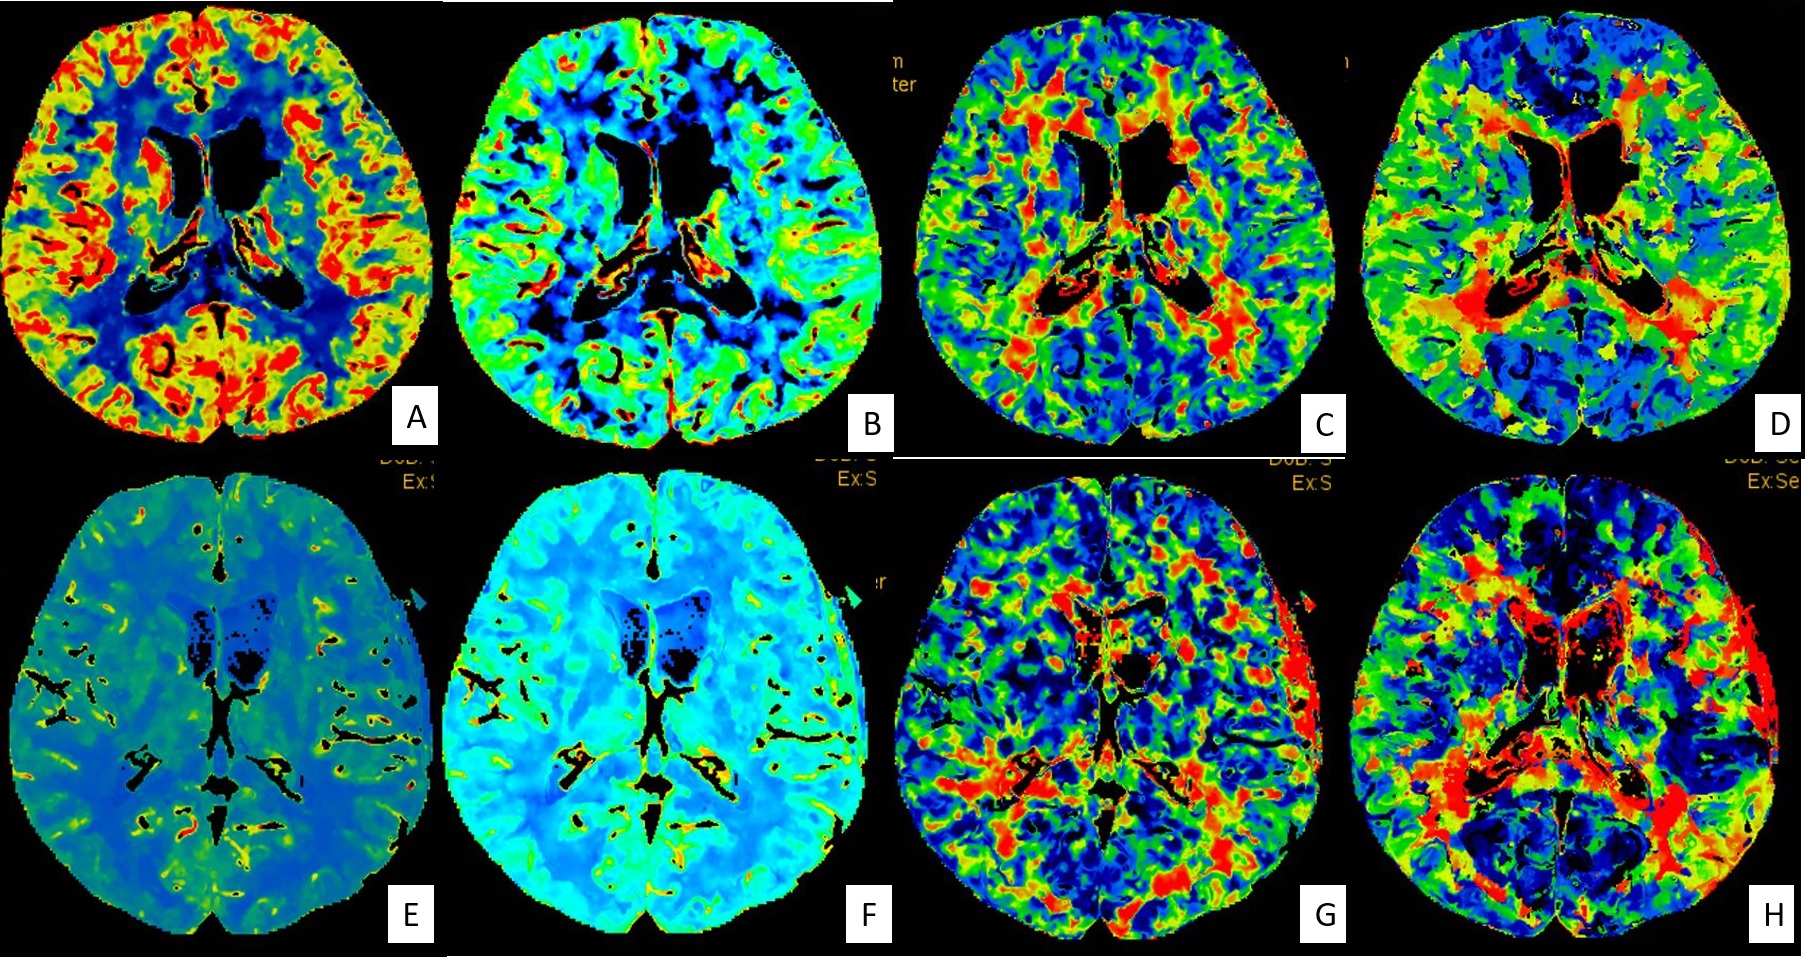
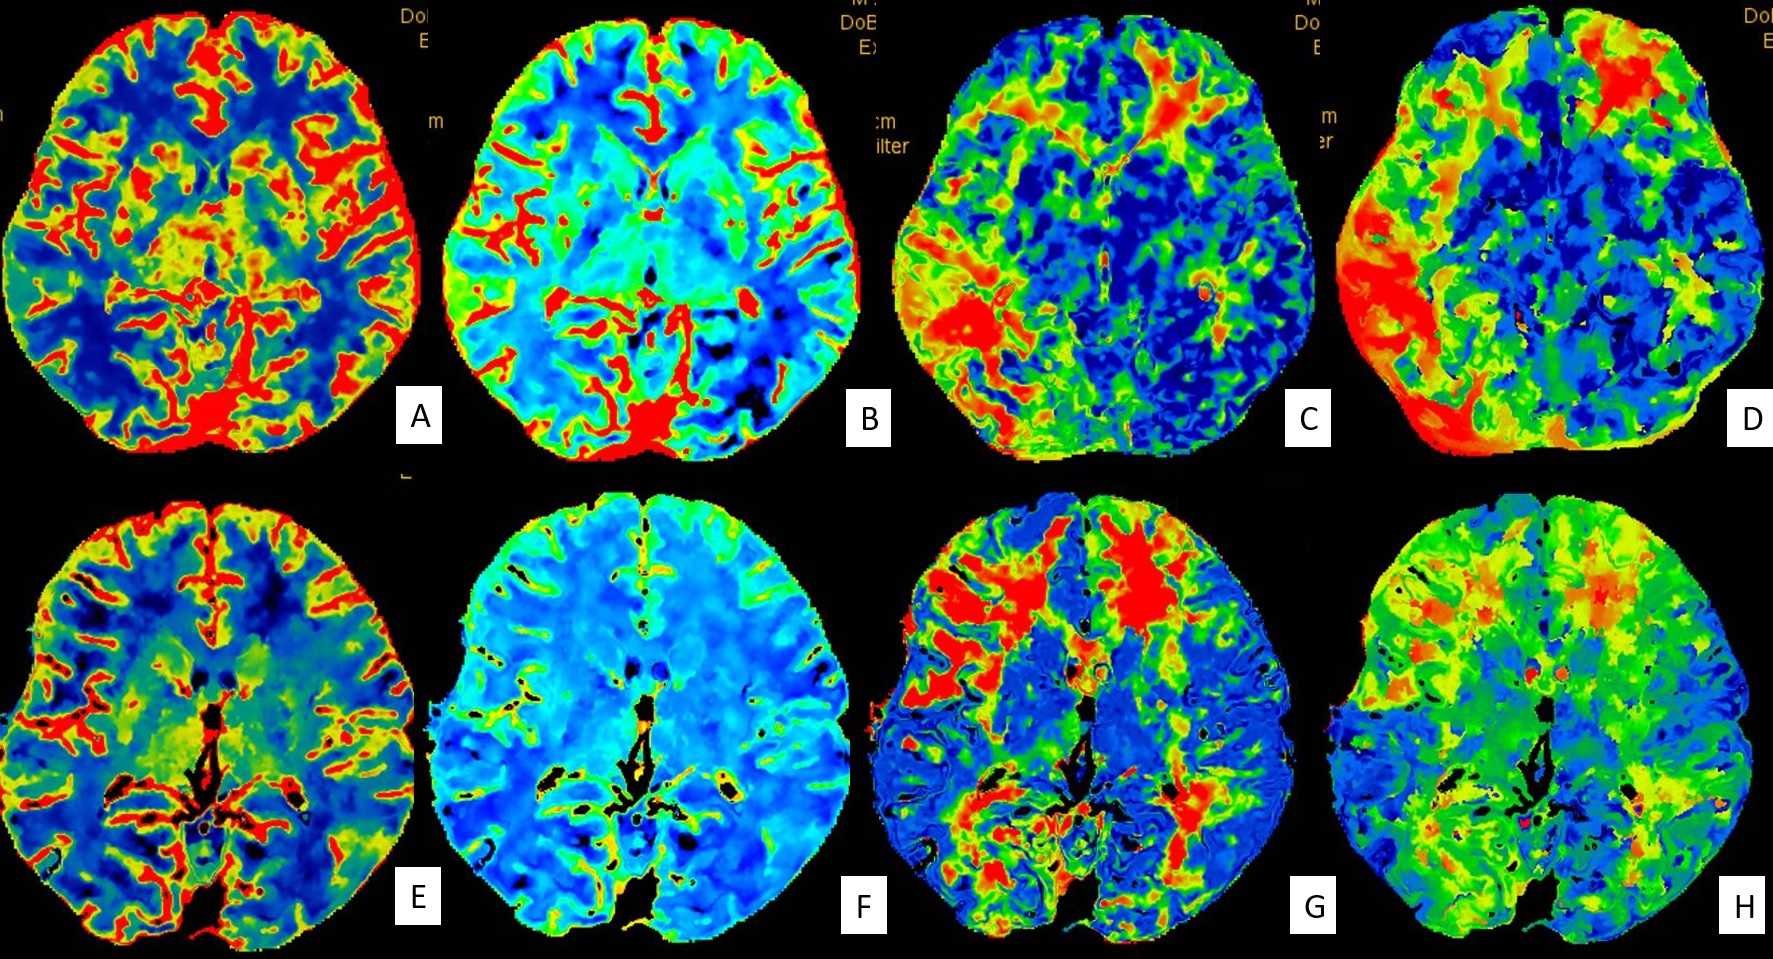
Revascularization surgery, including direct, indirect and combined revascularization, is the treatment of choice for moyamoya disease. Direct revascularization surgery is performed by connecting superficial temporal artery(STA) to middle cerebral artery(MCA). Its major advantage over indirect revascularization surgery is immediate change of cerebral perfusion after surgery[1]. Cerebral perfusion changes after direct revascularization have been studied by different imaging modalities including CT perfusion(CTP), MR perfusion(both dynamic susceptibility contract (DSC) and arterial spin labeling(ASL)), SPECT and PET[2]. However, all of the above studies were whole brain perfusion without taking perfusion territory into consideration. Super selective arterial spin labeling (ssASL) is a perfusion territory technique based on ASL. Our previous study showed that in early postoperative stage after direct revascularization surgery, there were revascularization area (RA) supplied by STA-MCA bypass, decreasing of perfusion territories of unilateral internal carotid artery(ICA) and/or basilar artery (BA) accordingly and sometimes decreasing of perfusion territories of preoperative collaterals from external carotid artery(ECA)[3]. In this work, we study cerebral perfusion changes identified by ASL and CTP after direct revascularization surgery in early postoperative stage based on the perfusion territory identified by ssASL.METHODS
Forty patients with Moyamoya disease treated via unilateral STA-to-MCA bypass were included. ssASL and ASL were performed preoperatively and within 1 week postoperatively on a 3.0T whole body system (GE Discovery 750) equipped with an 8 channel head coil. Perfusion territories of the STA -MCA bypass, bilateral ICA, bilateral ECA and BA were examined by the same scheme described by our previous study[3]. CTP was also examined preoperatively and postoperatively. CTP parameter maps were calculated in CT postprocessing workstation including cerebral blood flow(CBF), cerebral blood volume(CBV), mean transit time(MTT) and time to peak(TTP) . According to RA showed by postoperative ssASL, the RA negative patients were excluded. In RA positive patients, the CBF images of ssASL and ASL and the CTP parameter maps were normalized into the MNI (Montreal Neurological Institute) space by using the ASL-PDw and 3D T1w images. The mean CBF of ASL and CTP parameters were extracted within the perfusion territory defined by ssASL. Changes of the above perfusion parameters between the pre- and postoperative stages were compared by Wilcoxon signed rank test.RESULTS
Twenty three patients showed RA positive in the early postoperative stage were included in this study. According to the postoperative perfusion territory changes, the patients were divided to two groups. Group I showed RA mainly located in the preoperative unilateral ICA and/or BA perfusion territories, and accordingly perfusion territories of the unilateral ICA and/or BA decreased postoperatively. Group II showed RA mainly located in the preoperative ischemic area, that is, RA was not covered by the preoperative unilateral ICA and/or BA perfusion territories. There were 9 patients in group I and 14 patients in group II. In CTP parameters, there were significant decreases of MTT and TTP postoperatively in both group I and group II(all P<0.01).. There were no significant changes of CBF and CBV postoperatively in group I(P=0.21,0.39 respectively, both P>0.05).There were significant increase in CBV postoperatively in group II(P<0.05), and there were no significant changes in CBF postoperatively in group II(P=0.12,>0.05). Significant increase of ASL-CBF were found postoperatively in both group I and group II(both P<0.01).DISCUSSION
Our study indicated there were two types of cerebral perfusion changes after direct revascularization surgery. Group I showed the presence of RA and the decreasing of the perfusion territories of the unilateral ICA and/or BA, with shortening of MTT and TTP and no significant change of CBF and CBV. Group II showed the presence of RA located in preoperative ischemic area, with shortening of MTT and TTP, significant improvement of CBV. After direct revascularization surgery, the RA was supplied by STA-MCA bypass instead of the preoperative compensatory collaterals, thus, the arterial transit time (ATT) is significantly shortened postoperatively in both groups. The difference between group I and group II was as follows. In Group I, the perfusion territories redistributed after surgery without significant improvement of Cerebral perfusion. In group II, there were real cerebral perfusion improvement in addition to perfusion territories redistribution. Our study also indicated there were different results between CTP-CBF and ASL-CBF. It is intrinsic property of ASL that the quantification of CBF will be affected by ATT. After direct revascularization surgery, the error of the CBF calculated from ASL was mainly originated from the significant shortening of ATT.CONCLUSION
There are two types of cerebral perfusion change after direct revascularization surgery in early postoperative stage, group I mainly represents perfusion territory redistribution and group II mainly represents perfusion improvement.Acknowledgements
No acknowledgement found.References
1. Acker, G., L. Fekonja, and P. Vajkoczy, Surgical Management of Moyamoya Disease. Stroke, 2018. 2. Lee, S., et al., Monitoring Cerebral Perfusion Changes after Revascularization in Patients with Moyamoya Disease by Using Arterial Spin-labeling MR Imaging. Radiology, 2018: p. 170509.
3. Yuan, J., et al., Cerebral Perfusion Territory Changes After Direct Revascularization Surgery in Moyamoya Disease: A Territory Arterial Spin Labeling Study. World Neurosurg, 2019. 122: p. e1128-e1136.
Figures