1943
Cerebral metabolic rate at three hours post injury predicts 24-hour neurological outcome in a rat model of cardiac arrest1Russell H. Morgan Department of Radiology and Radiological Science, Johns Hopkins University School of Medicine, Baltimore, MD, United States, 2F.M. Kirby Research Center for Functional Brain Imaging, Kennedy Krieger Research Institute, Baltimore, MD, United States, 3Department of Biomedical Engineering, Johns Hopkins University School of Medicine, Baltimore, MD, United States, 4Department of Neurology, Johns Hopkins University School of Medicine, Baltimore, MD, United States
Synopsis
Cardiac arrest (CA) is associated with low survival rate and unfavorable outcomes despite maximal medical care. For determining the timing of acute brain injury and delivering aggressive intervention at early stage to improve neurologic outcomes, an early-stage biomarker is compulsory. Here, we utilized MRI techniques to reveal the temporal trajectories of brain’s blood supply, oxygenation, and energy consumption in the first few hours following return-of-spontaneous-circulation, and found early physiologic measure is associated with 24-h neurologic deficit score. This finding may potentially facilitate the future research on CA management by providing a sensitive physiologic biomarker to determine appropriate medical intervention.
Introduction
Cardiac arrest (CA) carries low survival rate (~10%) and unfavorable outcomes,1 and is thought to be primarily attributed to brain injury that occurs from a sudden loss of blood supply to the brain. Cardiopulmonary resuscitation (CPR) has been shown to be effective in some but not all CA patients in terms of survival rate and improved neurologic outcomes. However, temporal trajectories of the brain’s blood supply, oxygenation, and energy consumption in the first few hours following CA have not been fully characterized. Furthermore, the extent to which these early measures can predict future neurological outcomes has not been determined. Therefore, the present study sought to use physiological MRI techniques to perform dynamic observations of cerebral blood flow (CBF), oxygen extraction fraction (OEF), and cerebral metabolic rate of oxygen (CMRO2) in the first 3 hours following CA and return of spontaneous circulation (ROSC), and to examine their utility in predicting neurological outcomes at 24 hours.Methods
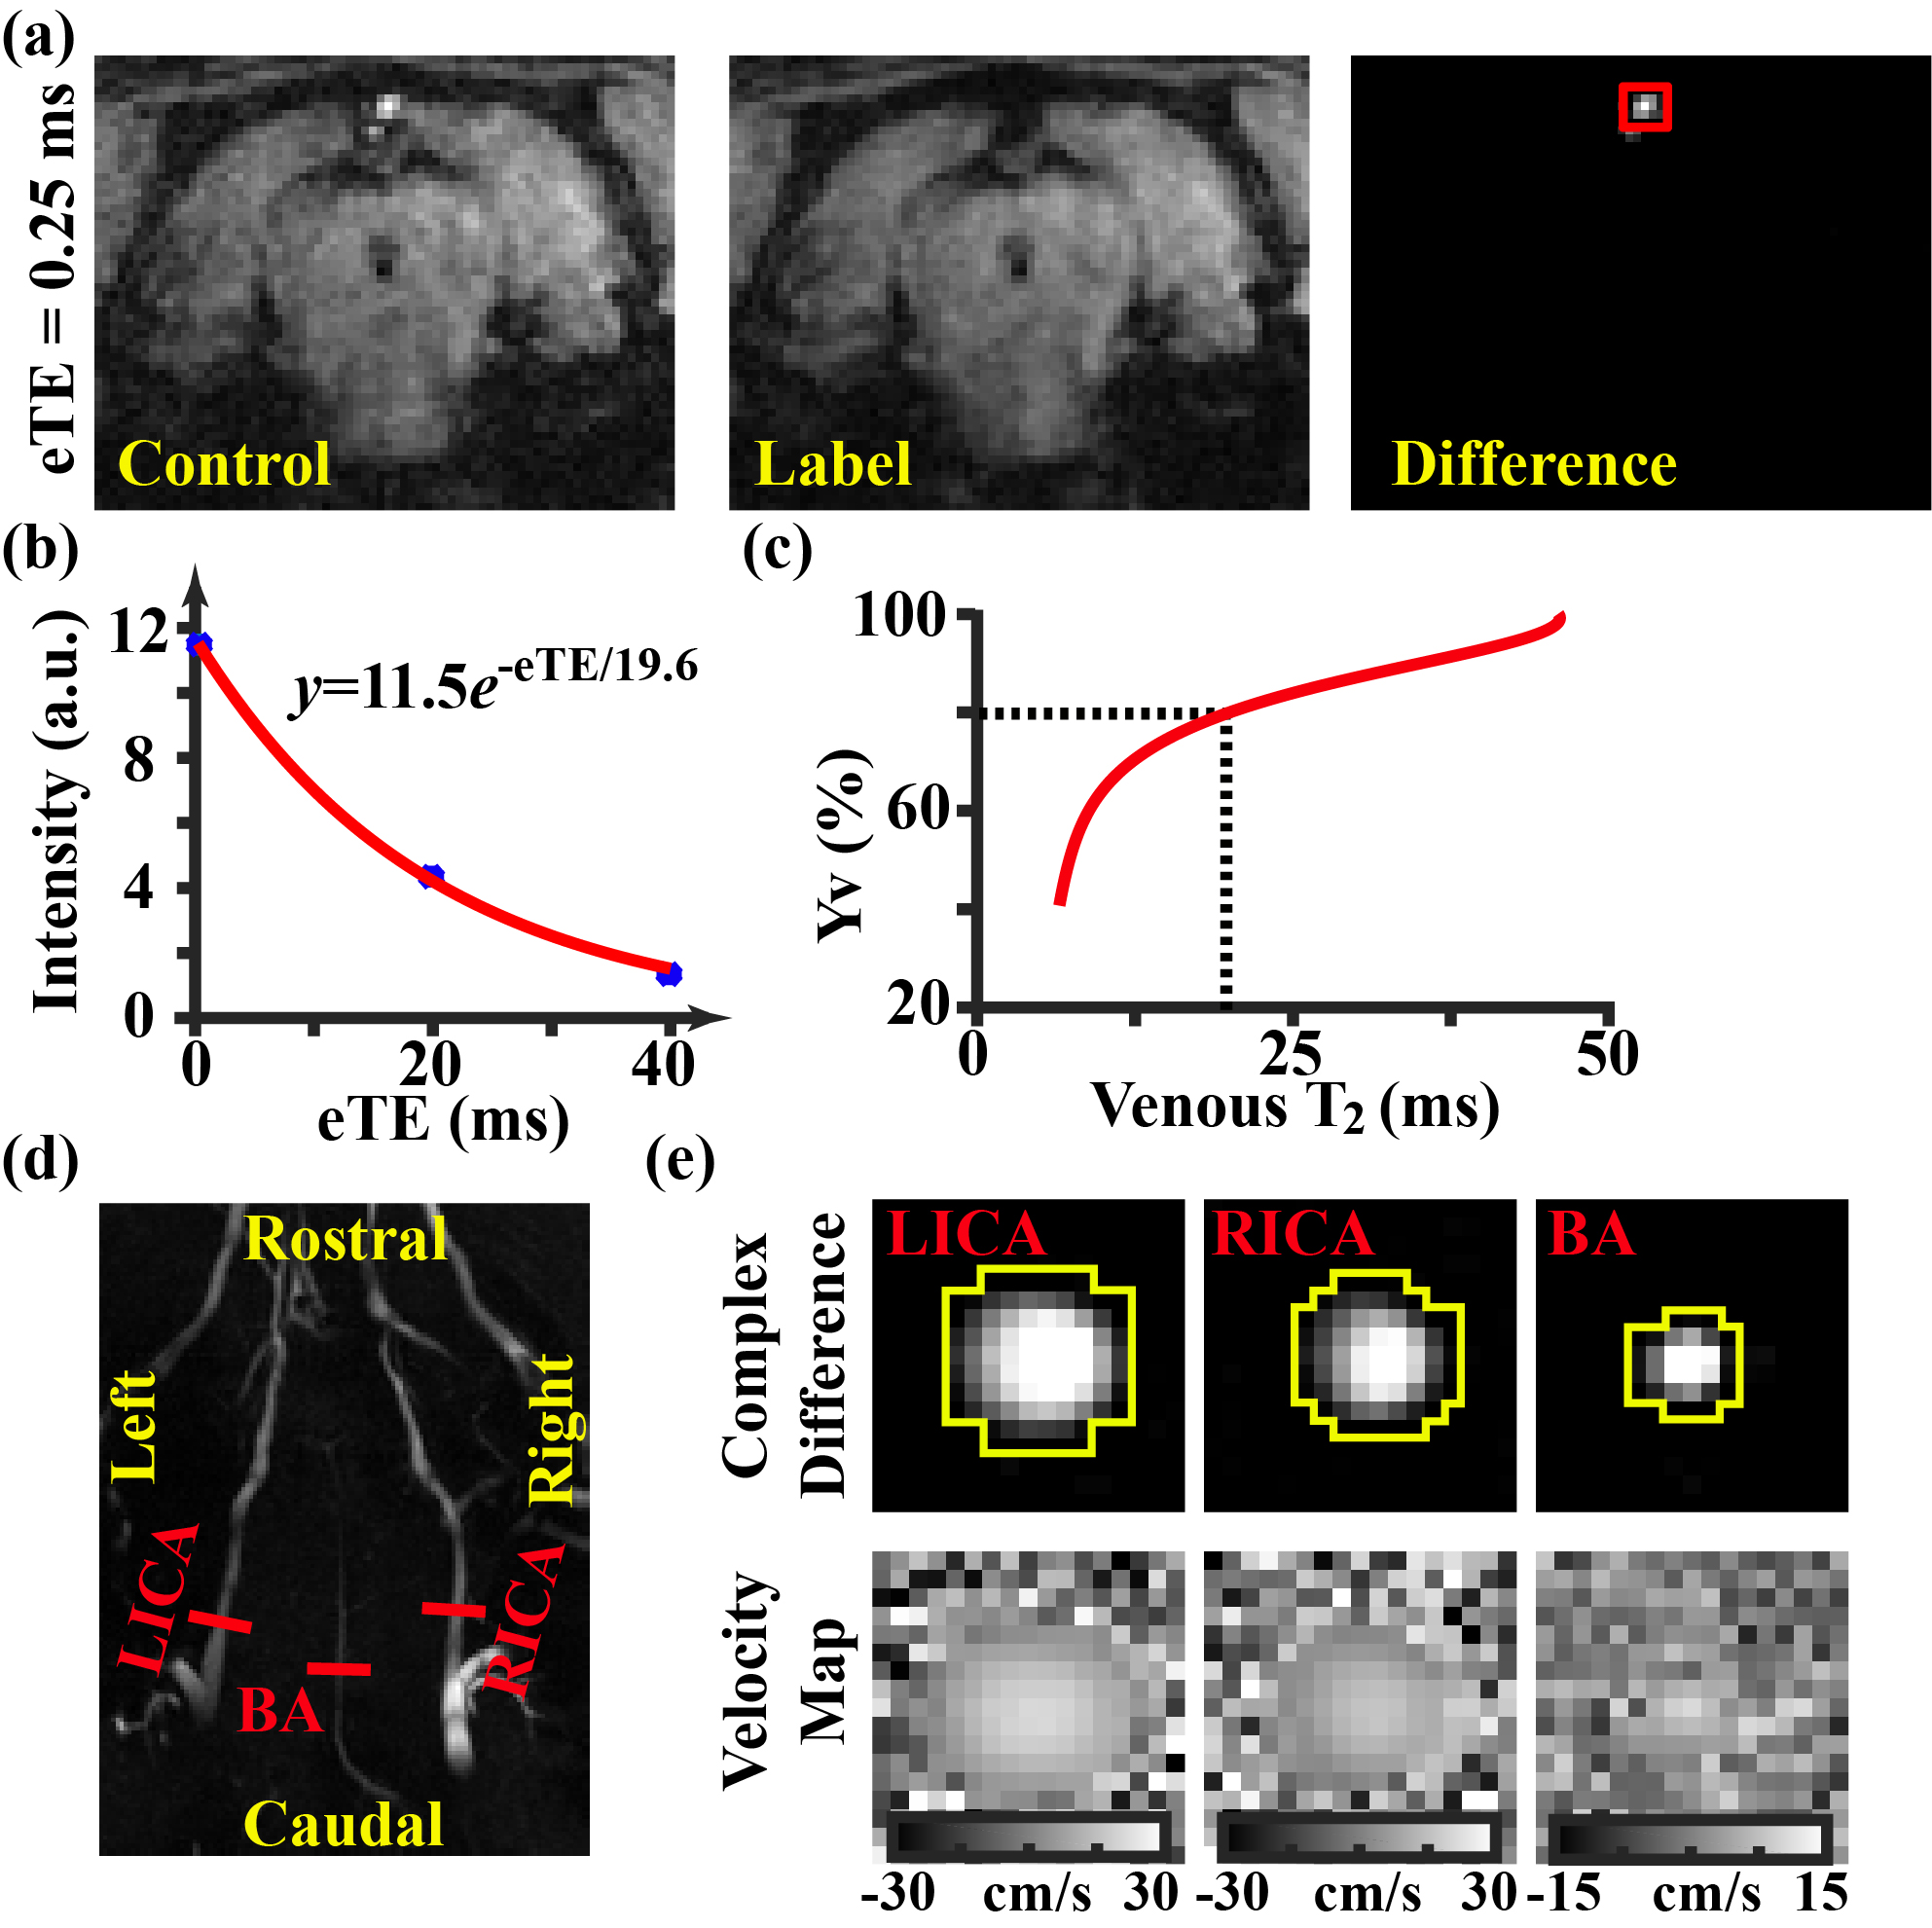
All experiments were approved by local IACUC. Ten Wistar rats (11~12 weeks) were studied. CA was induced with global asphyxia (ventilator disconnection and tracheal-tube clamping for 7-min after muscle paralysis). CPR was performed with sternal chest compressions (200/min) together with ventilator and i.v. epinephrine until the ROSC (MAP>50 mmHg and spontaneous pulse waveform).2 Mean arterial pressure (MAP) was monitored with an intra-arterial line. After occurrence of spontaneous breathing, the animal was extubated and transported for MRI imaging (11.7T Bruker system) without anesthesia because rats were still in narcosis state during the first few hours after CPR.The MRI procedure is illustrated in Figure 1. The animal was scanned continuously up to 200 min post-ROSC, with repeated acquisitions of OEF and CBF sequences. OEF is defined as the arteriovenous oxygenation difference, i.e., OEF=Ya-Yv. Ya is generally close to unity (assumed to be 0.99). Yv was assessed non-invasively by a T2-relaxation-under-spin-tagging (TRUST) technique3 (Figures 1a-1c). Blood flows were evaluated with phase-contrast (PC) MRI covering the major feeding arteries,4 which were combined with brain volume information to yield CBF (in ml/100g/min) (Figures 1d&1e). CMRO2 was computed from OEF and CBF using the Fick principle, i.e., CMRO2=OEF·CBF·Ca, where Ca denotes the oxygen carrying capacity of the blood5.
A composite neurologic deficit score (NDS), including consciousness, arousal, motor, sensory, coordination, respiration, and seizures, was determined 24 hours after ROSC as a quantitative index of outcome.6
In additional experiments, we determined OEF, CBF, and CMRO2 in wild-type, non-CA rats under isoflurane anesthesia (N=2), to provide reference values of these parameters.
Temporal characteristics of the parameters were determined with a linear mixed-effect model (significance level p<0.05). Spearman’s rank correlation was used to examine the predictive value of MRI parameters (within the first 3-hours after CA) on 24-hour NDS.
Results and discussion
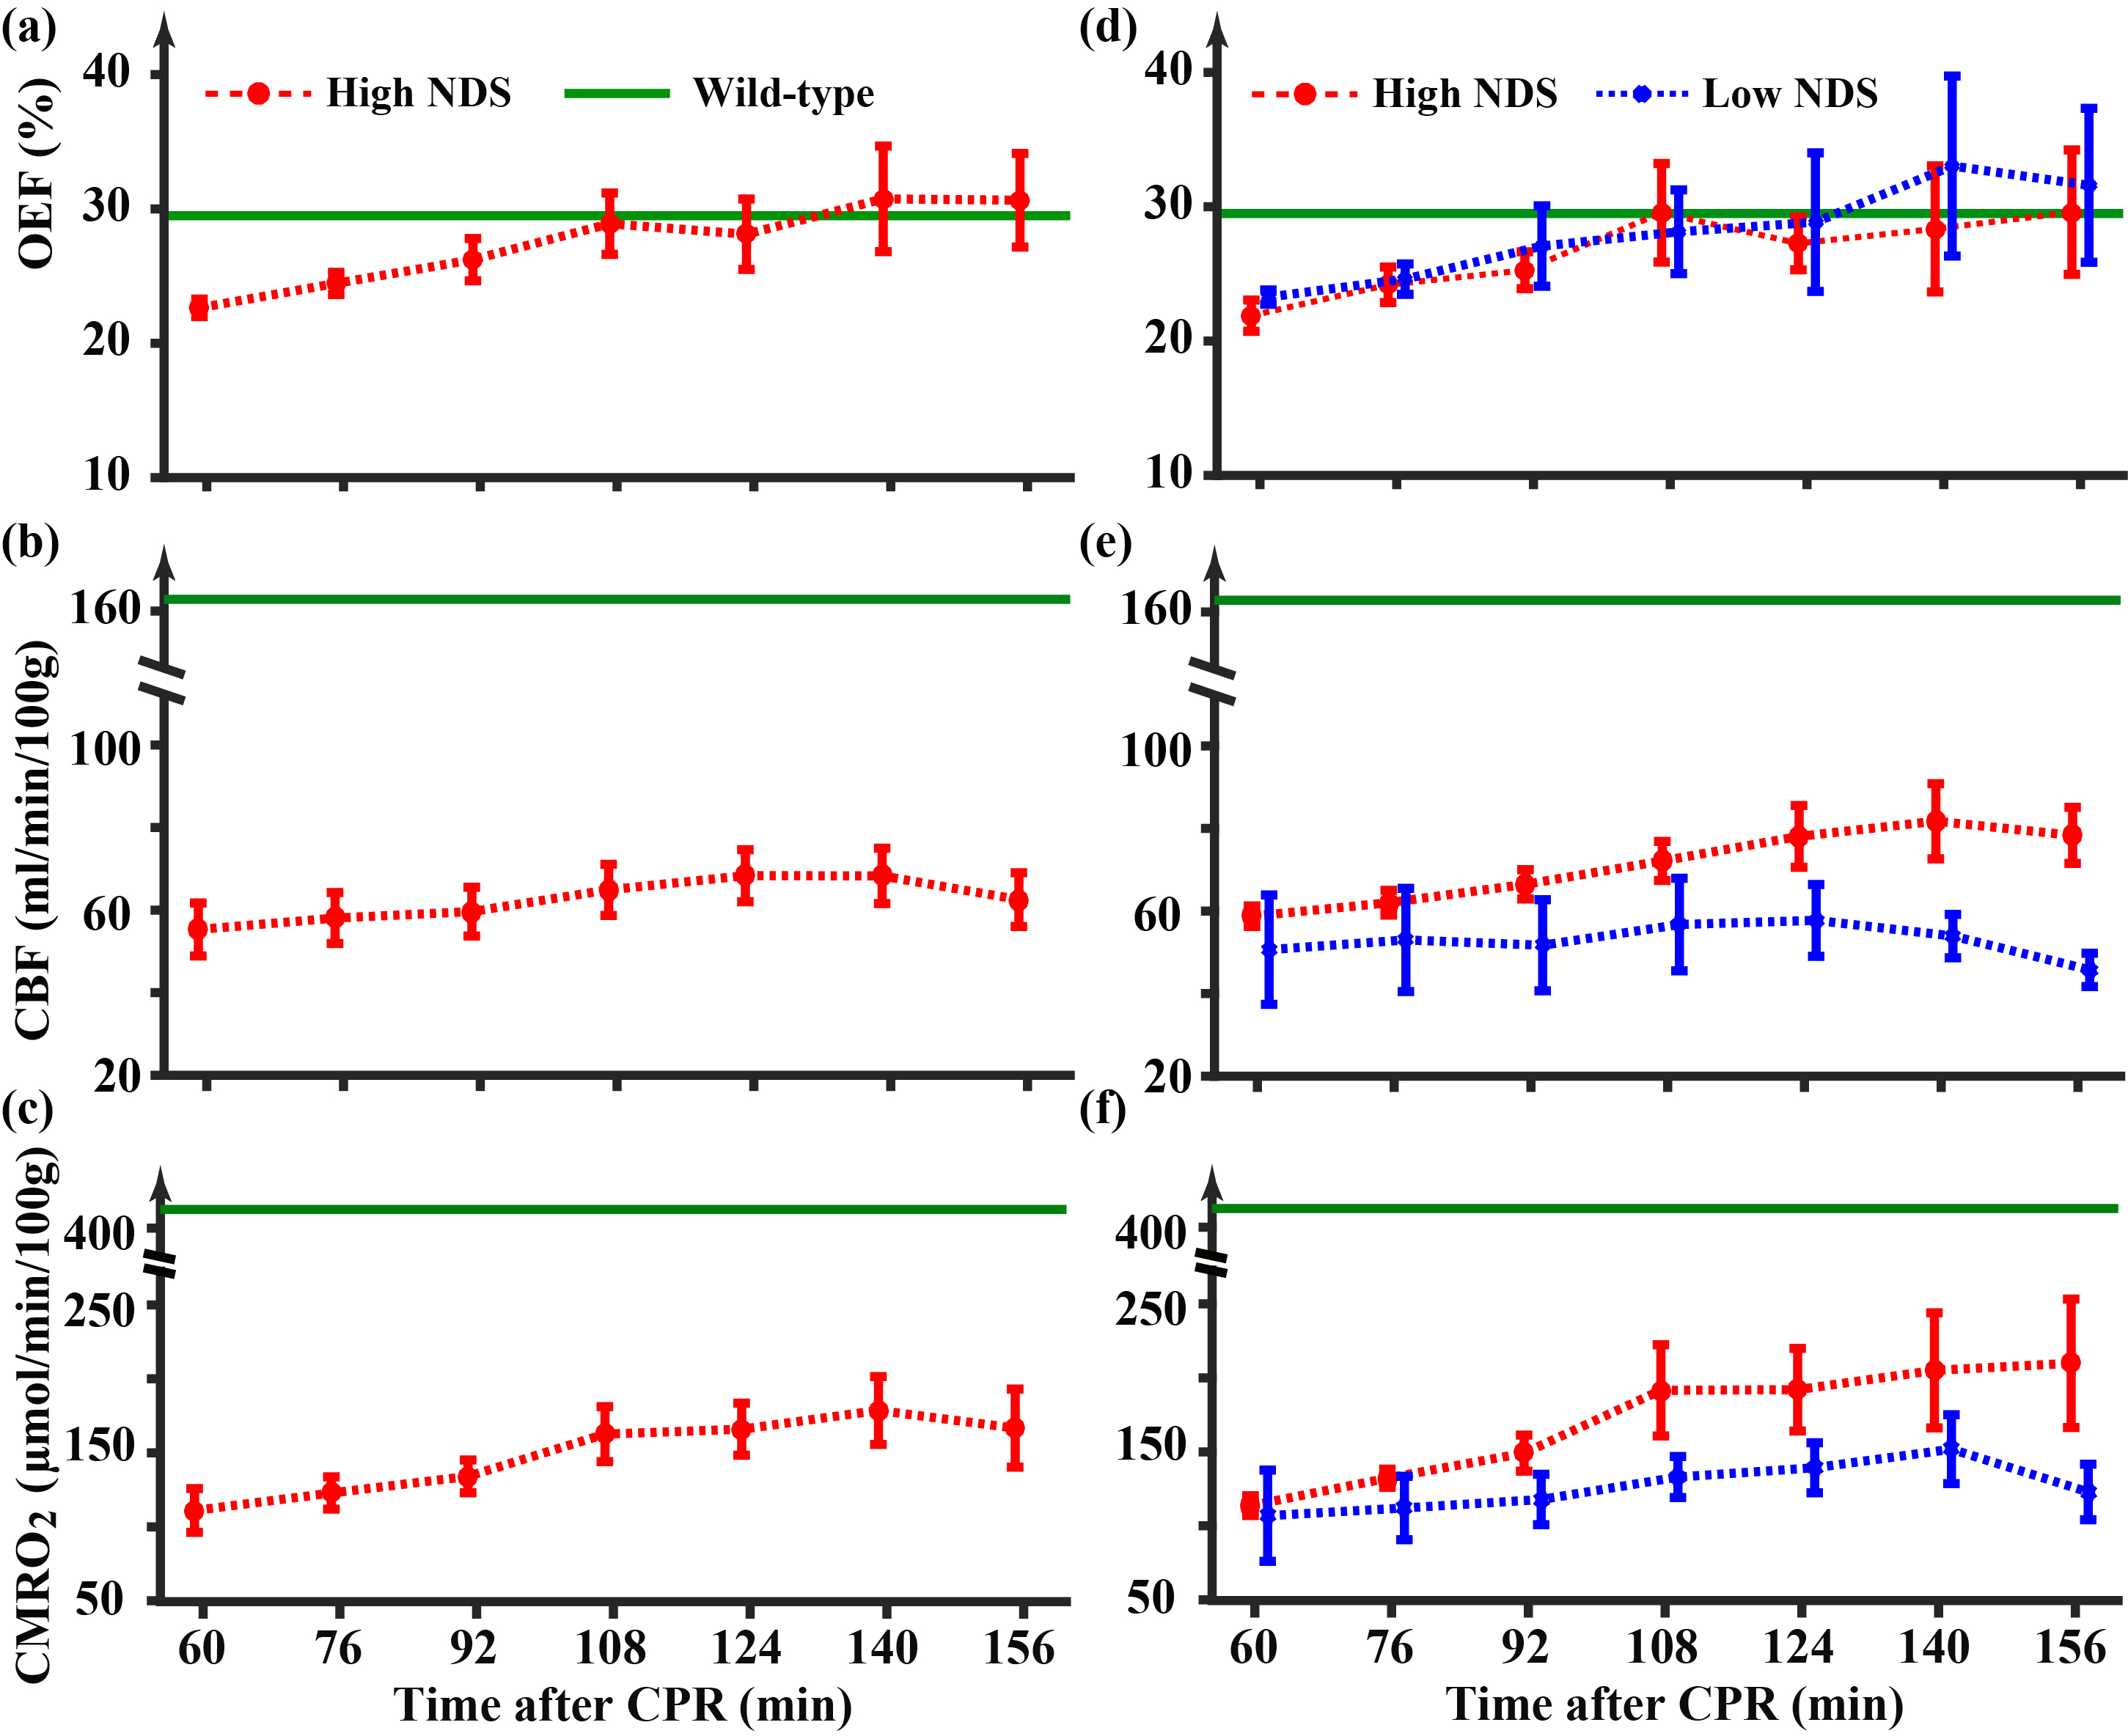
Figures 1a-c show representative TRUST MRI data. Figures 1d-e show the corresponding PC MRI data.Temporal trajectory of physiological parameters following CA: Figures 2a-c shows time courses of OEF, CBF, and CMRO2 after ROSC. All three parameters showed an increase (p≤0.006) in the first few hours after CA, suggesting a recovery of the brain’s hemodynamic and metabolic function. Green lines show the reference values from non-CA rats. It can be seen that, despite recovery, CBF and CMRO2 values in CA rats are still lower than normal values. Next, we split the rats into two sub-groups based on their 24-hours neurologic outcomes, a high NDS (Range:69~78, Mean±SD:74±4, N=5) and a low NDS (Range:0~64, Mean±SD:37±34, N=5) groups, and the results are shown in Figures 2d-f. It can be seen that, while the OEF time course showed no difference between groups, there was a clear disparity in terms of their CBF and CMRO2 time courses. This was confirmed by a significant Time×Group interaction effects in CBF (p=0.0007) and CMRO2 (p=0.0008), but not in OEF (p=0.54), suggesting that more rapid and sustained recovery in flow and metabolism are associated with better outcome.
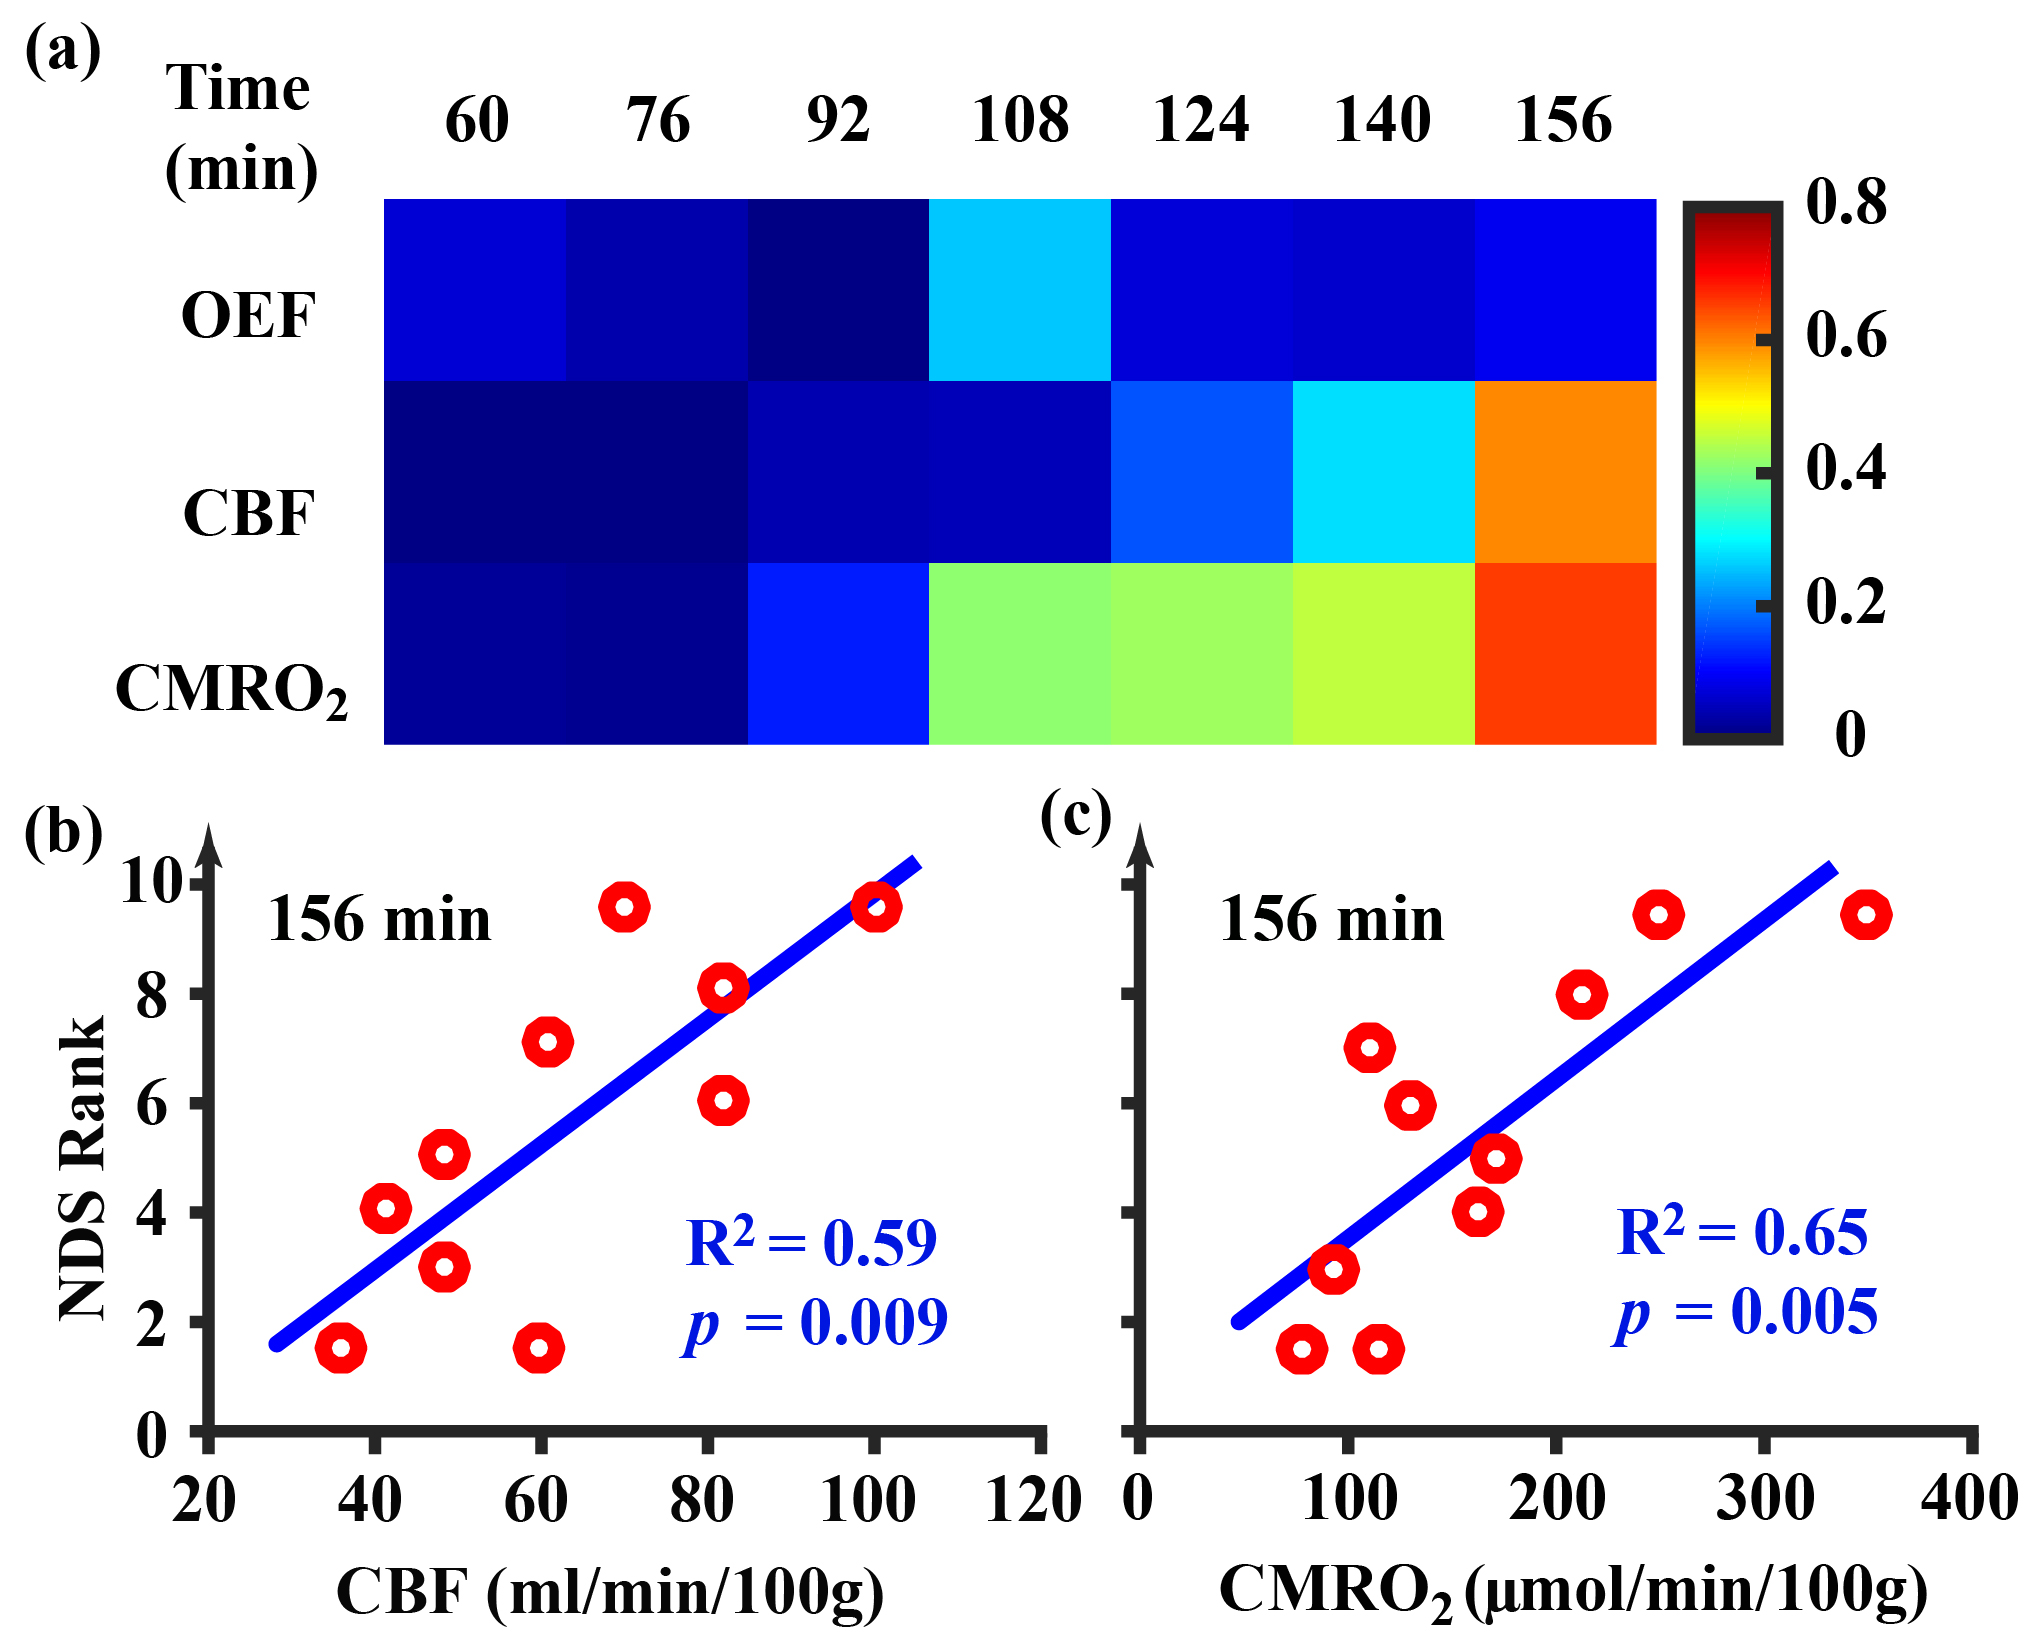
Utility of physiological MRI in predicting 24-hour NDS: Next, we studied the correlation between snapshot physiological parameters and the 24-hour NDS scores. Figure 3a shows correlation values for each parameter at each time point. By contrast to OEF, CBF and CMRO2 showed stronger correlations with NDS score, especially for later time points. Figures 3b and c show the scatter plots between NDS and CBF (R2=0.59, p=0.009) and CMRO2 (R2=0.65, p=0.005), respectively, at the last time point of 156 min after ROSC. It can be seen that blood flow and metabolism measured at 2-3 hours after injury has a significant predictive value for 24-hour neurologic outcomes.
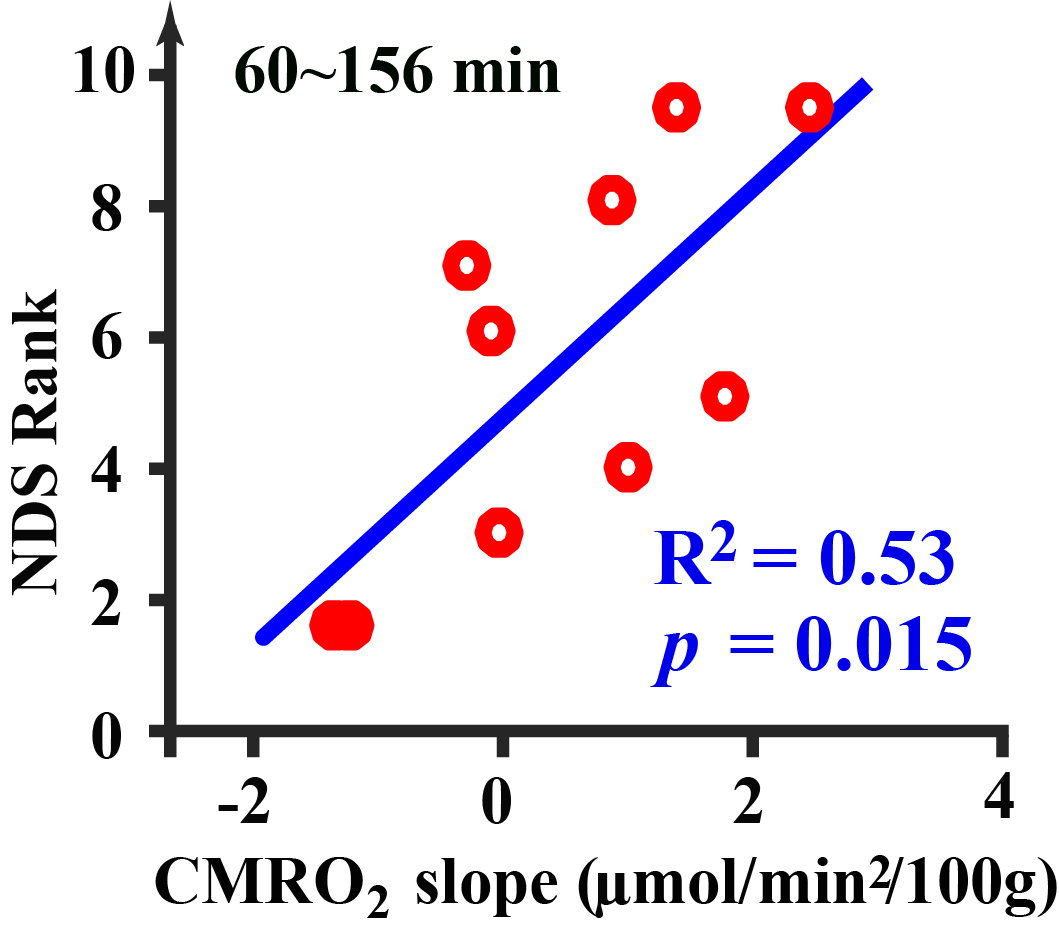
We further investigated the rate-of-change of physiological parameters in predicting NDS. It was found that the rate-of-change in CMRO2 was correlated with NDS (Figure 4) (R2=0.53, p=0.015), where that of OEF (p=0.48) and CBF (p=0.17) was not significant.
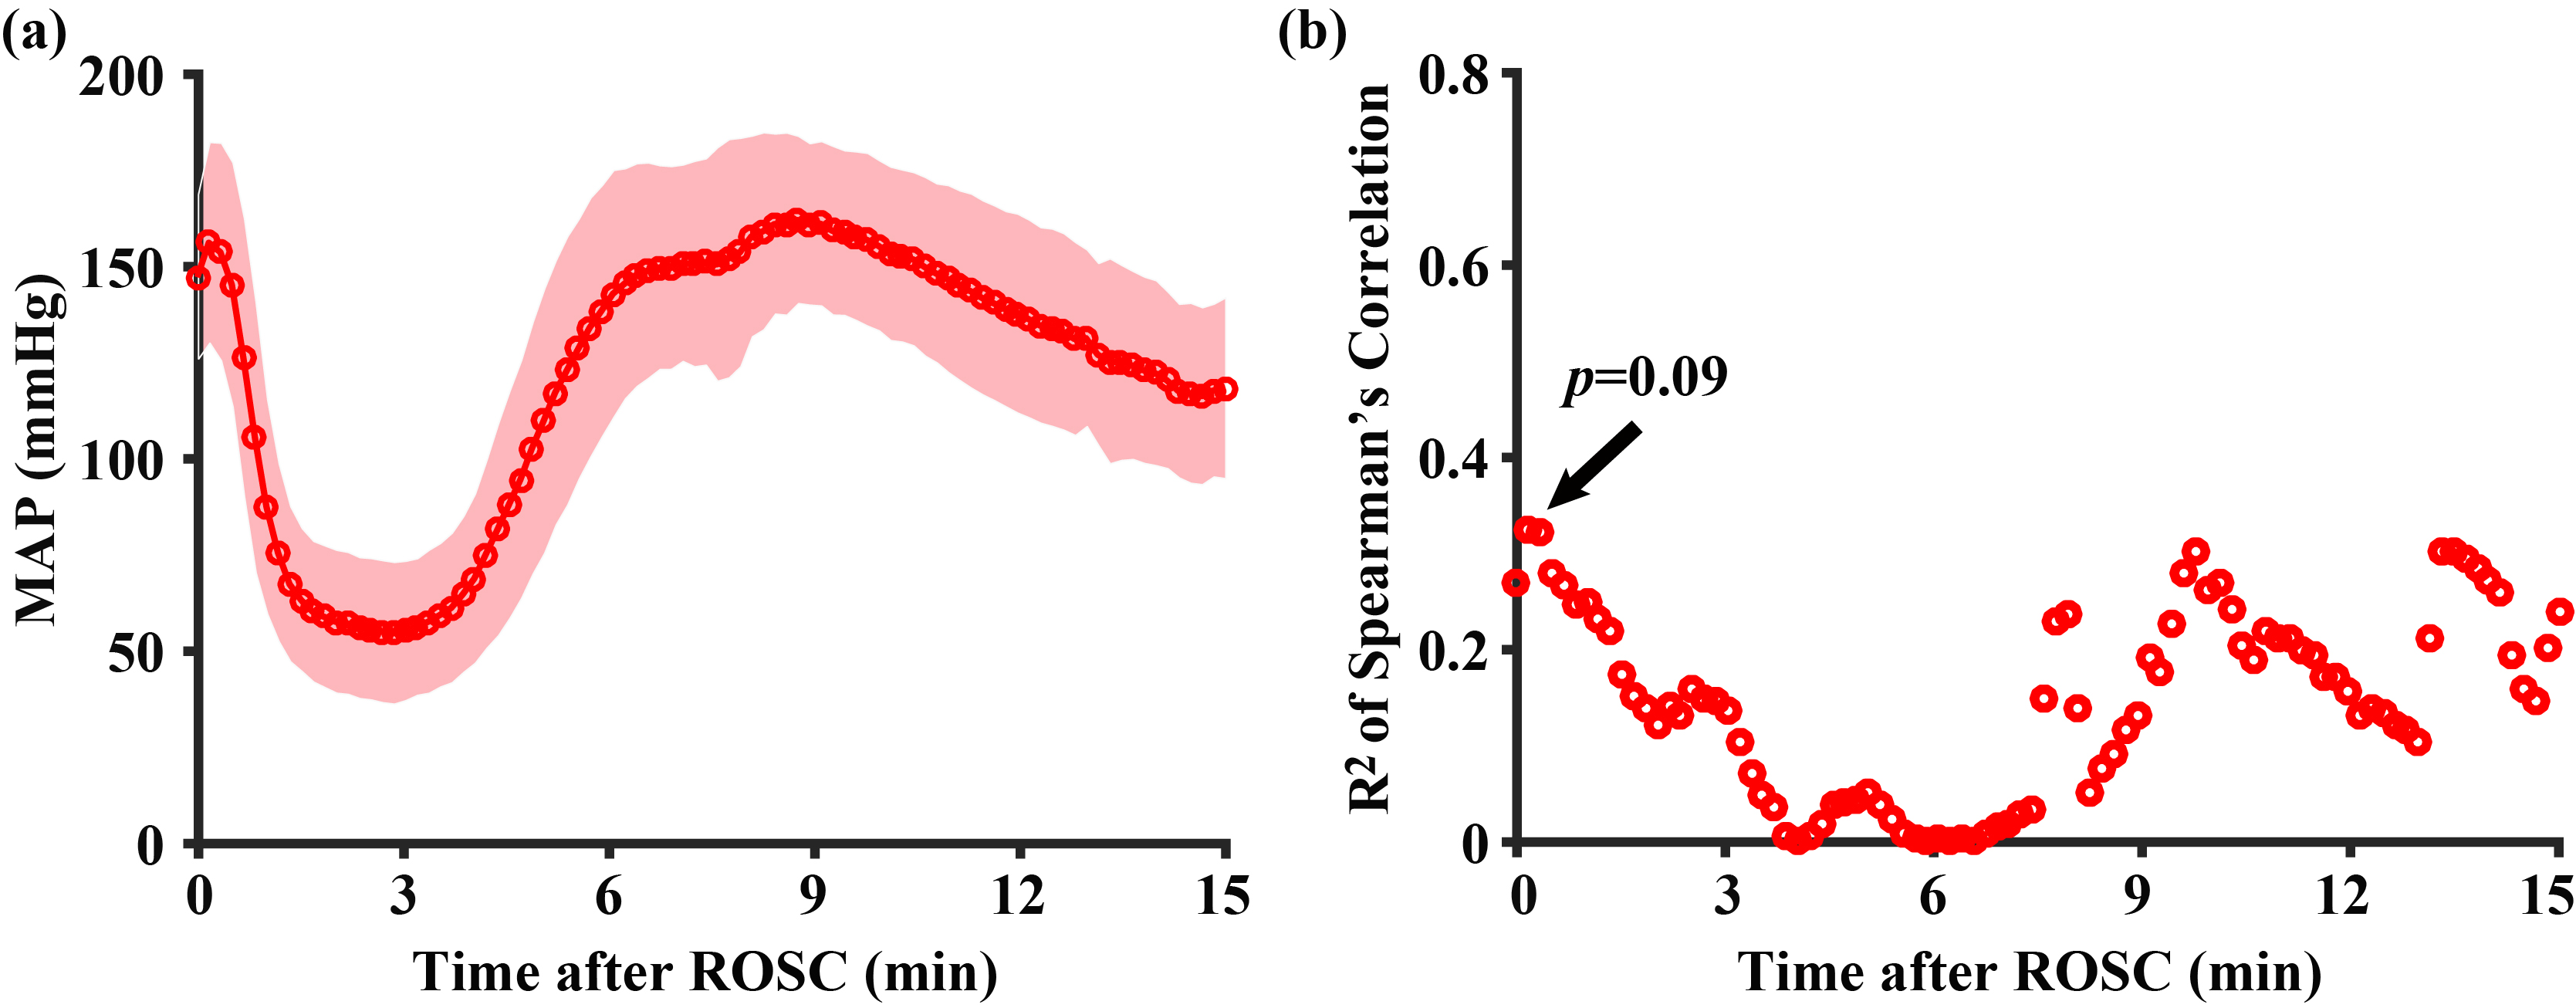
MAP: Time course of MAP (Figure 5a) was recorded in the first 15 minutes after ROSC, before the MRI session. The temporal pattern of the MAP change is consistent with prior literature.7 There was not a correlation between NDS and MAP for any of the time points (Figure 5b).
Conclusions
Brain blood flow and metabolism reveal an early increase following CA and the extent of the recovery can predict 24-hour neurological outcomes.Acknowledgements
No acknowledgement found.References
1. Benjamin EJ, Muntner P, Alonso A et al. Heart disease and stroke statistics-2019 update: A report from the American Heart Association. Circulation 2019; 139(10): e56-e528.
2. Wang Q, Miao P, Modi HR et al. Therapeutic hypothermia promotes cerebral blood flow recovery and brain homeostasis after resuscitation from cardiac arrest in a rat model. J Cereb Blood Flow Metab 2019; 39(10): 1961-1973.
3. Wei Z, Xu J, Liu P et al. Quantitative assessment of cerebral venous blood T2 in mouse at 11.7T: Implementation, optimization, and age effect. Magn Reson Med 2018; 80(2): 521-528.
4. Wei Z, Chen L, Lin Z et al. Optimization of phase-contrast MRI for the estimation of global cerebral blood flow of mice at 11.7T. Magn Reson Med 2019; 81(4): 2566-2575.
5. Chong SP, Merkle CW, Leahy C et al. Cerebral metabolic rate of oxygen (CMRO2) assessed by combined Doppler and spectroscopic OCT. Biomed Opt Express 2015; 6(10): 3941-3951.
6. Geocadin RG, Sherman DL, Hansen HC et al. Neurological recovery by EEG bursting after resuscitation fromcardiac arrest in rats. Resuscitation 2002; 55: 193-200.
7. Liachenko S, Tang P, Hamilton RL et al. Regional dependence of cerebral reperfusion after circulatory arrest in rats. J Cereb Blood Flow Metab 2001; 21: 1320-1329.
Figures