1940
High Resolution Volumetric and Connectomic Analyses in a Mouse Model of CNS Lupus1Radiology, Duke University Medical Center, Durham, NC, United States, 2Neurology, Duke University Medical Center, Durham, NC, United States
Synopsis
Ex-Vivo high resolution (3D) volumetric, tractographic and connectomic analysis carried out on a mouse model of CNS Lupus at 7T. The results show strong therapeutic effect of a novel QR II inhibitor.
Introduction
Systemic lupus erythematosus (SLE) is an autoimmune disease involving multiple organ systems including brain1. Cognitive and neuropsychiatric dysfunctions are especially common and often precede the onset of peripheral organ pathology2. The mechanisms underlying brain pathology are multifactorial and poorly understood, and current therapeutic interventions have limited efficacy. The MRL/lpr mouse SLE model recapitulates several aspects of immune dysregulation, organ pathology, and CNS dysfunction in human disease3. We performed high-resolution microstructural ex-vivo MRI, including tractography and connectome analyses, on MRL/lpr mouse brains with and without therapeutic intervention to explore mechanisms underlying SLE brain dysfunction and response to therapy. Significant regional changes in volume, DTI parameters, and connectivity were observed between treated and untreated animals.Materials and Methods:
MRL/lpr mice at 8 weeks were treated with a novel quinone reductase II inhibitor (QR2I-44) designed as an optimized iterative of the current SLE first-line therapy, plaquenil. [N=9 mice (Vehicle= 4, Treated = 5)]. Treatment mice were administered oral doses of QR2I-44 daily for 4 consecutive weeks before sacrifice. Therapeutic response was observed at 10mg/kg. Mice were perfused and brains excised and stored in 0.5% ProHance-doped formalin4. Image Acquisition: Brains were placed in Fomblin and scanned on a Bruker 7T system with quadrature volume-transmit and surface-receive coils. The MRI protocol comprised: (1) 3D T1-weighted FLASH sequence with FOV = 1.8 x 1.8 x 1.8 cm; matrix = 256 x 256 x 256; resolution = 70 x 70 x 70 μm/pixel; TE/TR = 6/30 ms; averages = 16; flip-angle = 34; scan time = 6 hrs 33 mins; (2) High resolution spin-echo based 3D DTI with FOV = 1.8 x 1.8 x 1.8 cm; matrix = 128 x 128 x 128; resolution = 141 x 141 x 141 μm/pixel; TE/TR = 25/250 ms; diffusion directions = 60; Ao images = 5; B-value per direction = 1500 S/mm2. Post-Processing: Brains were registered to a reference template from Wake forest University’s Mouse Database and segmented using ITK-SNAP. DTI parameters were calculated using TrackVis.Results and Discussion:
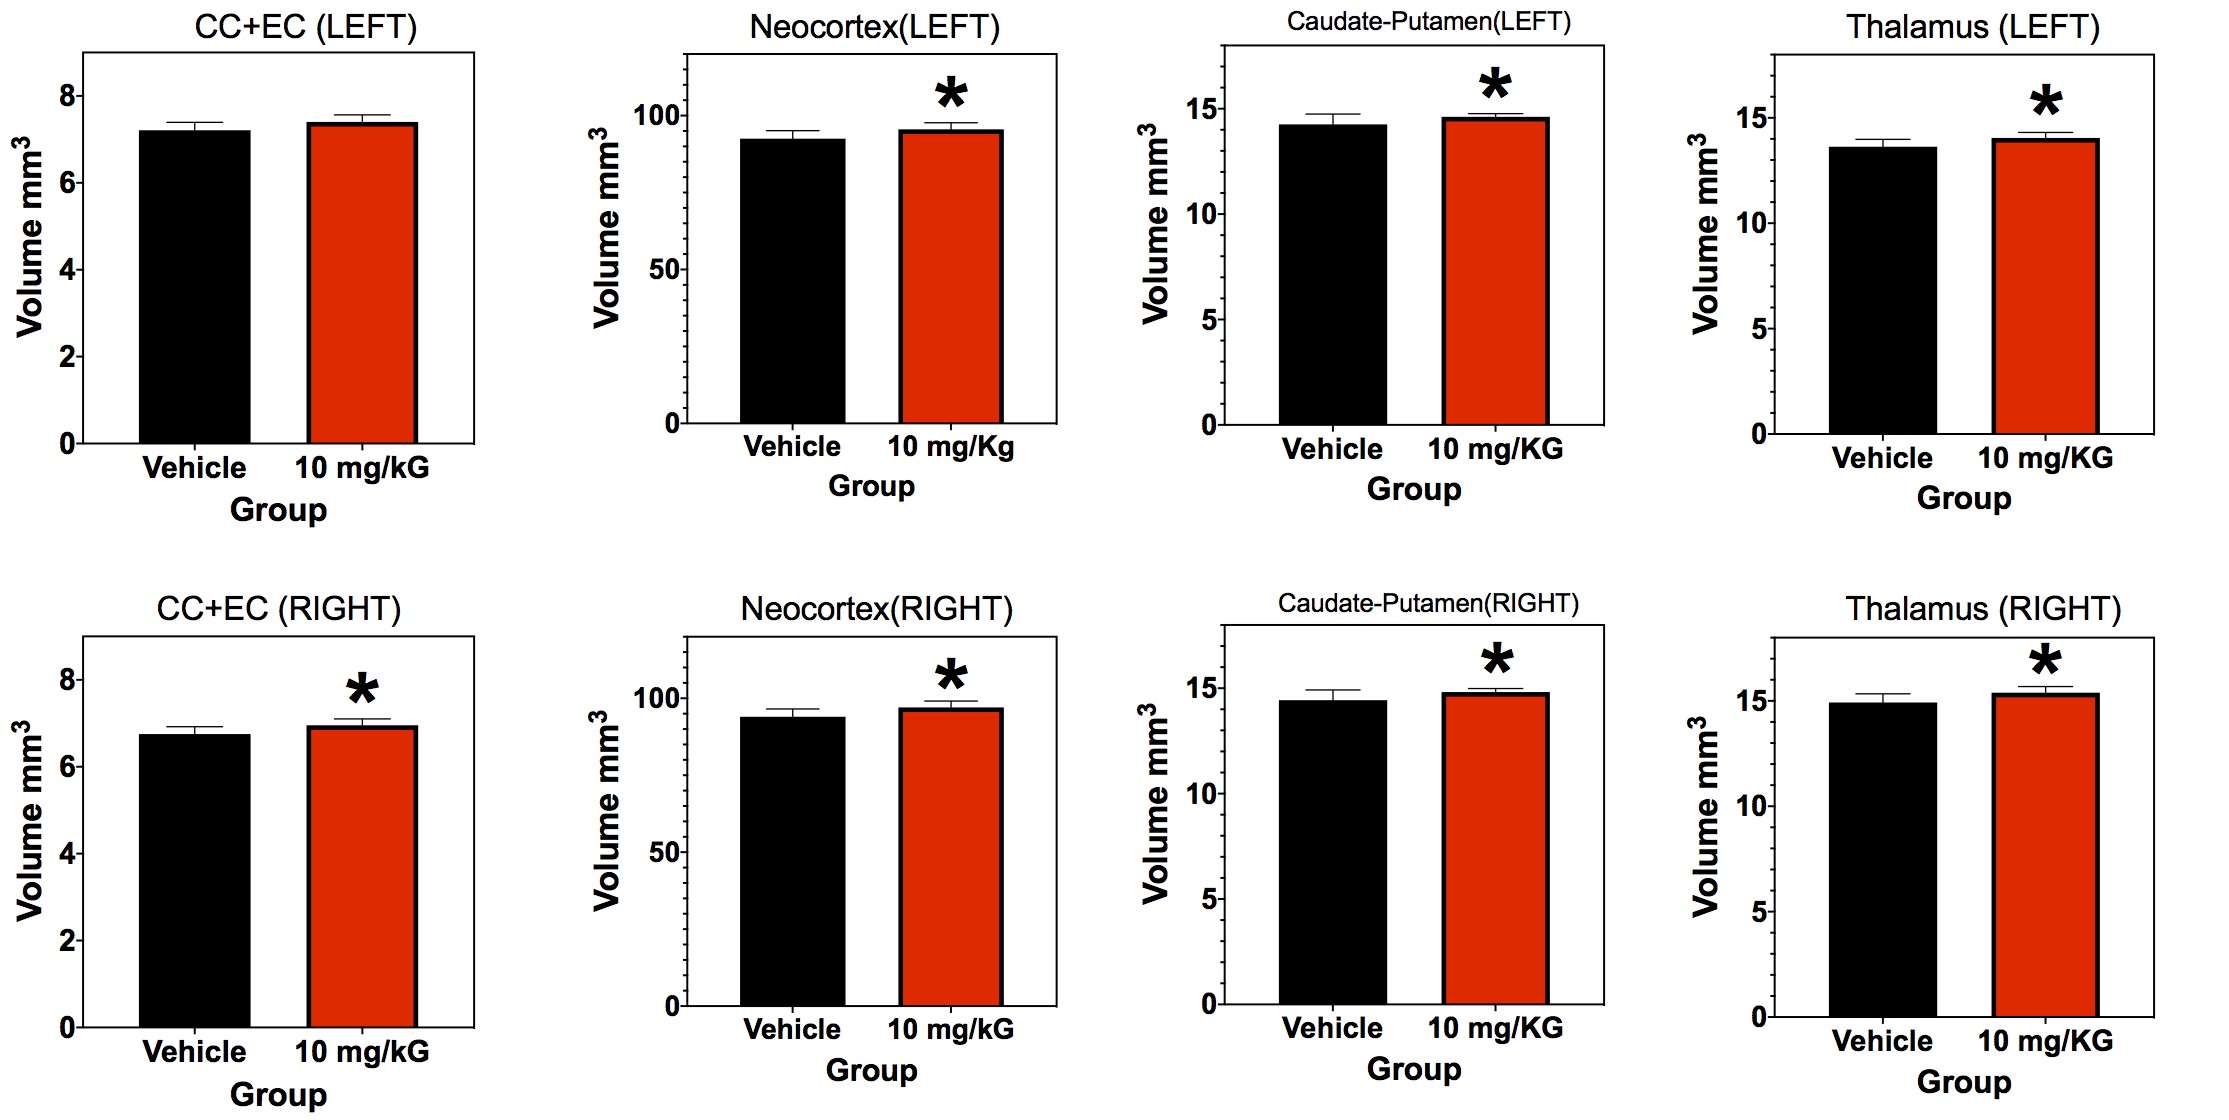
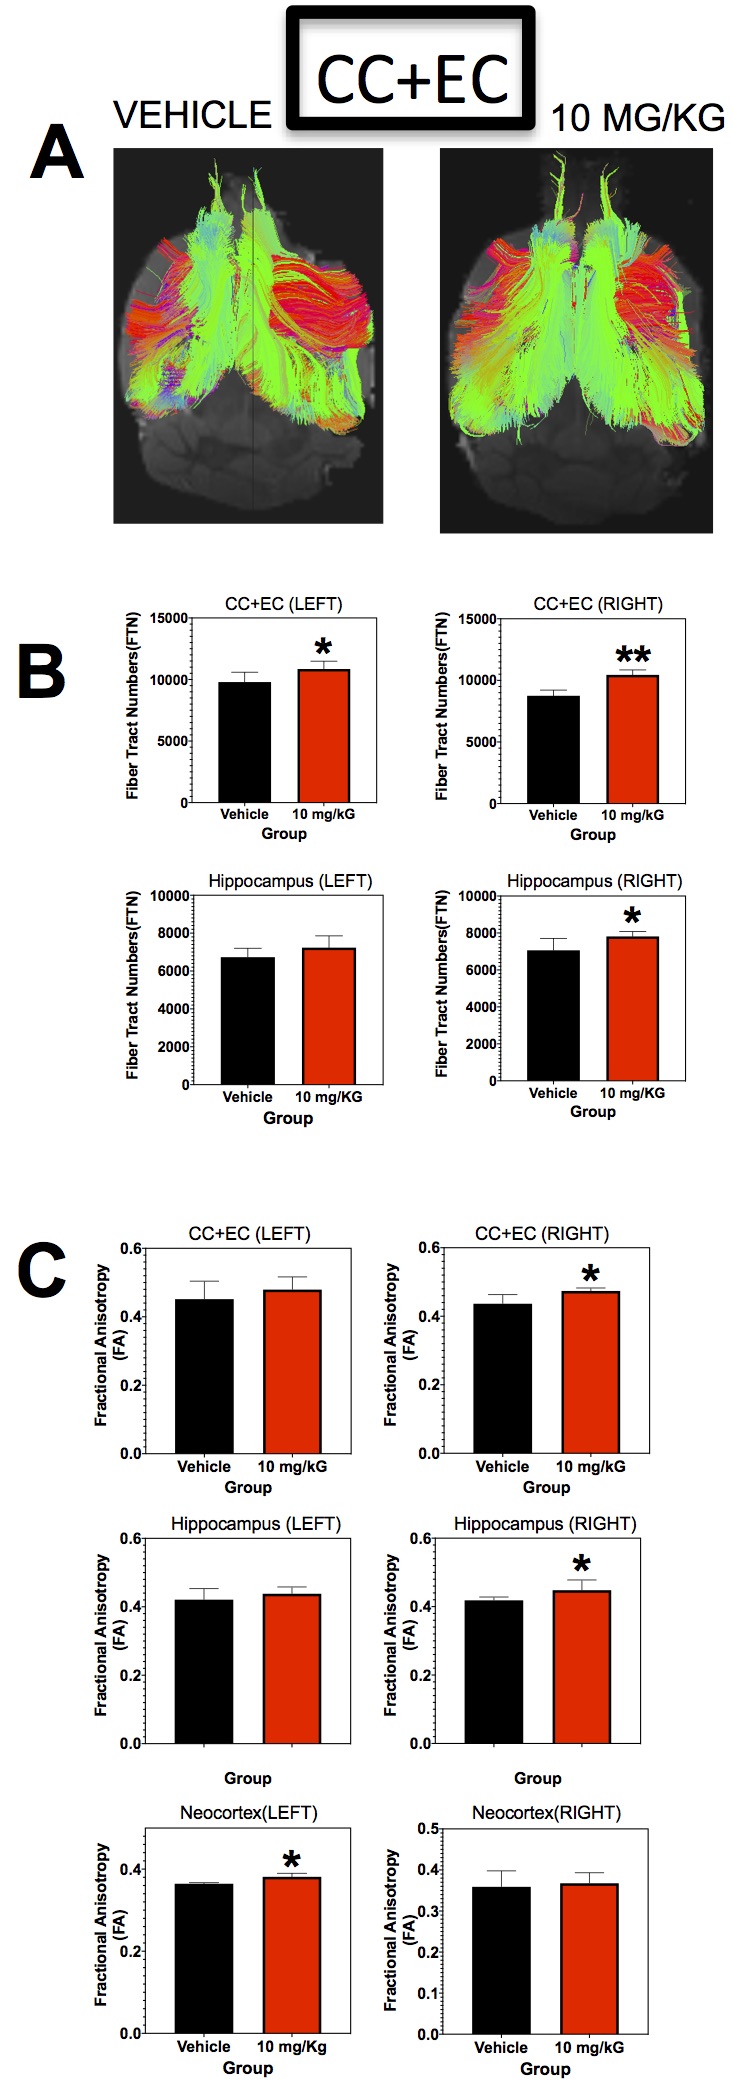
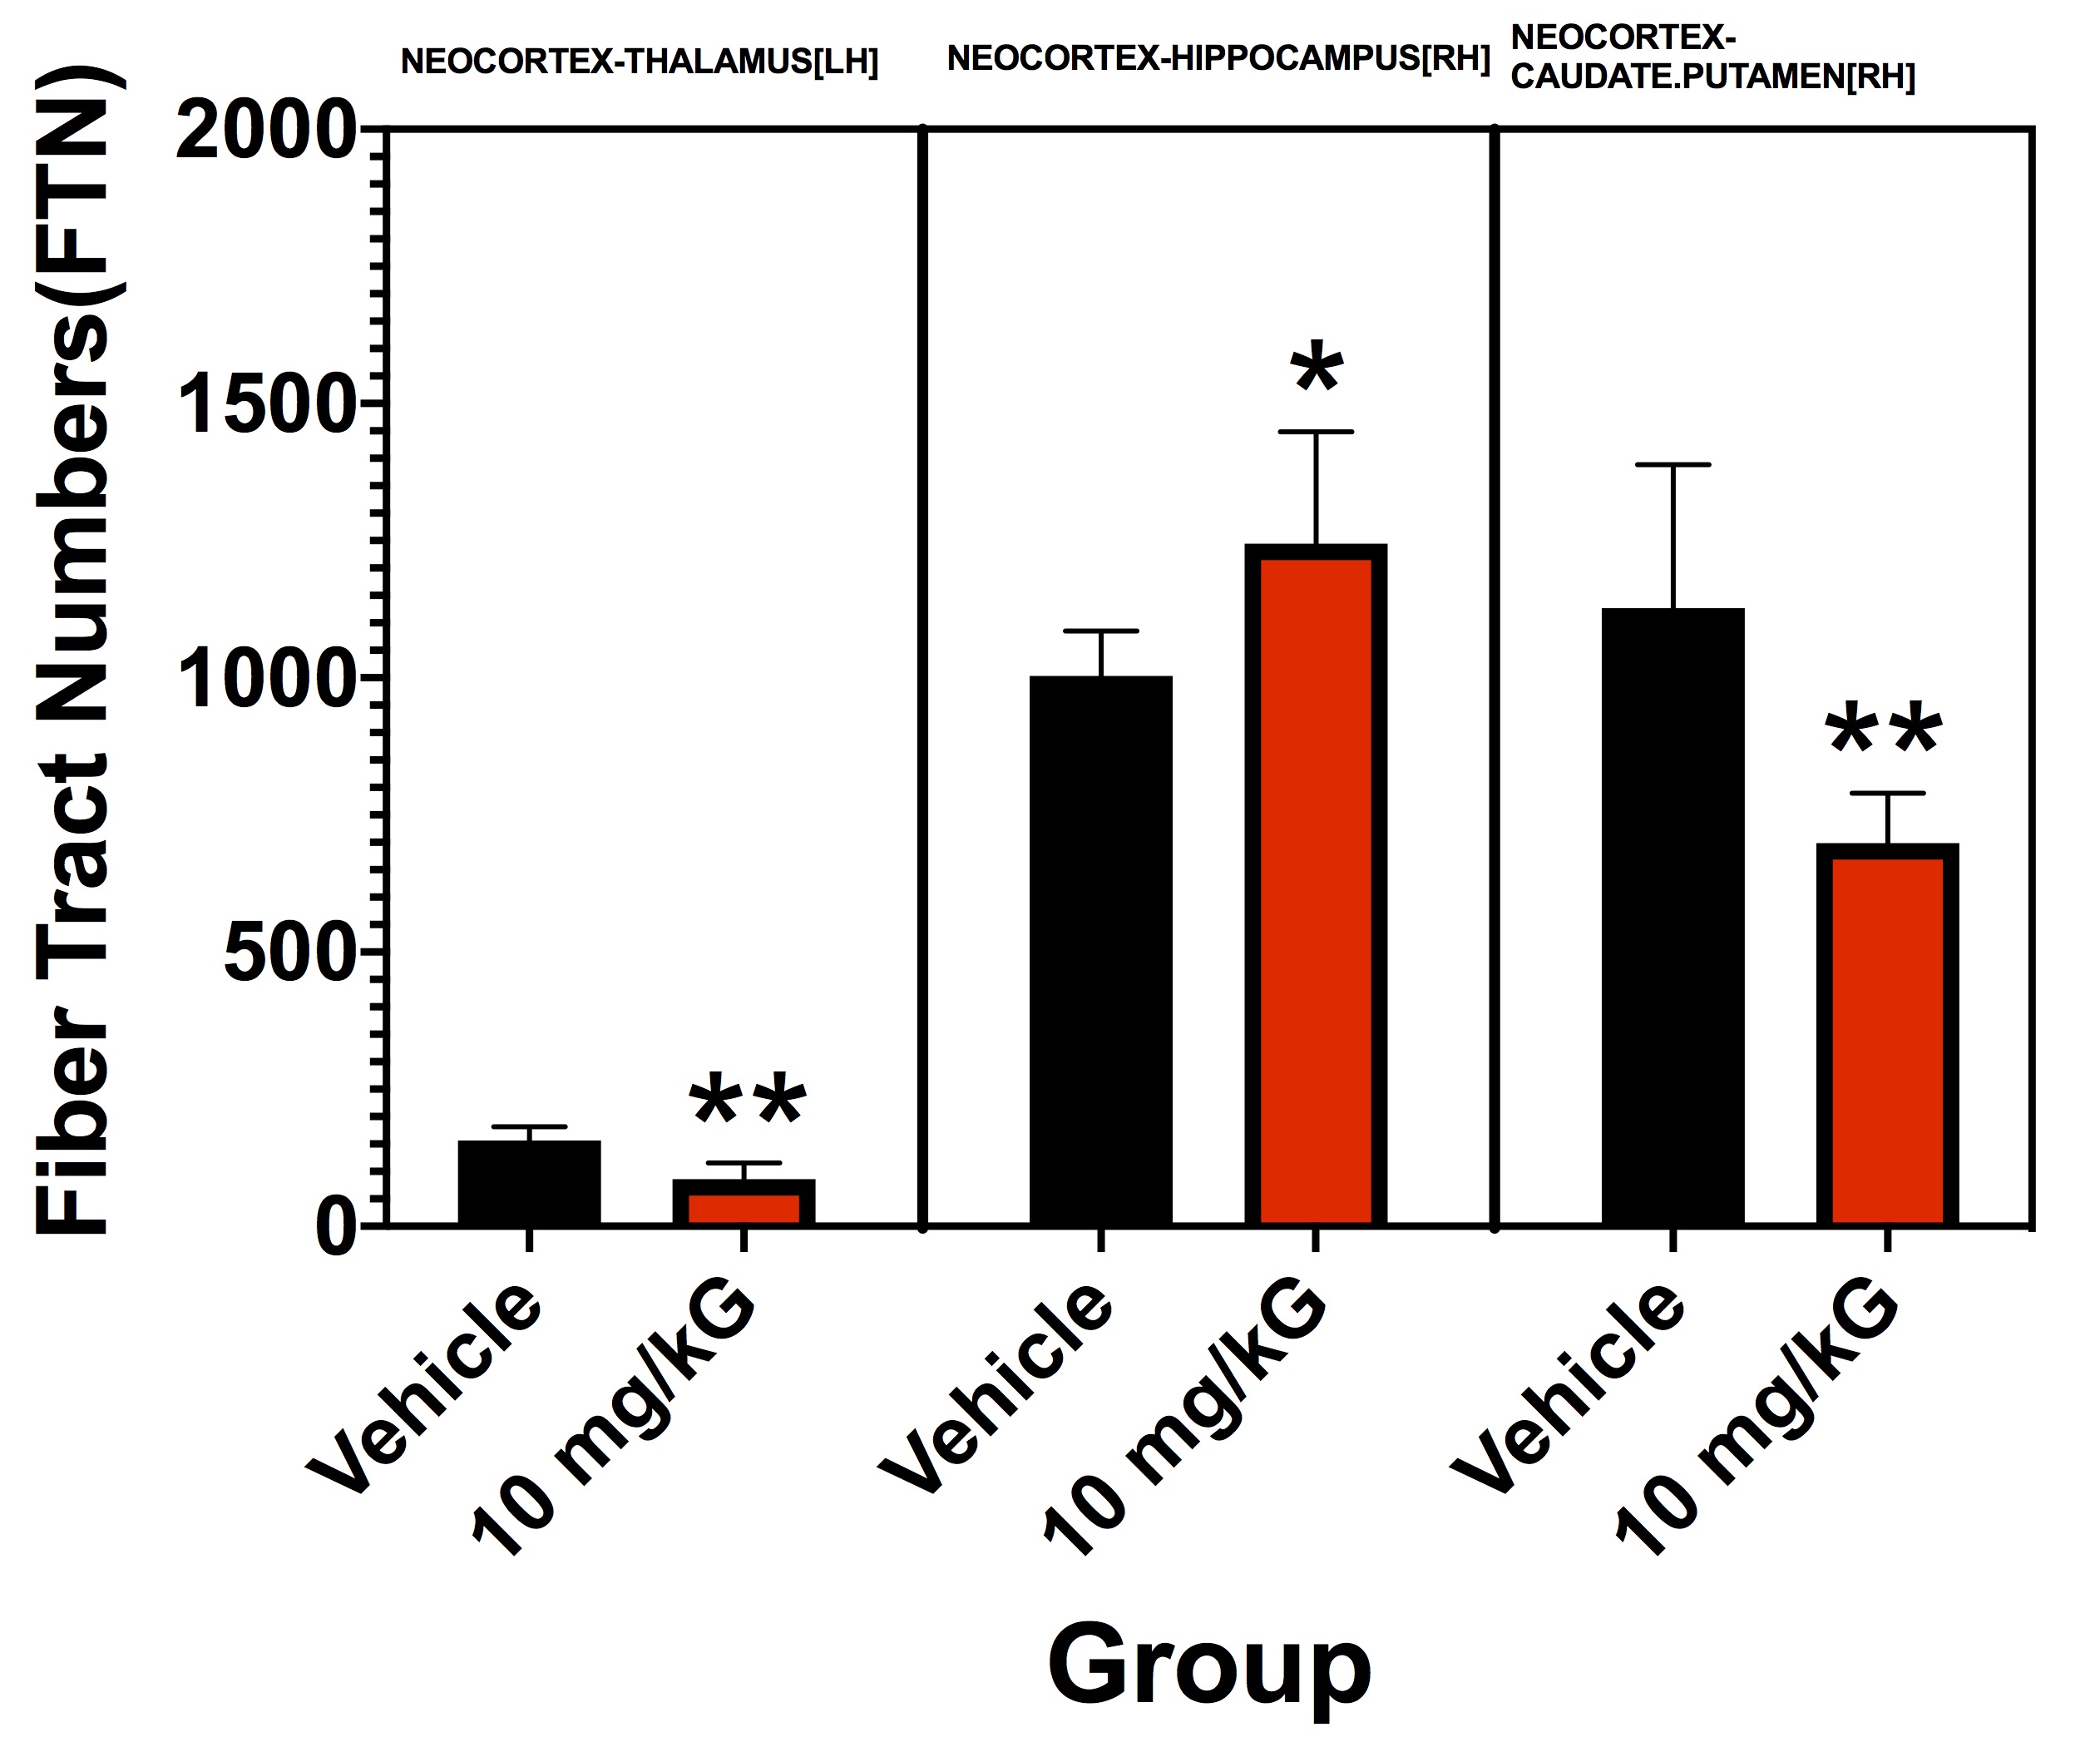
In treated MRL/lpr mice, there were significant regional volume increases in major white matter pathways (corpus collosum, CC; external capsule, EC), neocortex, caudate-putamen, and thalamus (Figure 1). Figure 2 shows representative DTI Tracts in control and treated mice. The un-parcellated fiber tract numbers (FTN) associated with CC+EC and Hippocampus are significantly increased in both hemispheres, however more significant in the right greater than left. Fractional Anisotropy (FA), a measure of white matter integrity, is also increased significantly (Figure 2C). Overall, changes in DTI parameters were typically asymmetrical between hemispheres. After parcellation, asymmetrical hemisphere differences remained apparent. Neocortex-thalamus fibers and neocortex-caudate-putamen fibers showed a significant decrease in number in the left hemisphere after therapy, whereas neocortex-hippocampal fibers in the right hemisphere showed a significant increase (Figure 3).Conclusions:
The present data suggest that selective regional volumes (CC+EC, Neocortex, Caudate-Putamen and Thalamus) and DTI Tractographic analyses (FTN and FA) are significantly altered in SLE model with and without therapy. Volumetric and connectomic analyses show the most significant therapeutic effects in and between neocortex, thalamus, hippocampus and caudate-putamen, with hemispheric asymmetry.Acknowledgements
No acknowledgement found.References
1. Tsokos G, Systemic Lupus Erythematosus: Basic, Applied and Clinical Aspects, Academic Press, Dec 23, 2015.
2. Kivity S, Agmon-Levin N, Zandman-Goddard G, Chapman J, Shoenfeld Y. Neuropsychiatric lupus: a mosaic of clinical presentations. BMC Med. 2015;13:43. Published 2015 Mar 4. doi:10.1186/s12916-015-0269-8.
3. Gulinello M, and Putterman C. The MRL/lpr Mouse Strain as a Model for Neuropsychiatric Systemic Lupus Erythematosus. J Biomed Biotechnol. 2011;2011:207504.
4. Johnson GA, Calabrese E, Badea A, Paxinos G, Watson C. A multidimensional magnetic resonance histology atlas of the Wistar rat brain. Neuroimage 2012;62:1848-1856.
Figures