1938
Temporal alterations of GluCEST contrast in a rat model of cuprizone-induced demyelination and remyelination1Department of Radiology, Asan Medical Center, University of Ulsan College of Medicine, Seoul, Republic of Korea, 2Convergence Medicine Research Center, Asan Institute for Life Sciences, Asan Medical Center, Seoul, Republic of Korea, 3Department of Convergence Medicine, Asan Medical Center, University of Ulsan College of Medicine, Seoul, Republic of Korea, 4Asan Image Research, Asan Institute for Life Sciences, Asan Medical Center, Seoul, Republic of Korea, 5Faculty of Health Sciences and Brain & Mind Centre, The University of Sydney, Sydney, Australia
Synopsis
Research on changes to glutamate signaling in the white matter of demyelinating diseases may provide important biophysical information for diagnostic and prognostic assessment. We attempted to evaluate glutamate signals in a cuprizone-induced rat model of demyelination by GluCEST imaging. GluCEST imaging provides in vivo image contrast of changing glutamate concentrations during demyelination and subsequent remyelination. We also performed histological validation to analyze the state of myelinated axons. GluCEST imaging could be a useful tool to evaluate brain metabolism in demyelination and remyelination models and provide quantitative results that are highly representative of changes to glutamate levels in vivo.
INTRODUCTION
Multiple sclerosis (MS) is an inflammatory demyelinating disease of the central nervous system that interferes with saltatory nerve conduction, causing axon degeneration and neuronal dysfunction.1,2 Remyelination, a regenerative process allows formation of new myelin sheaths in demyelinated axons. Biophysical assessment of remyelination through observational and follow-up studies is an important diagnostic and therapeutic strategy for preventing axonal loss in MS.3,4 Interestingly, increasing evidence suggests that changes in in vivo glutamate are pathophysiologically observed during demyelination and remyelination in the brain’s white matter.5,6 Therefore, observing and evaluating changes in glutamate levels is important, as it has the potential to function as an essential biomarker for estimating brain metabolism in the myelination process. Recently, chemical exchange saturation transfer (CEST) MRI has been introduced as a new contrast enhancement technique that enables the indirect detection of molecules with exchangeable protons and exchange-related properties.7-10 This study aimed to quantitatively evaluate in vivo glutamate changes within the corpus callosum in a reversible, cuprizone-induced rat model of demyelination using glutamate CEST (GluCEST) imaging. Furthermore, immunohistochemistry enabled characterizing the region in the corpus callosum where demyelination/remyelination occurs, specifically by following changes in myelinated axon.METHODS
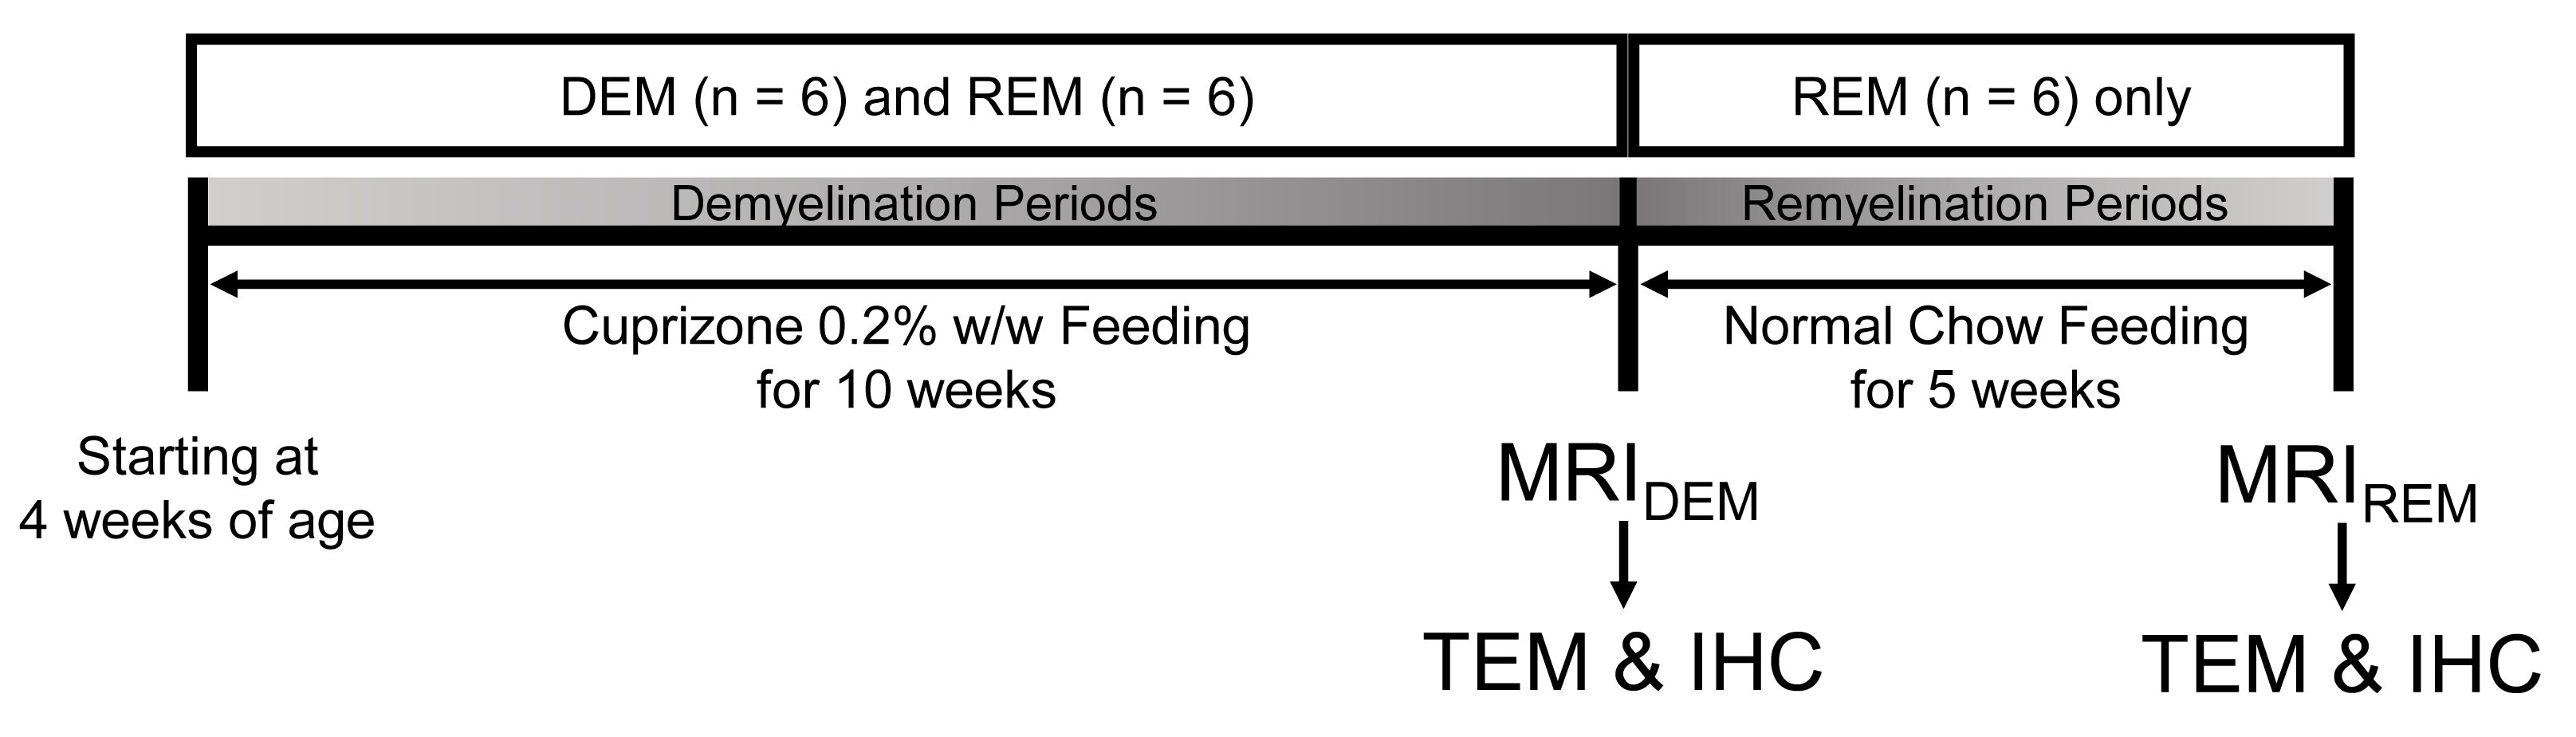
Animal Models: Starting at 4 weeks of age, 18 male Wistar rats, divided into two groups [cuprizone-induced group, n=12; control group (CTRL), n=6], were used. The cuprizone-induced rats were fed a milled diet with 0.2% cuprizone for 10 weeks to induce demyelination (demyelination group, DEM, n=6) and were then changed to a normal chow diet for the recovery phase during an additional 5 weeks (remyelination group, REM, n=6).3,4 CTRL rats were fed a normal chow diet only. Figure 1 represents a schematic diagram of the cuprizone challenge.MRI experiment: All GluCEST imaging data were obtained from a 7-T Bruker scanner based on Turbo-RARE sequence with 25 frequency offsets (-6 ~ +6 ppm at intervals of 0.5 ppm, and unsaturated (S0) image). Images were acquired using a continuous-wave RF saturation pulse (power=3.6-μT, saturation time=1-s).10 For B0 correction, WASSR dataset with 29 frequency offsets was acquired from -0.8 to 0.8 ppm (0.05 ppm increment) using 0.3-μT RF saturation power. For B1 correction, B1 map using double flip-angle (30° and 60°) was acquired.8
Data processing: Using B0 and B1 corrected CEST data, the GluCEST contrast was computed by subtracting the normalized magnetization signal at 3.0 ppm from the magnetization at the corresponding reference frequency symmetrically at the upfield from water; [Ssat(-3.0ppm) - Ssat(+3.0ppm)] / Ssat(-3.0ppm).8,10 An ROI for the calculation of the GluCEST values was set in the corpus callosum region. Statistical differences in GluCEST signals among the three groups (CTRL, DEM and REM) were analyzed using a one-way analysis of variance test, followed by Tukey’s post-hoc test (p < 0.05).
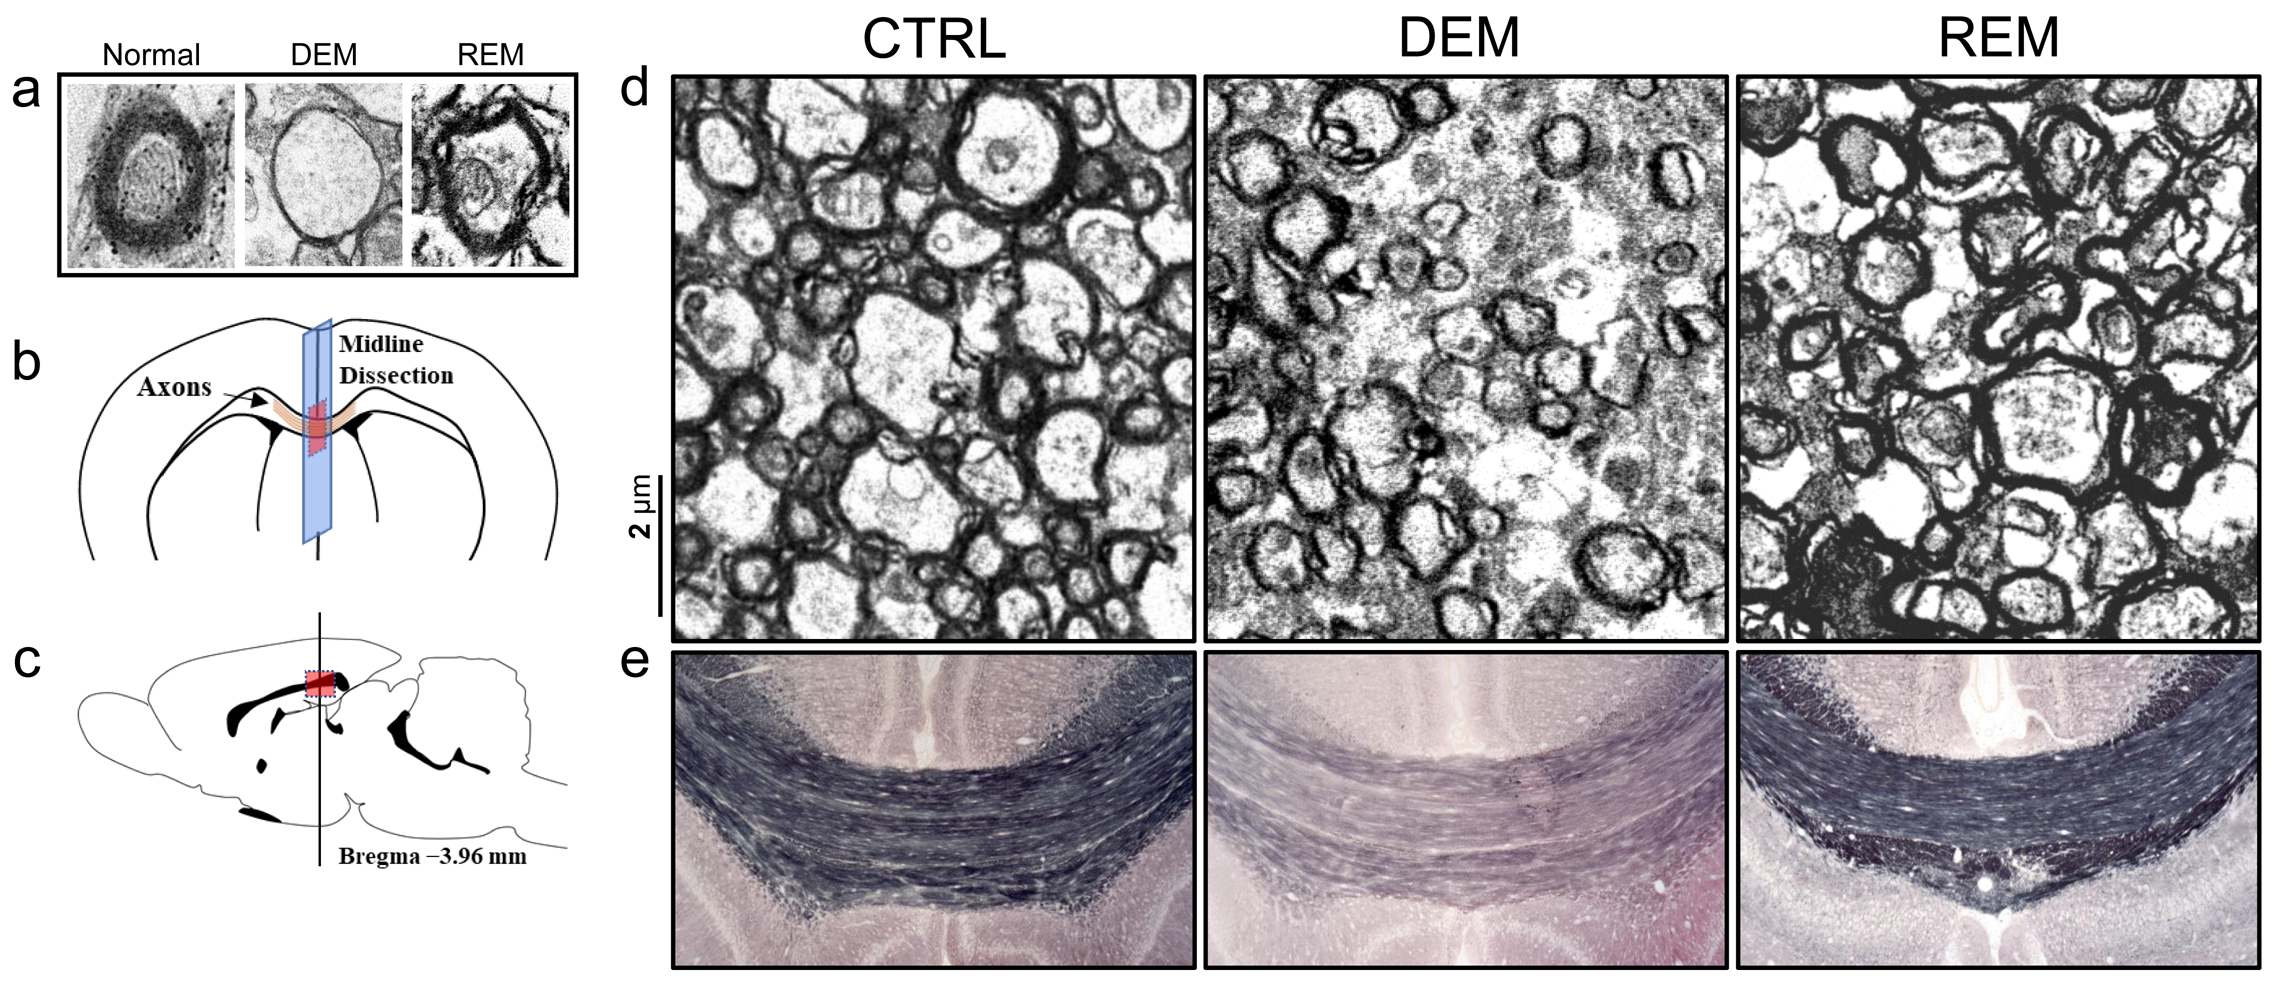
Transmission Electron Microscopy (TEM): Following cardiac perfusion11 with 4% PFA, the brain was removed, and the area immediately encompassing the midline of the corpus callosum was dissected into 1-mm sections and oriented such that cross sections of axons within the corpus callosum were obtained. Ultrathin sections were cut below 1-μm thickness and stained with toluidine blue. The axons and myelin were scanned and imaged using a Hitachi-H-7600 TEM system.
Immunohistochemistry (IHC) staining: Myelin staining in frozen sections including the corpus callosum area was performed using Black-Gold-II staining according to the manufacturer’s instructions (EMD Millipore).12 All sections were incubated in ddH2O for 2-min, then in a moist chamber at 60℃ for 12-min in prewarmed Black-Gold-II solution. The slides were rinsed twice in ddH20, incubated in prewarmed 1% sodium thiosulfate for 3-min, followed by three washes in ddH2O. Stained sections were scanned and imaged in the midline of the corpus callosum area.
RESULTS AND DISCUSSION
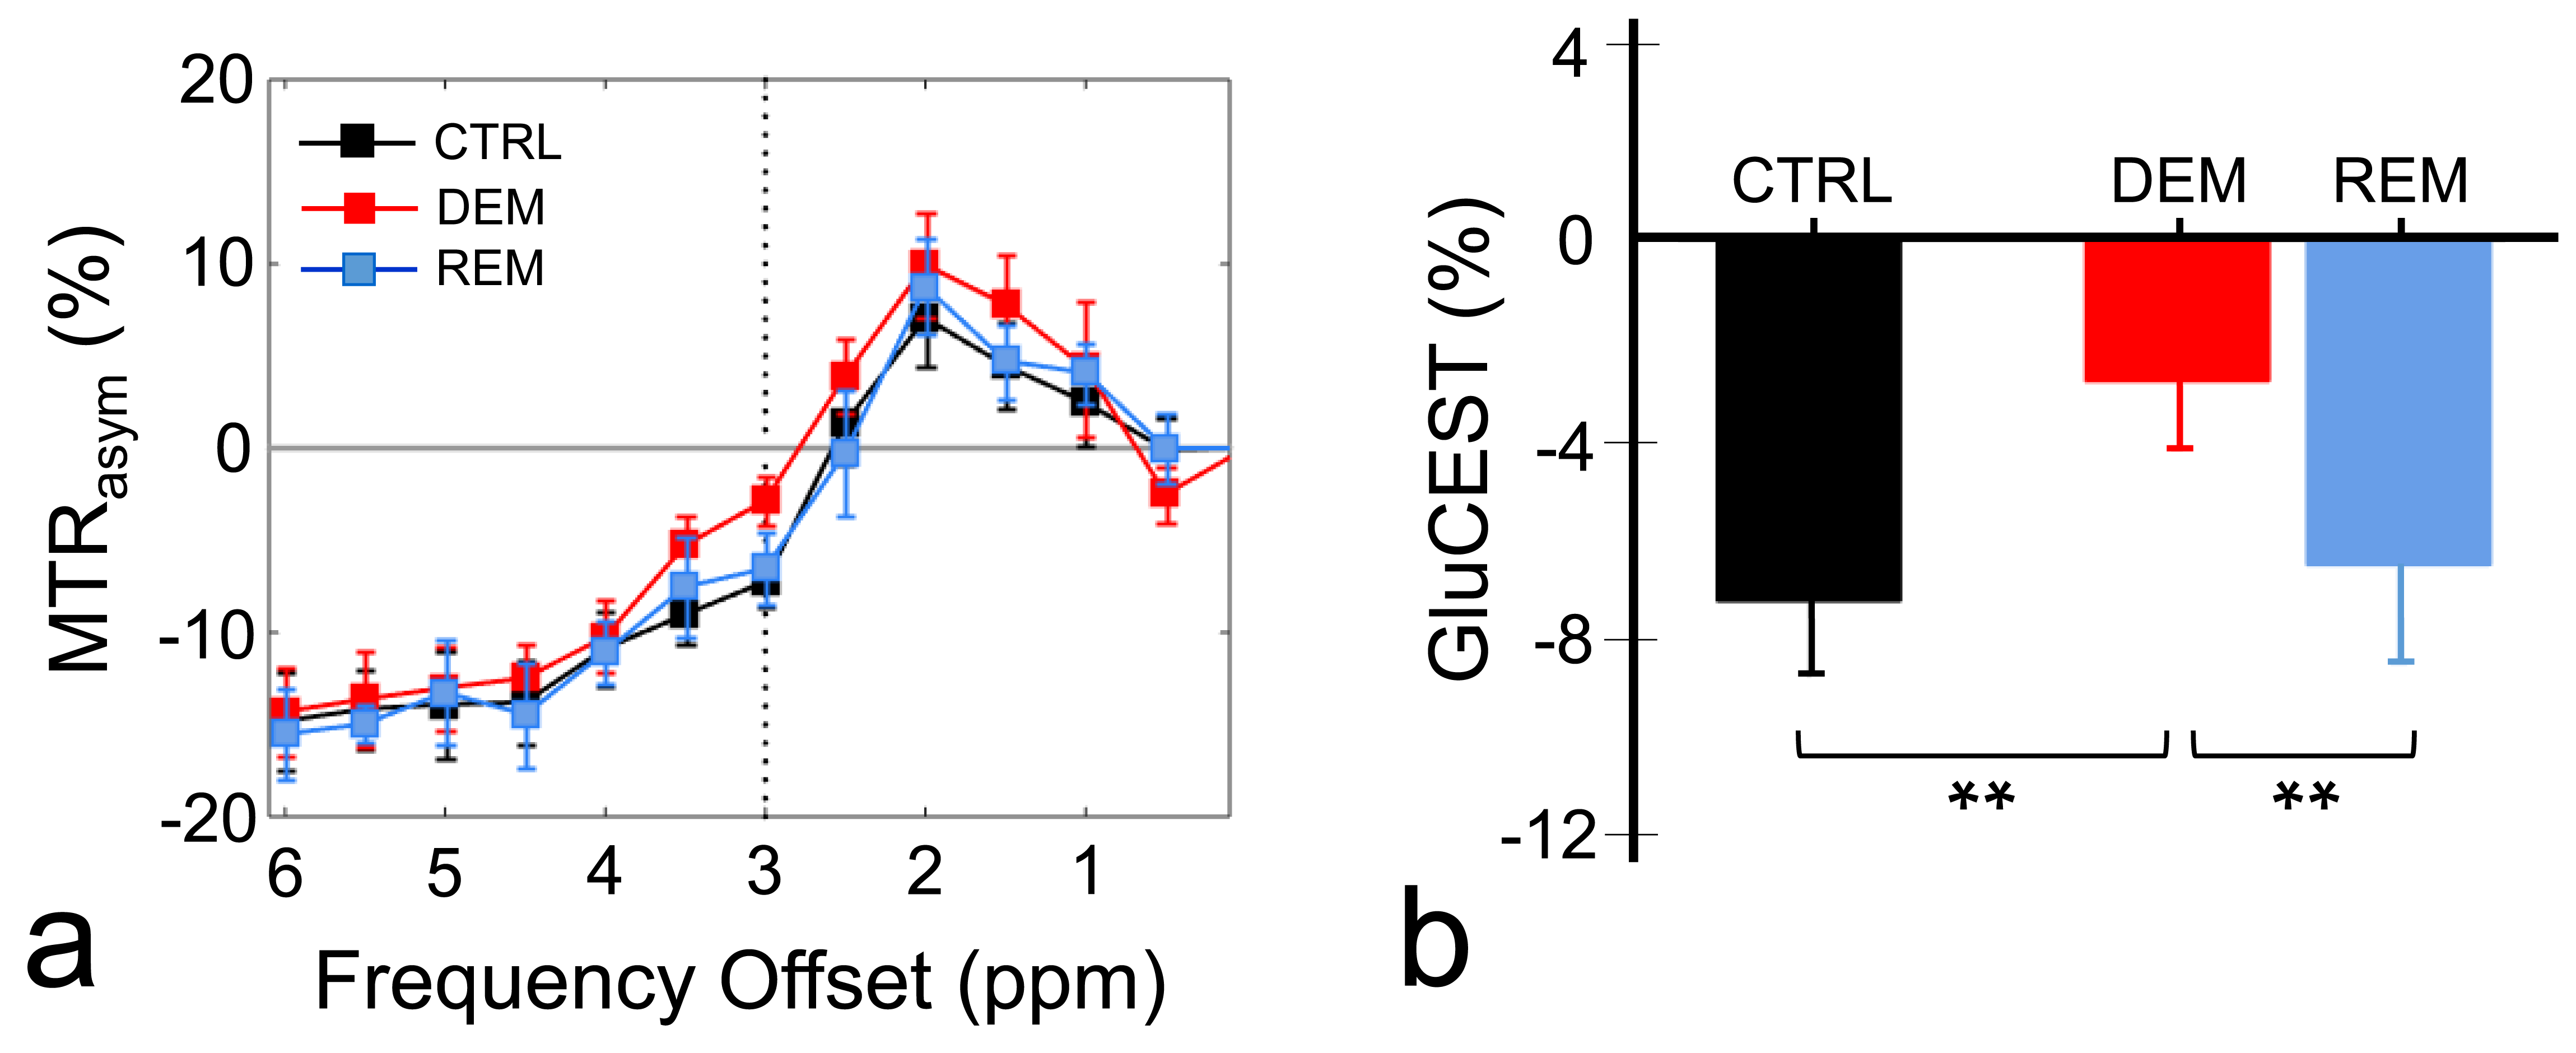
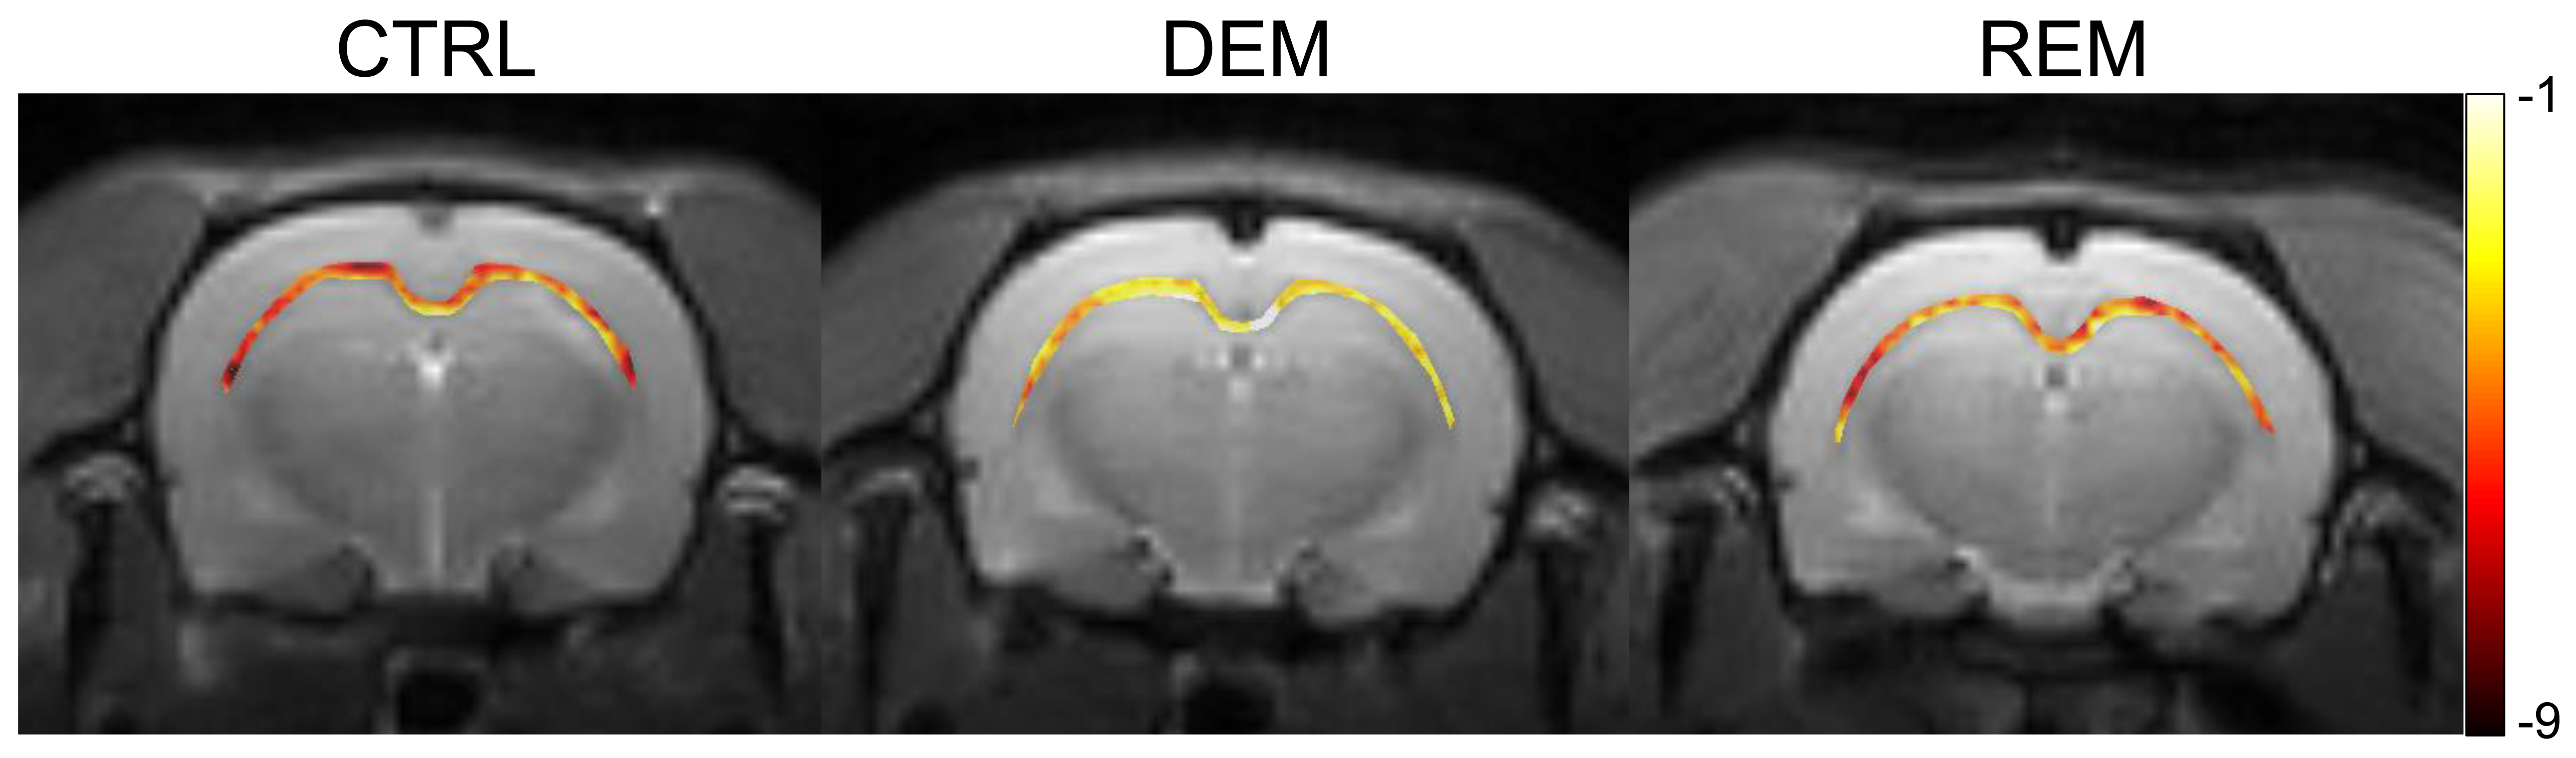
The MTRasym spectra in the corpus callosum showed significant differences between DEM and CTRL groups (Fig.2a), indicating that the CEST signals at 3.0-ppm (GluCEST) were increased in the DEM group than in CTRL. Quantified GluCEST signals between DEM and CTRL were -7.25±1.42% and -2.84±1.30%, respectively (Fig.2b), with a significant statistical difference (p = 0.001). These findings, showing increased in vivo glutamate signals in the demyelinated lesion, are concurrent with results from previous studies using proton MR spectroscopy.2,6 During remyelination, however, the increased glutamate signals decreased (-6.52±1.95%; Fig.2b) to levels which were not significantly different from those in CTRL rats (p = 0.734). On GluCEST maps, focused on the corpus callosum region and overlaid on unsaturated CEST image (Fig.3), signal changes showed hyperintensities in DEM than in CTRL, which decreased in REM and were not significantly different from those in CTRL (Fig.3). The extent of remyelination (recovery) and axonal damage were further confirmed by TEM and IHC staining, which showed fewer myelinated axons at the corpus callosum in the DEM rats than in the CTRL and REM rats (Fig.4a,d,e). The findings of this study indicate that it is possible to use the CEST method to detect changes in glutamate in a rat model of cuprizone-induced demyelination and remyelination.CONCLUSIONS
We demonstrated that GluCEST imaging is adequately sensitive to detect in vivo changes in glutamate in the demyelination process. Significant temporal contrast changes in GluCEST metric coupled with histological characteristics of both the demyelination and remyelination processes clearly indicated that GluCEST imaging could be a useful tool to monitor myelination processes.Acknowledgements
This work was supported by grants from the Basic Science Research Program through the National Research Foundation of Korea [NRF-2018R1C1B6004521 and NRF-2018R1A2B2007694], funded by the Korea Government (MSIT).References
1. Geurts JJ, Reuling IE, Vrenken H, Uitdehaag BM, Polman CH, Castelijns JA, Barkhof F, Pouwels PJ. MR spectroscopic evidence for thalamic and hippocampal, but not cortical, damage in multiplesclerosis. Magn Reson Med. 2006;55(3):478-483.
2. Azevedo CJ, Kornak J, Chu P, Sampat M, Okuda DT, Cree BA, Nelson SJ, Hauser SL, Pelletier D. In vivo evidence of glutamate toxicity in multiple sclerosis. Ann Neurol. 2014;76(2):269-278.
3. Wang N, Zhuang J, Wei H, Dibb R, Qi Y, Liu C. Probing demyelination and remyelination of the cuprizone mouse model using multimodality MRI. J Magn Reson Imaging. 2019; doi: 10.1002/jmri.26758.
4. Yano R, Hata J, Abe Y, Seki F, Yoshida K, Komaki Y, Okano H, Tanaka KF. Quantitative temporal changes in DTI values coupled with histological properties in cuprizone-induced demyelination and remyelination. Neurochem Int. 2018;119:151-158.
5. Pitt D, Werner P, Raine CS. Glutamate excitotoxicity in a model of multiple sclerosis. Nat Med. 2000;6:67–70.
6. Srinivasan R, Sailasuta N, Hurd R, Nelson S, Pelletier. Evidence of elevated glutamate in multiple sclerosis using magnetic resonance spectroscopy at 3T. Brain. 2005;128(Pt 5):1016-1025.
7. Guivel-Scharen V, Sinnwell T, Wolff S, Balaban R. Detection of proton chemical exchange between metabolites and water in biological tissues. J Magn Reson. 1998;133(1):36-45.
8. Cai K, Haris M, Singh A, Kogan F, Greenberg JH, Hariharan H, Detre JA, Reddy R. Magnetic resonance imaging of glutamate. Nat Med. 2012;18(2):302-306. 9. By S, Barry RL, Smith AK, Lyttle BD, Box BA, Bagnato FR, Pawate S, Smith SA. Amide proton transfer CEST of the cervical spinal cord in multiple sclerosis patients at 3T. Magn Reson Med. 2018;79(2):806-814.
10. Lee DH, Woo CW, Kwon JI, Chae YJ, Ham SJ, Suh JY, Kim ST, Kim JK, Kim KW, Woo DC, Lee DW. Cerebral mapping of glutamate using chemical exchange saturation transfer imaging in a rat model of stress-induced sleep disturbance at 7.0T. J Magn Reson Imaging. 2019; doi:10.1002/jmri.26769.
11. Ray AK, DuBois JC, Gruber RC, Guzik HM, Gulinello ME, Perumal G, Raine C, Kozakiewicz L, Williamson J, Shafit‐Zagardo B. Loss of Gas6 and Axl signaling results in extensive axonal damage, motor deficits, prolonged neuroinflammation, and less remyelination following cuprizone exposure. Glia. 2017;65(12):2051-2069.
12. Schmued L, Bowyer J, Cozart M, Heard D, Binienda Z, Paule M. Introducing Black-Gold II, a highly soluble gold phosphate complex with several unique advantages for the histochemical localization of myelin. Brain Res. 2008;10;1229:210-217.
Figures