1936
Longitudinal brain connectome reorganization in a tauopathy mouse model of Alzheimer's disease1University of Strasbourg and CNRS, ICube Laboratory UMR 7357, Strasbourg, France, 2The University of Sydney, Faculty of Engineering, School of Aerospace, Mechanical and Mechatronic Engineering, Sydney, Australia, 3CNRS, University of Strasbourg, INCI, UMR 7168, Strasbourg, France, 4Department of Radiology, Medical Physics, University Medical Center Freiburg, Freiburg, Germany, 5Laboratoire de Neuroscience Cognitives et Adaptatives, Strasbourg, France, 6University Hospital of Strasbourg, CM2R (Memory Resource and Research Centre), Day Hospital, Geriatrics Department, Strasbourg, France, 7Department of Biophysics and Nuclear Medicine, University Hospital of Strasbourg, Strasbourg, France
Synopsis
MRI is a unique tool to understand the complexity of the brain functional and structural communication evolution over time. Among the main mechanisms of AD, tauopathy remains poorly studied in preclinical imaging. We used graph theory approaches and DTI analysis in a longitudinal study of Thy-Tau22 mice, associated with behavioral evaluation. Alterations of the cholinergic septal circuitry, supporting memory and emotional processes, were found as the main hallmark of the progression of the pathology, associated with default mode network dysfunction, both starting before the first memory deficits.
Introduction
Longitudinal brain MRI studies in rodent models of Alzheimer’s disease (AD) offer the unique opportunity to explore the brain structure and function even before the emergence of cognitive decline, and to follow-up modifications of the connectome across lifespan. Such approaches may lead to the identification of vulnerable pathways or cerebral network hubs, triggered by the main mechanisms of the disease. However, a comprehensive analysis of the evolution of the brain connectome reorganization in specific tauopathy models - a crucial pathological mechanism in AD1 - wasn’t proposed before. To provide a comprehensive insight of the Tau pathology evolution and its impact on the brain connectivity from early onset to the late stage of the disease, we combined graph theory analysis2 of brain functional networks and structural connectivity investigations along time in a mouse model of tauopathy, with behavioral assessment.Material and Methods
Animals:Two groups of wild-type (WT) C57Bl6/J mice (n=13) and Thy-Tau223 (n=16) mice were characterized at 5, 9, and 13 months via resting-state functional MRI (rsfMRI), DTI and behavioral tests to explore early, intermediate and late stages of the disease respectively.
Behavioral tests:
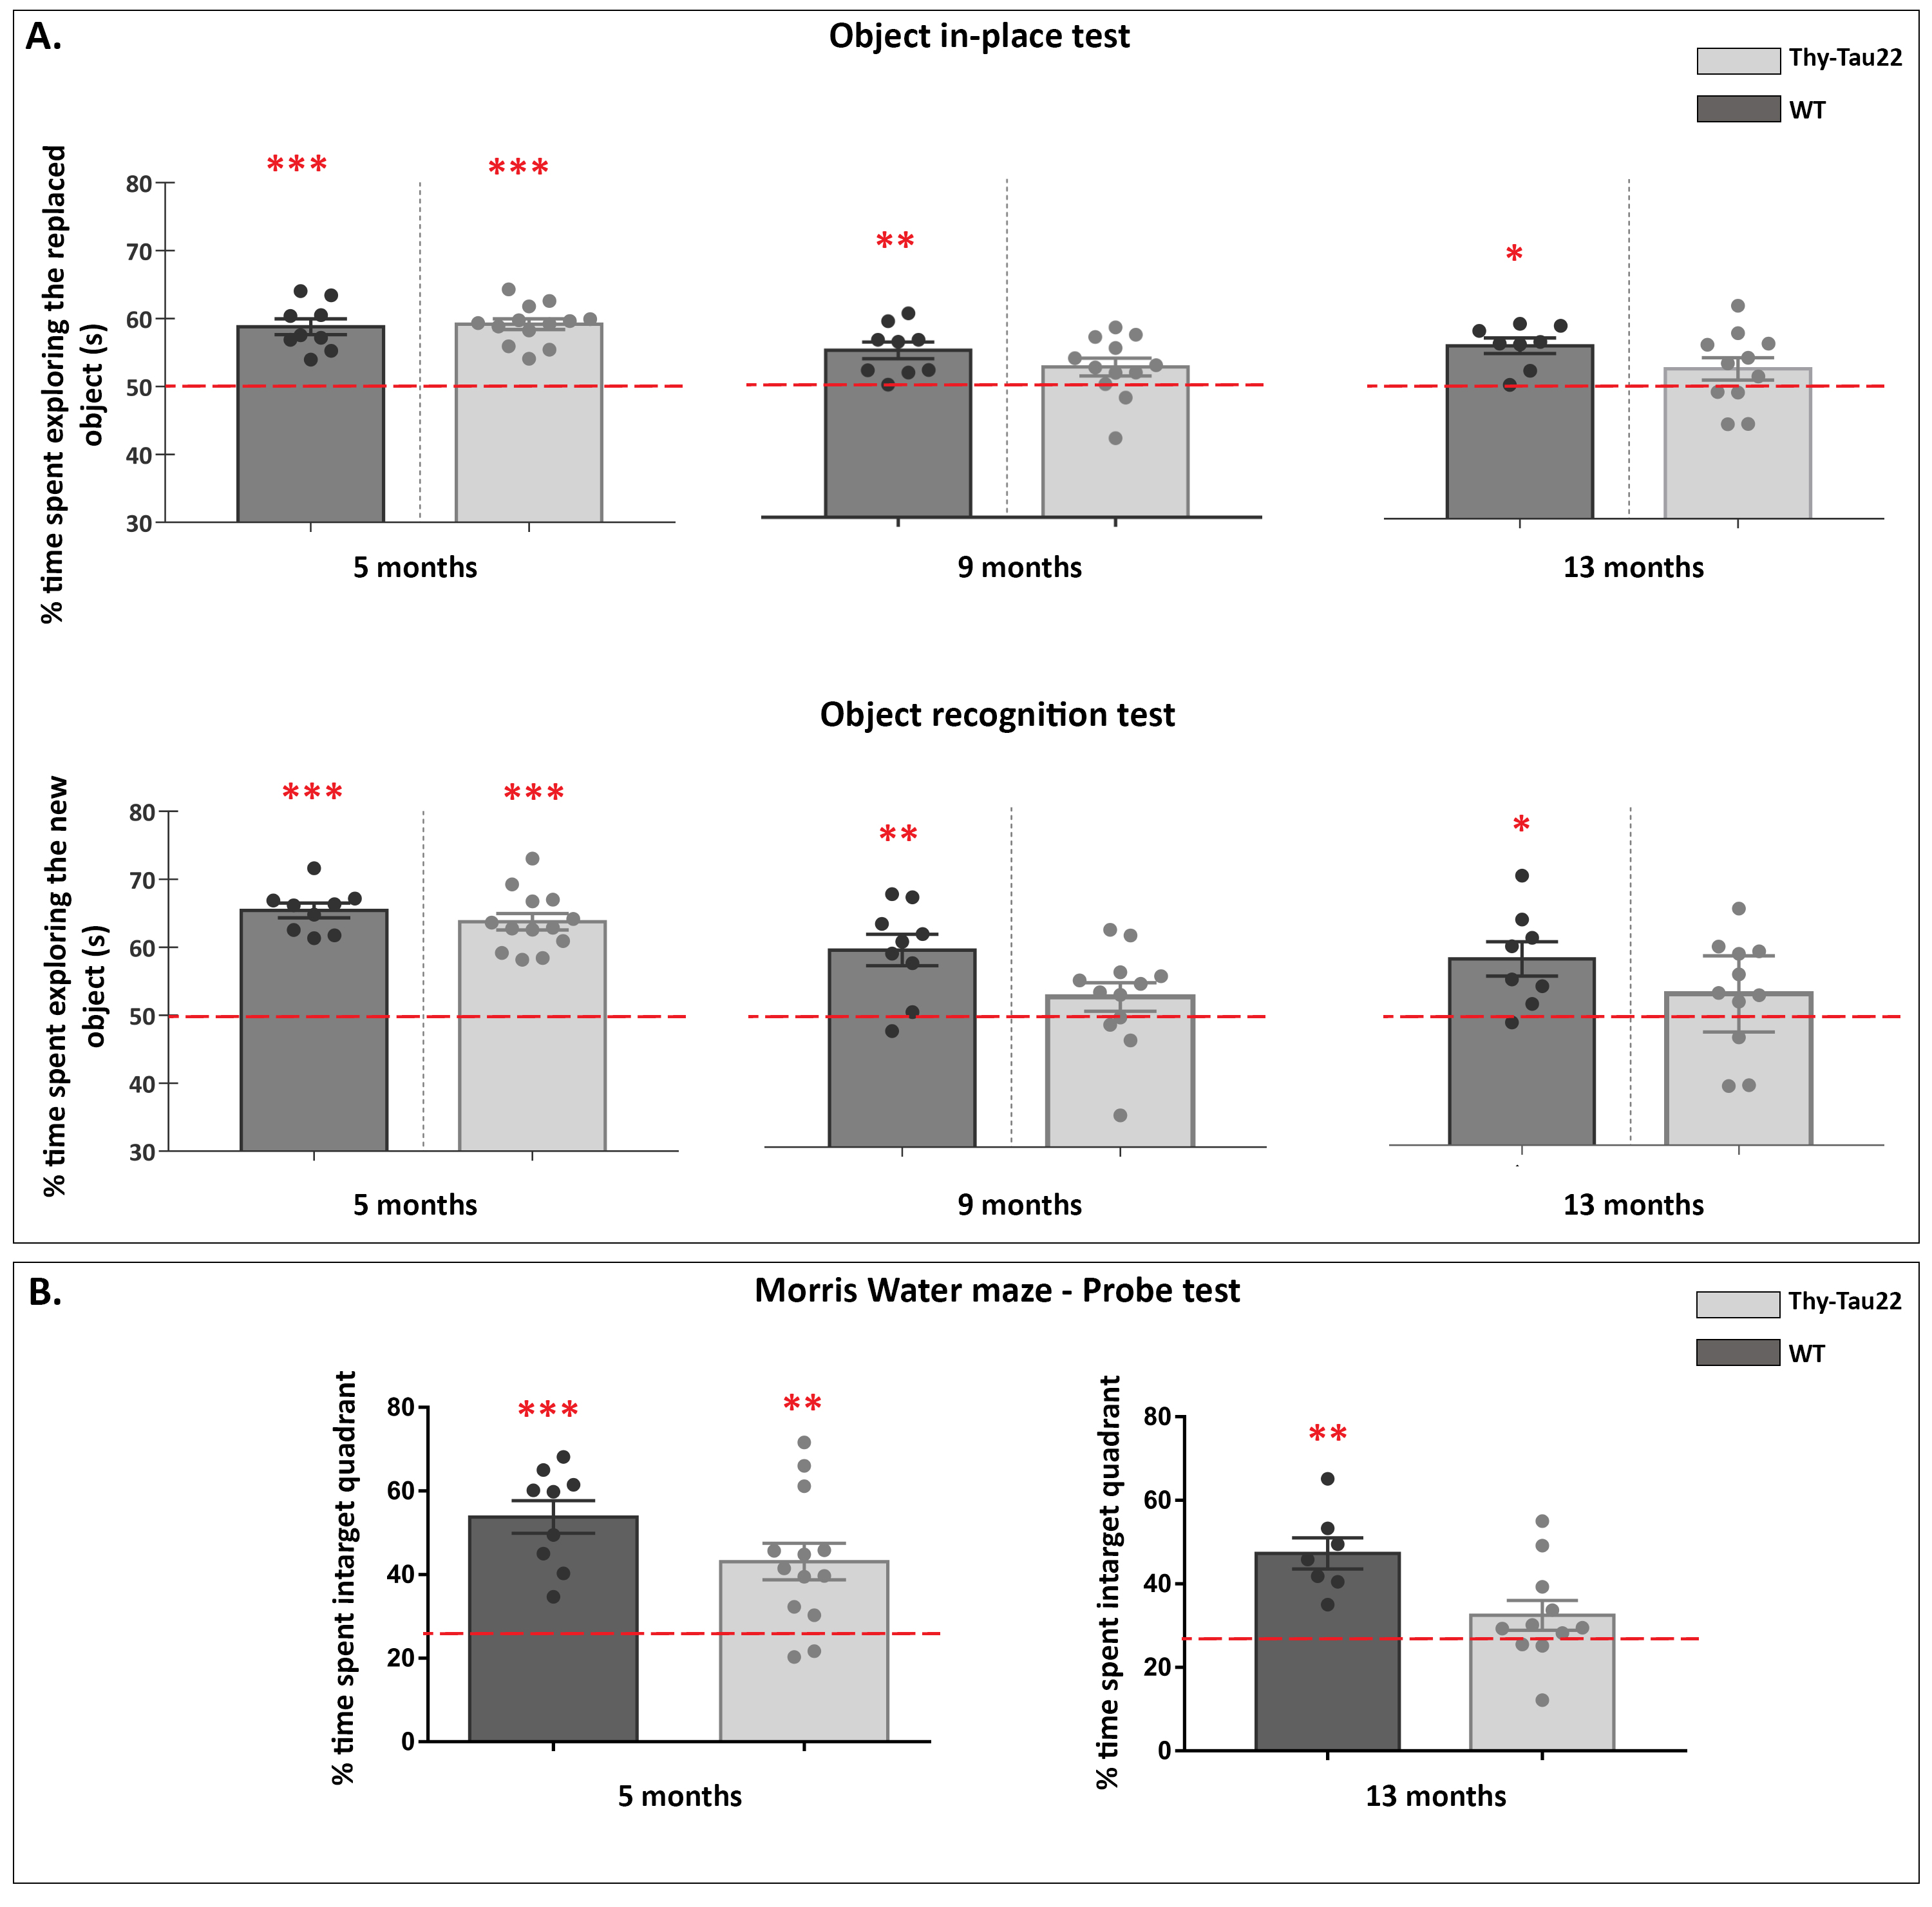
At 5, 9 and 13 months, cognitive abilities of mice were tested using two object exploration paradigms, and the Morris water maze (MWM). Those tests are related to hippocampal and associated areas functions, reflecting memory capacities of mice4–6.
MRI experiments and data analysis:
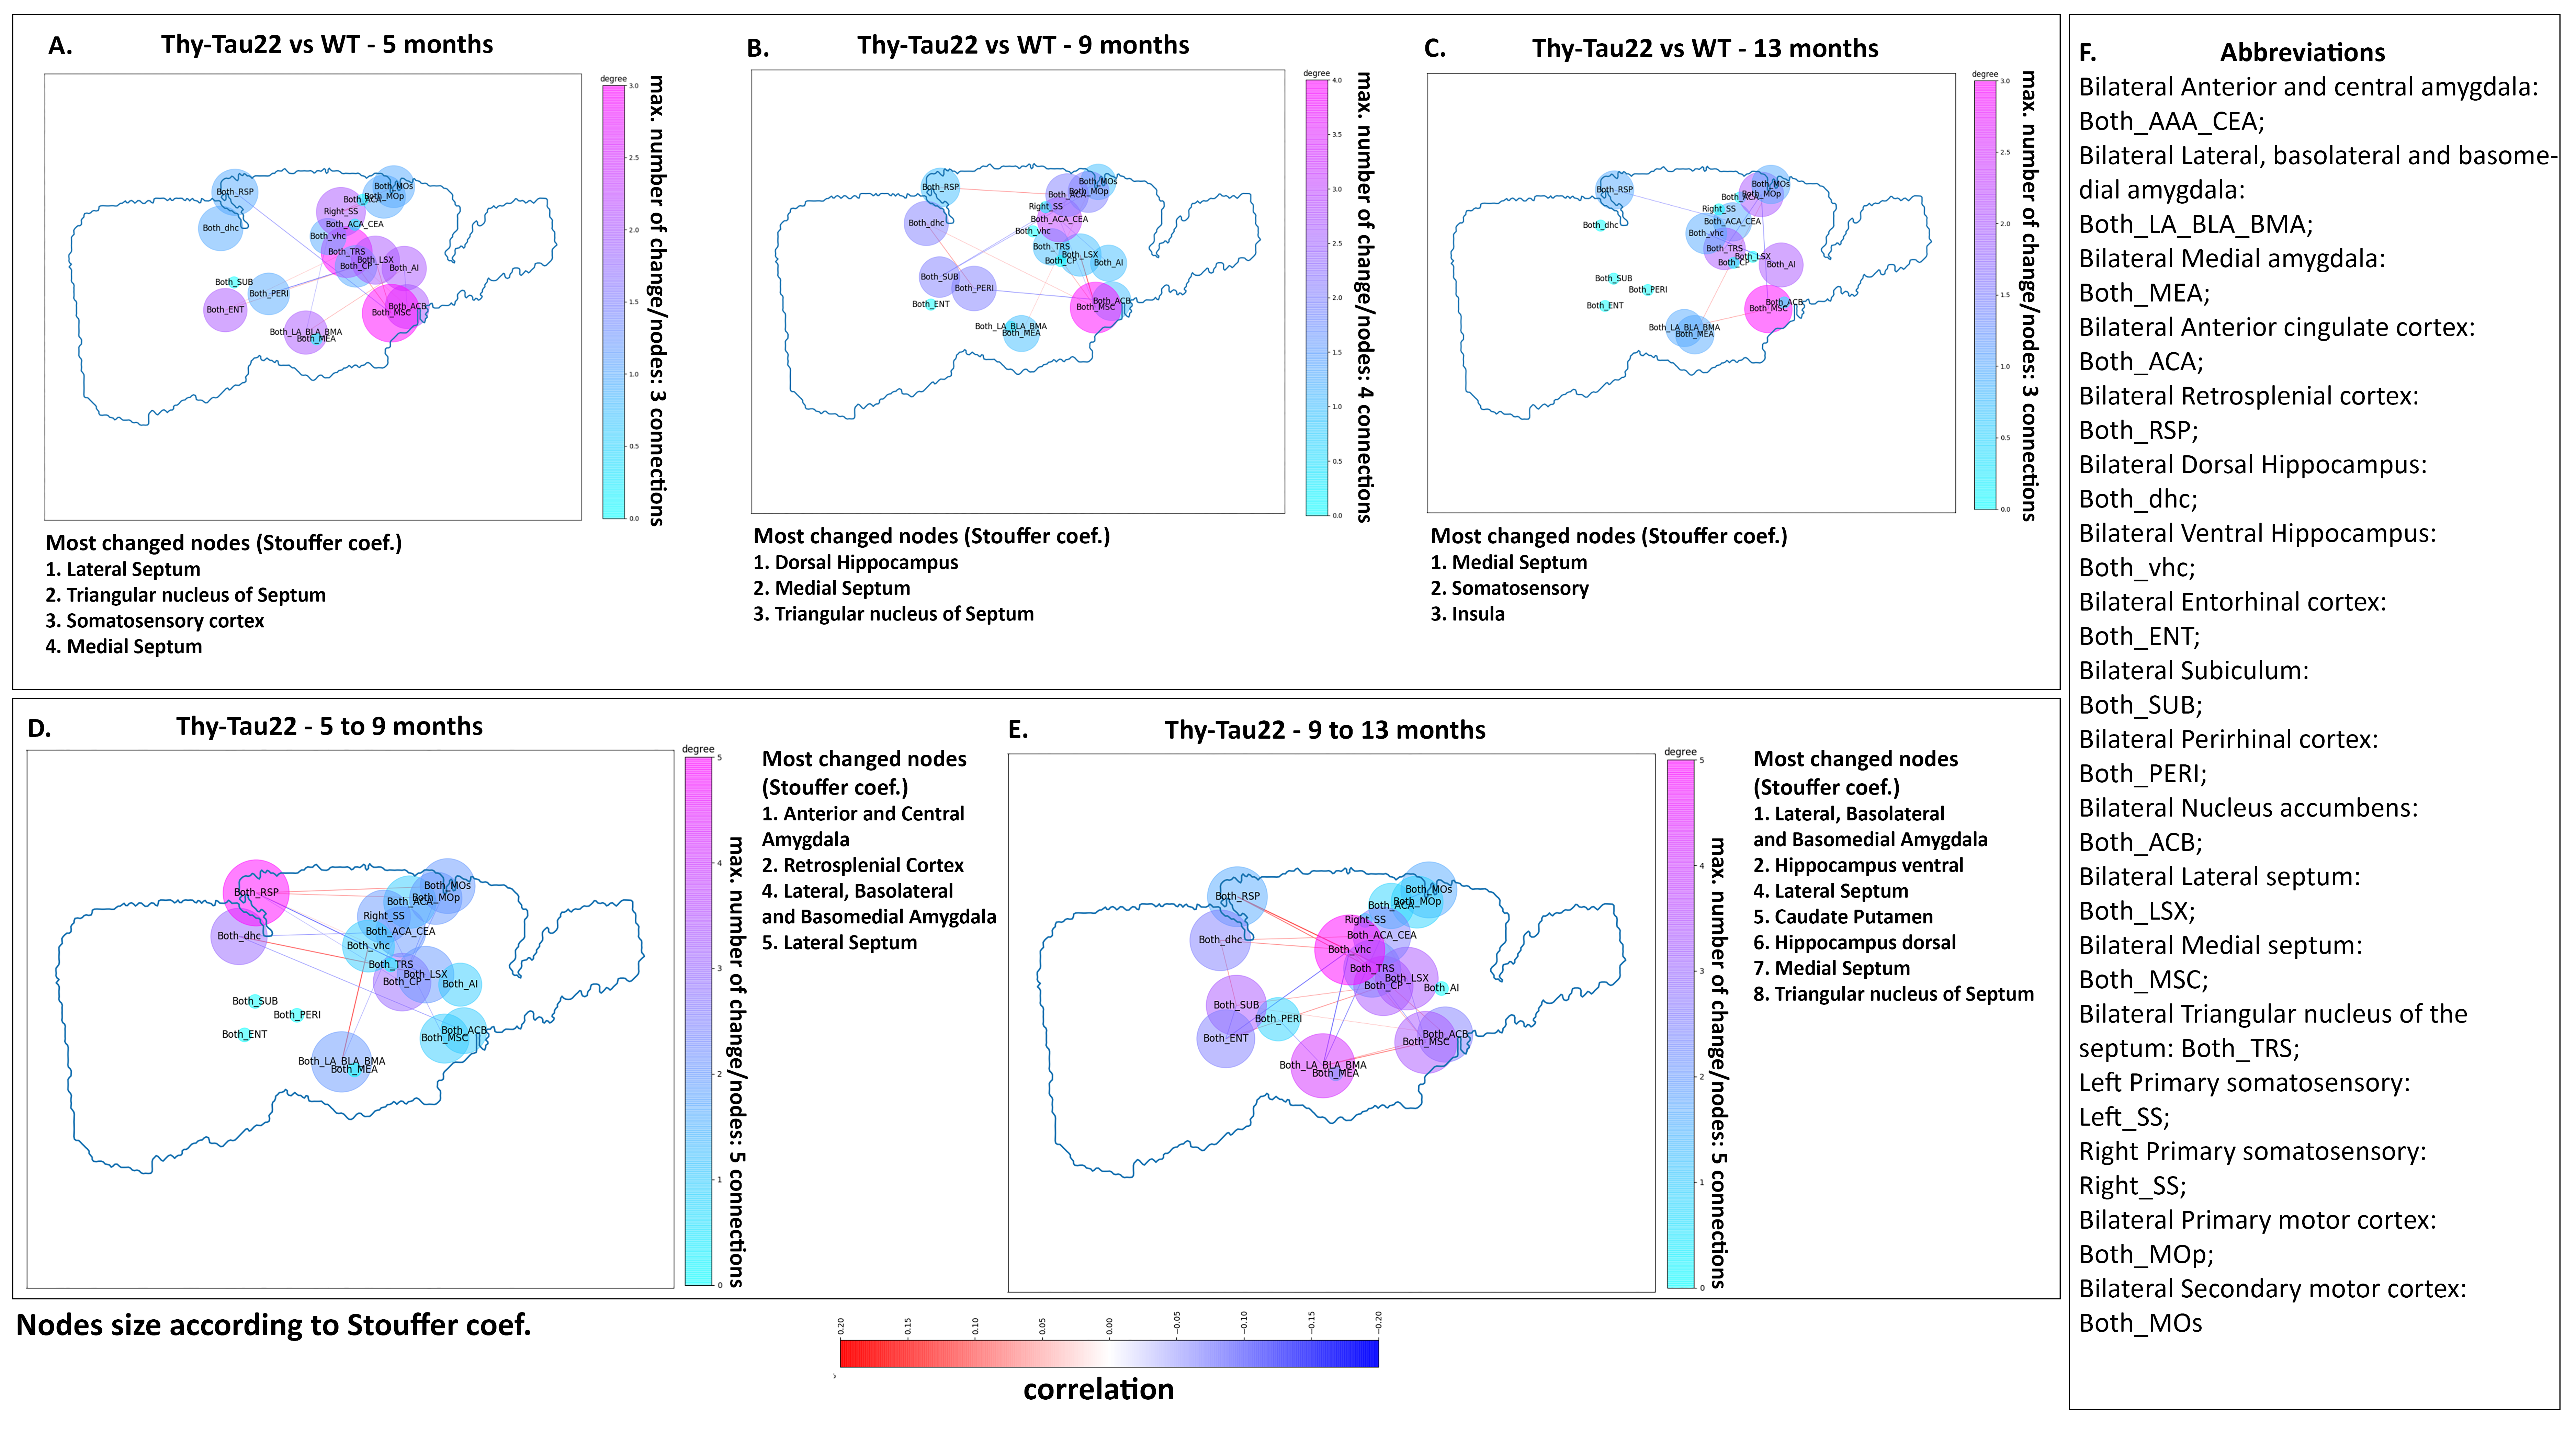
After behavioral evaluation, brain MRI was carried-out in mice using a 7T small bore animal scanner (BioSpec 70/30, Bruker, Germany) and a dedicaded, room-temperature, mouse head surface coil. RsfMRI data were acquired using single shot GE-EPI (TE/TR = 15ms/2000ms, 27 axial slices of 0.4mm thickness, FOV: 2.12x2 cm², resolution: 0.14×0.22mm2, 500 volumes). DTI data were acquired using a DTI-EPI sequence (30 directions, 2 b-values, resolution: 0.1x0.1x0.5mm3). Scans were realised under medetomidine (MD) sedation (subcutaneous bolus of 0.6mg MD/kg body weight followed by s.c. infusion of 0.3mg MD/kg-BW/hour) for rsfMRI acquisitions, and under isoflurane for DTI acquisitions. Data pre-processing was performed using SPM 8 for motion correction, coregistration to a study-specific template and spatial normalization to the Allen Mouse Brain Atlas7. For rsfMRI data, a spatial smoothing of 2 voxels, a frequency filtering (0.01 to 0.1Hz) and a regression of ventricles signal were applied. To perform structural analysis, a global tracking8 of DTI data in association with statistical analysis of DTI maps were realized. Functional connectivity changes were evaluated by generating group comparison matrix of 20 region of interests (ROI) that were represented as graphs. Several comparisons between time-points and between groups were performed revealing the most changed nodes using Stouffer’s method9, modifications in degrees, and most changed edges. Longitudinal seed-based analysis was further performed using a full factorial approach to statistically compare functional networks of selected ROI between groups and timepoints.
Results and Discussion
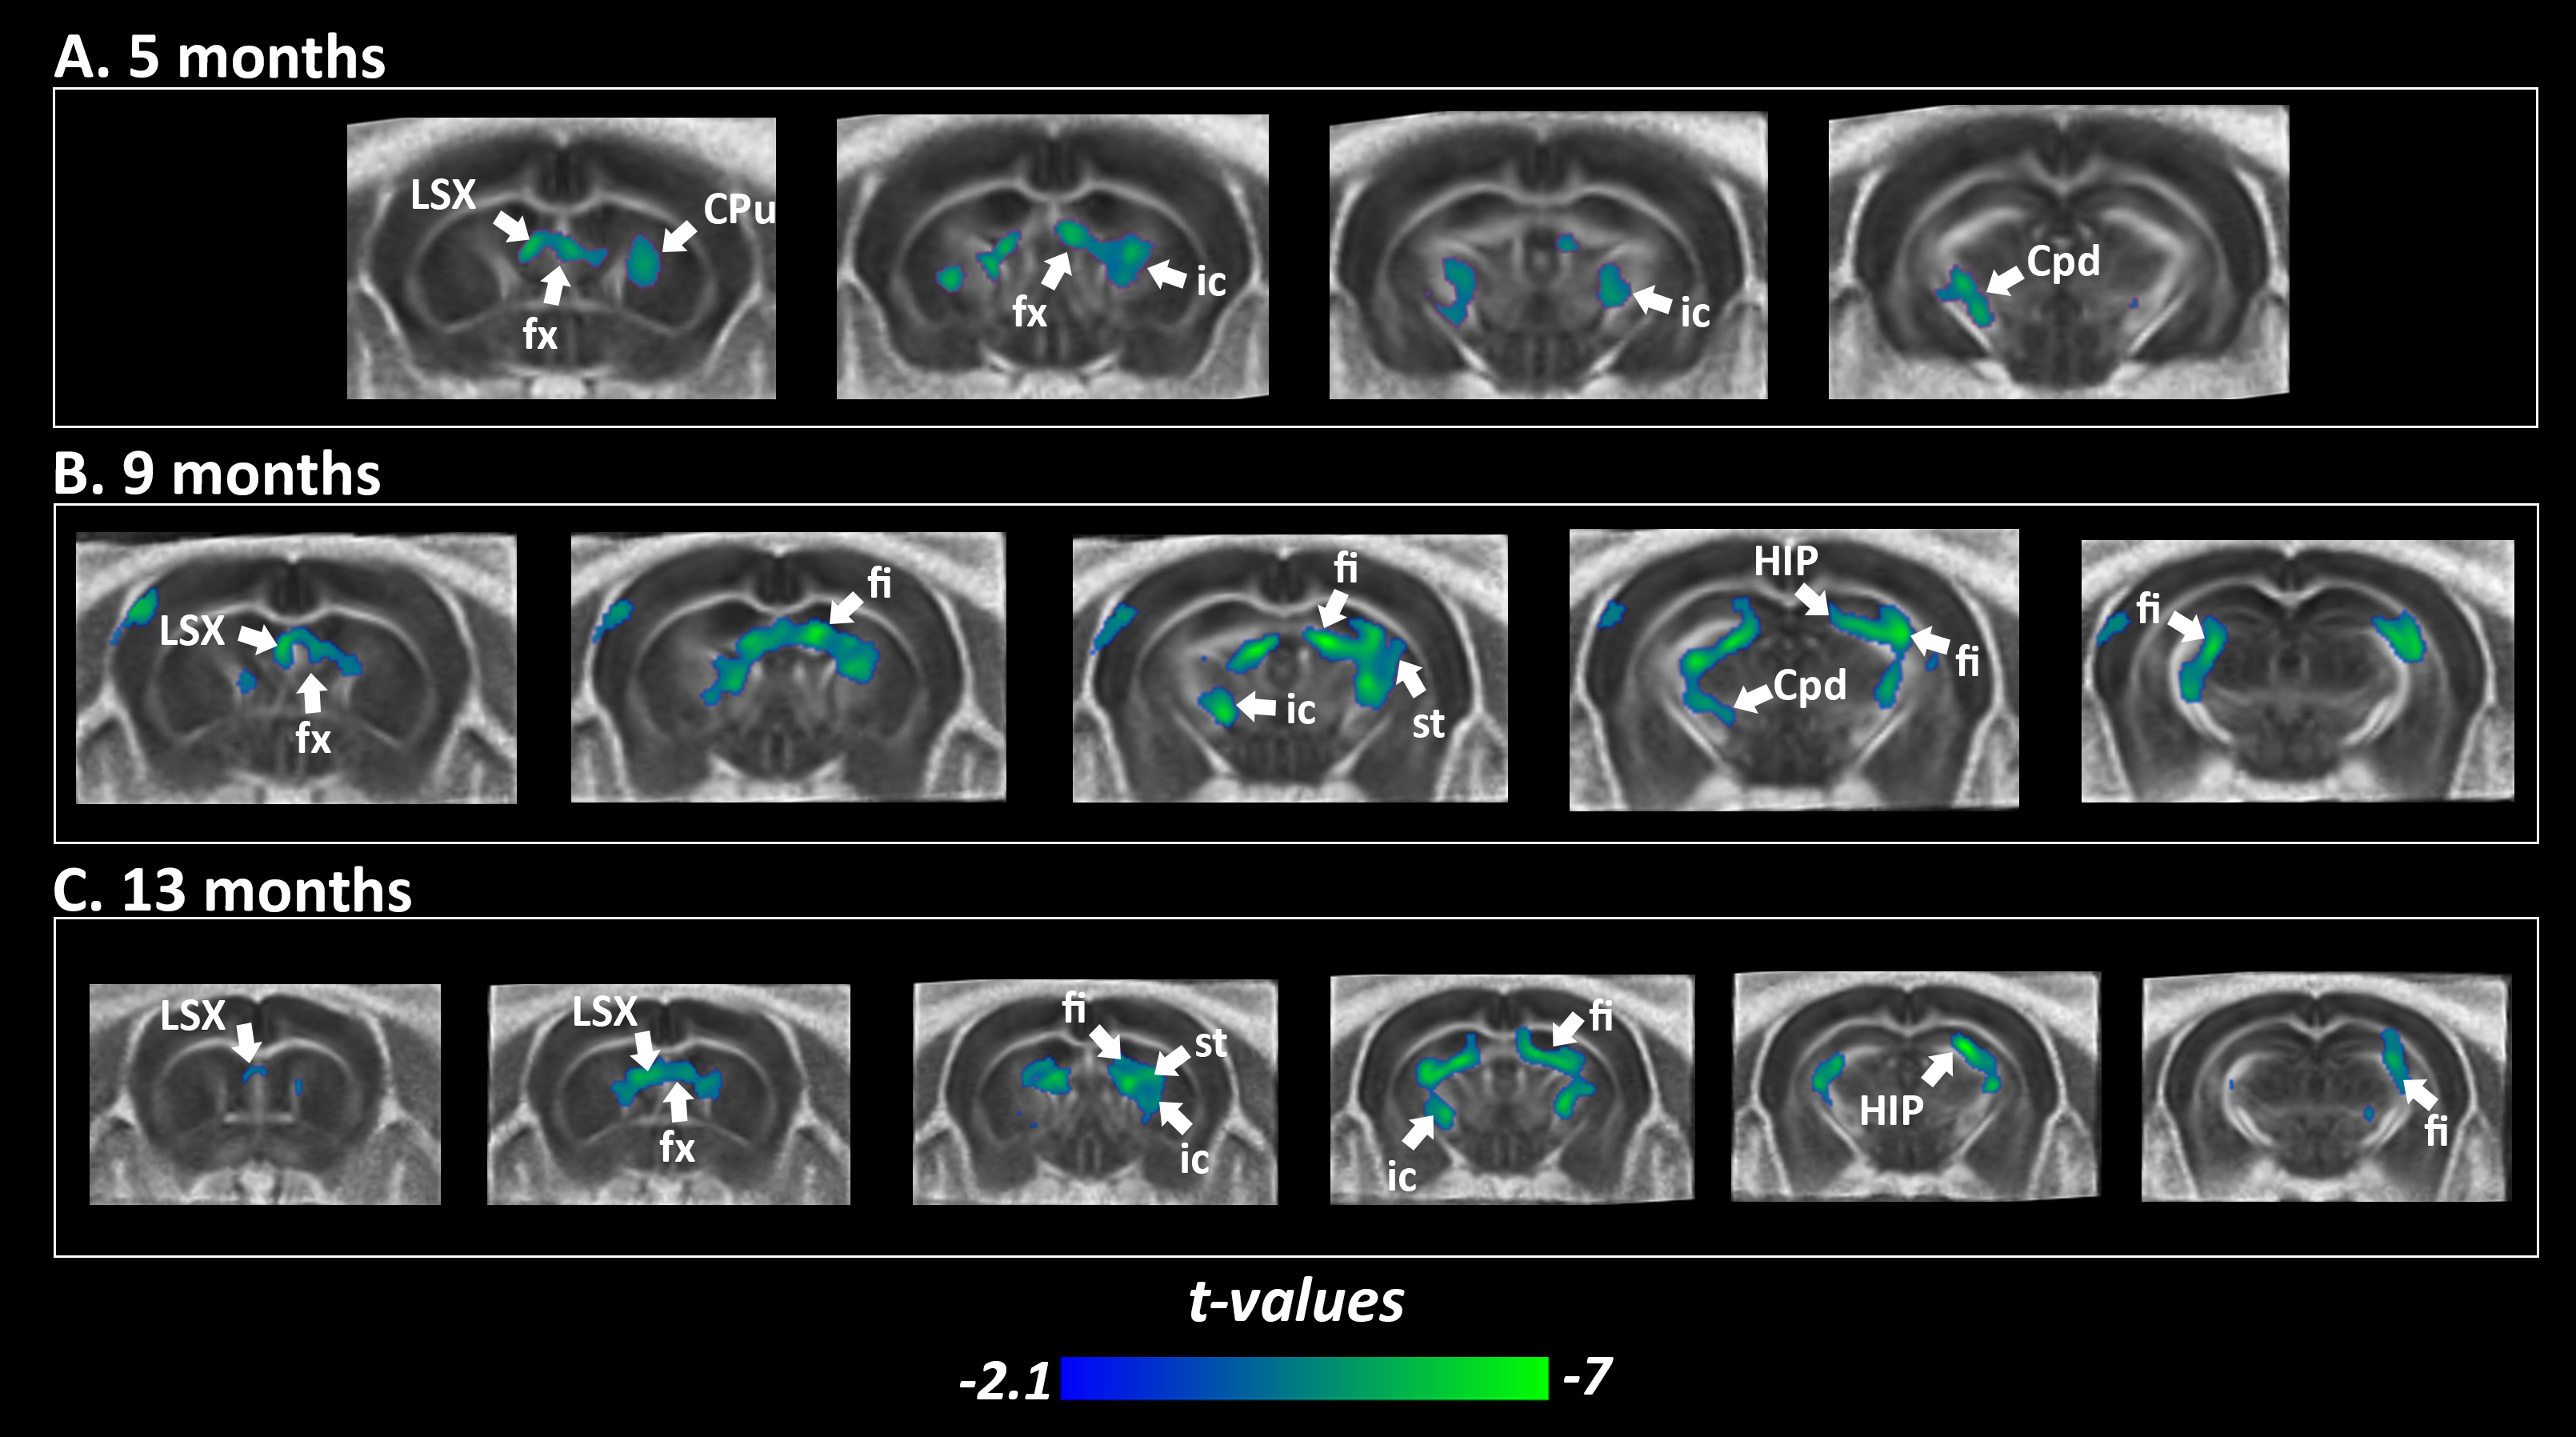
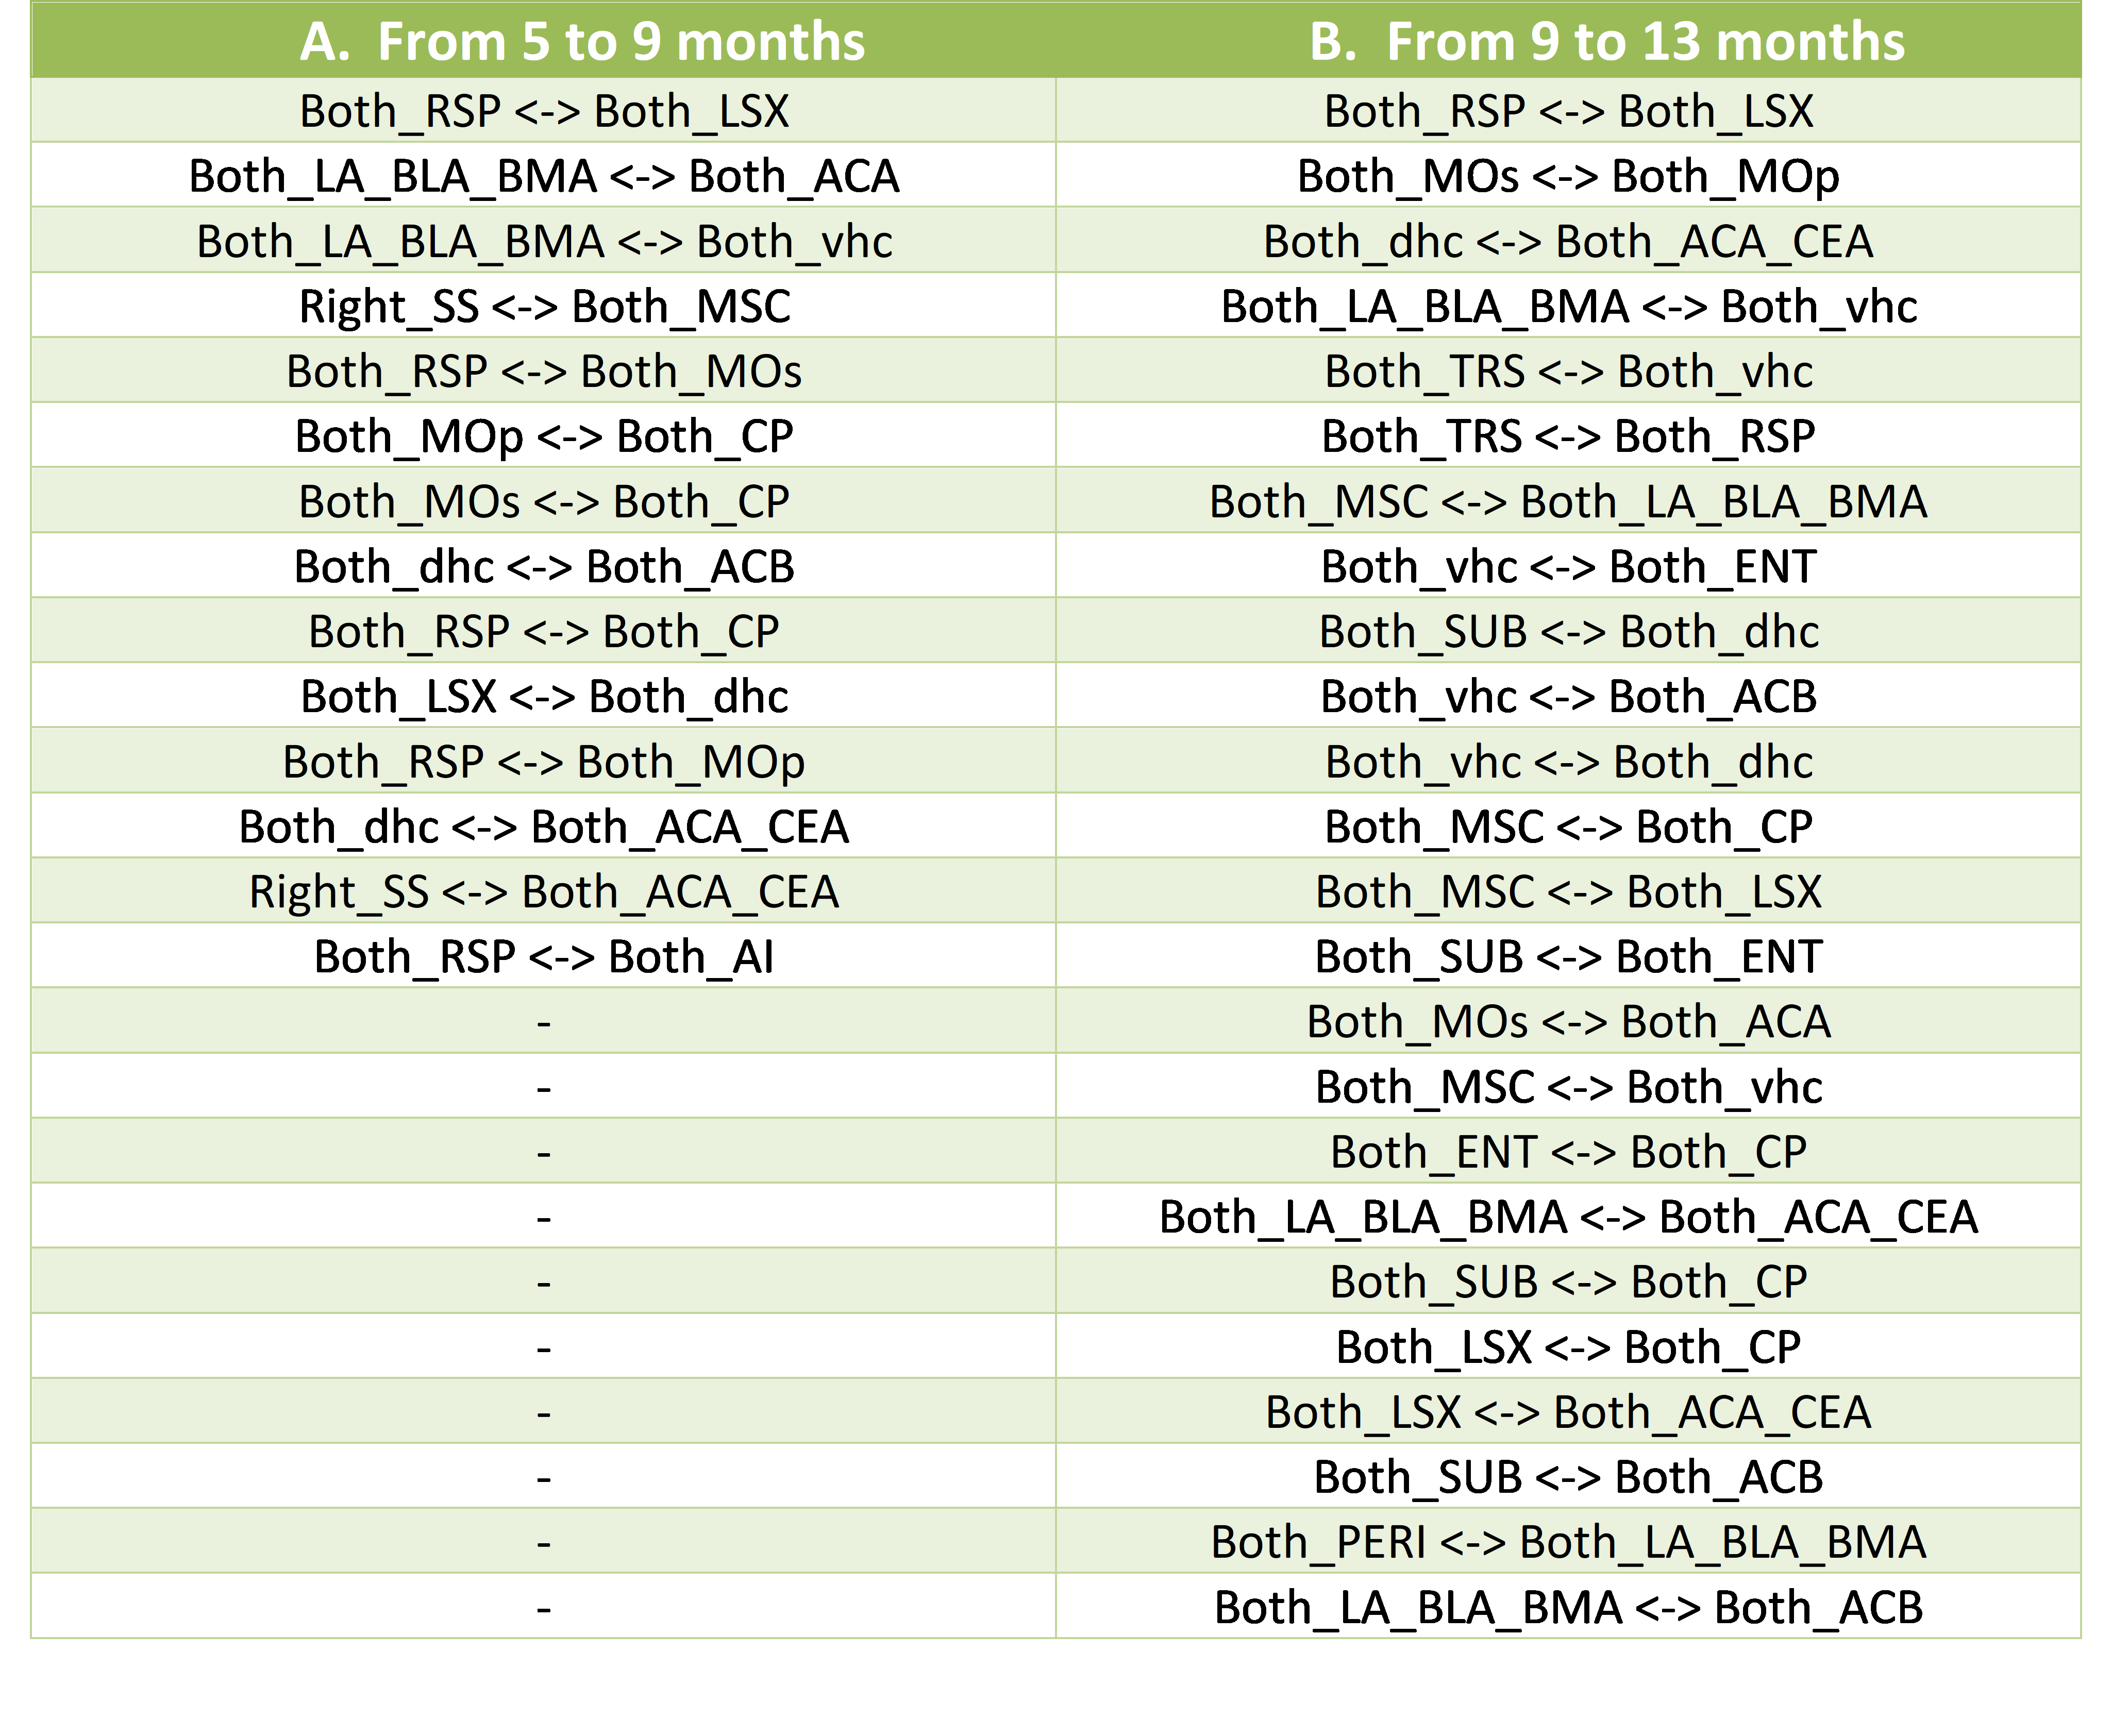
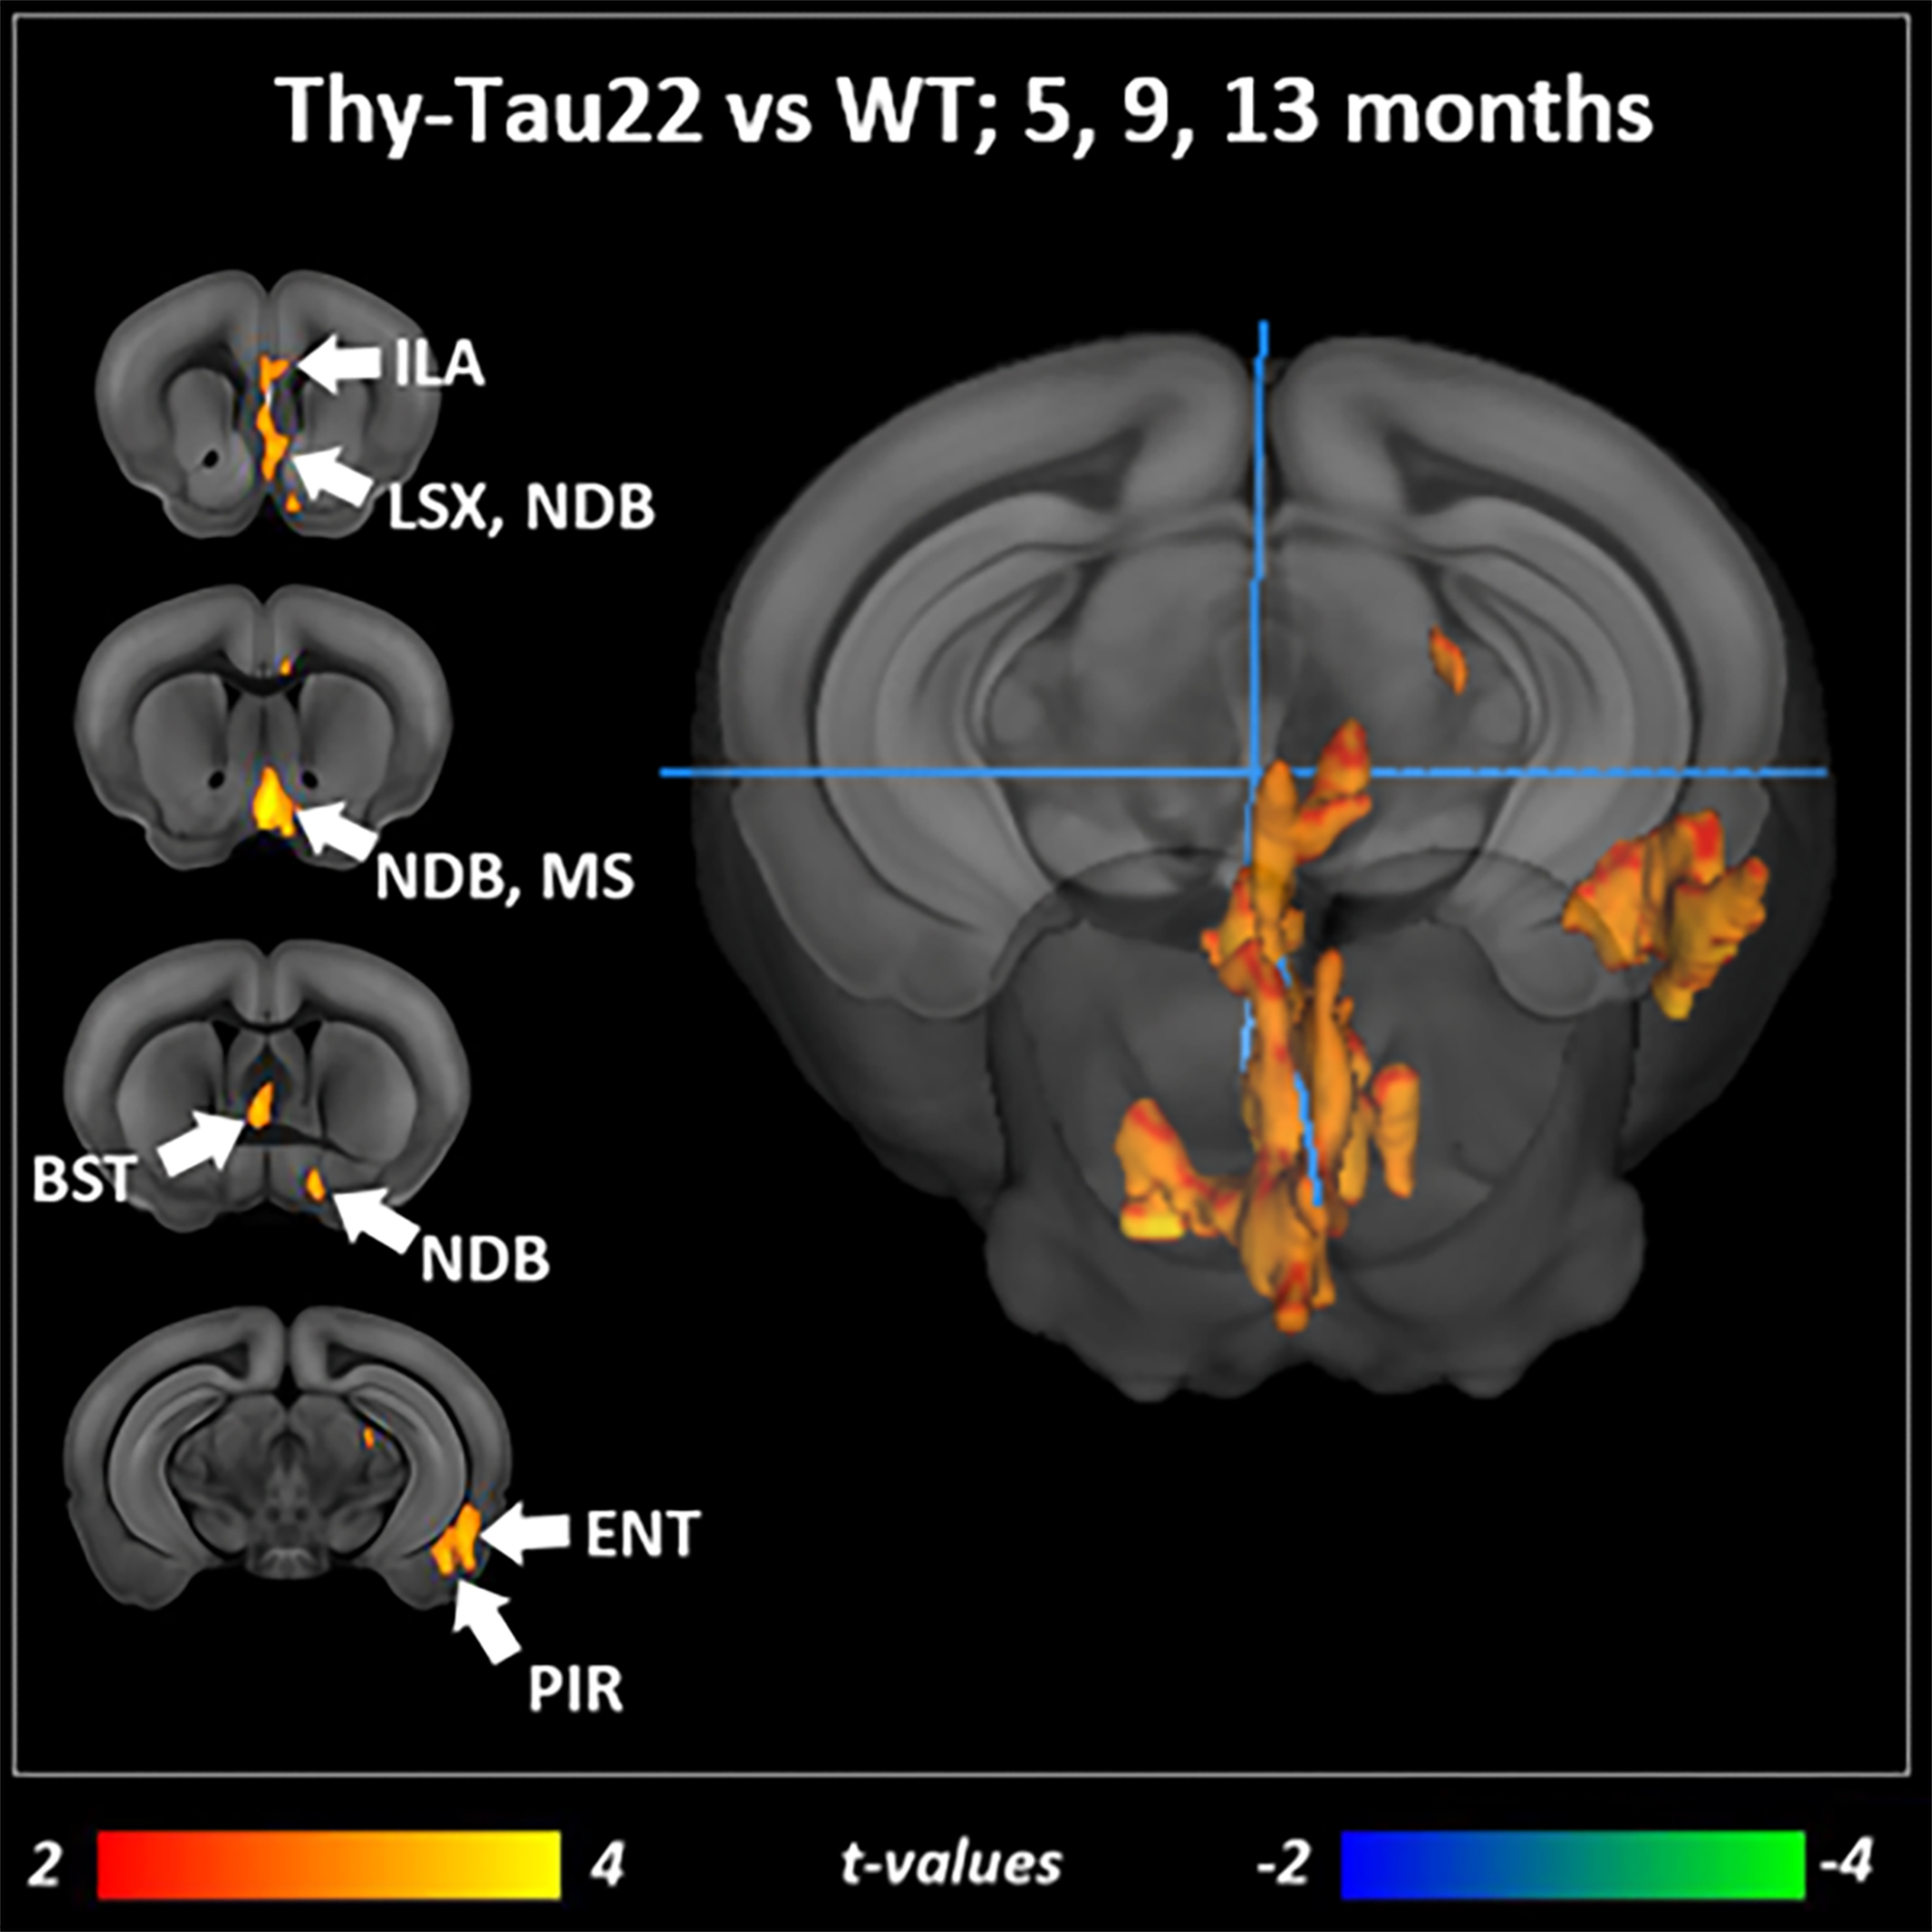
Transgenic mice started to underperformed at behavioral tests from 9 months, worsening at 13 months (Fig.1, A, B), reflecting progressive memory alteration. Although no memory deficits were detected at 5 months, DTI analysis showed a significant decrease of fractional anisotropy values in Thy-Tau22 from this age, and at all stages of the pathology, compared to WT (Fig.2 A, B, C). Particularly, two cholinergic tracts involving the septum connectivity were found increasingly altered over time: the fornix/fimbria, involved in the septo-hippocampal communication and associated with memory processes10, and the stria terminalis connecting the amygdala to the septum, sustaining emotional behavior11. Functional connectivity changes between groups using graph theory analysis highlighted septal areas as vulnerable nodes at all time point (Fig. 3 A, B, C). These same nodes, in addition to the retrosplenial cortex, the hippocampus, and the amygdala, showed significant alterations over time in the AD model (Fig. 3, D, E). Moreover, we highlighted an altered functional connectivity between the septum and the retrosplenial cortex, detected as the most changed edge over time in Thy-Tau22 (Fig. 4). As the septum appeared to be early and longitudinally affected in Thy-Tau22 mice in both structural and graph theory analysis, we further explored the temporal evolution of this area’s functional network between groups, (Fig. 5) and revealed a global dysfunction of the whole septal functional system in transgenic mice.The septal cholinergic pathways thus emerged as a crucial circuitry taking part in the brain network maladaptations prompted by Tau pathology, possibly bringing out behavioral signatures of AD pathology such as memory impairment. We showed persistent and progressive alterations of the septal connectivity towards three main brain complexes involving: memory areas; the amygdala, the integrative center for emotions; and the retrosplenial cortex, core area of the rodent default mode network (DMN) - all known to be affected in AD patients12–15. Septal connectivity with these key areas place this region at the intersection between limbic and DMN networks, possibly modulating their interactions along the installment of the pathology. Our results are strongly coherent with human findings, and the dysfunctions highlighted represent a strong lead toward the discovery of a potential biomarker of the disease or as a target for future treatment’s investigations that could be further explored in Human.
Acknowledgements
No acknowledgement found.References
1. Guo, T., Noble, W. & Hanger, D. P. Roles of tau protein in health and disease. Acta Neuropathol. (Berl.) 133, 665–704 (2017).
2. Sporns, O. Graph theory methods: applications in brain networks. Dialogues Clin. Neurosci. 20, 111–121 (2018).
3. Schindowski, K. et al. Alzheimer’s Disease-Like Tau Neuropathology Leads to Memory Deficits and Loss of Functional Synapses in a Novel Mutated Tau Transgenic Mouse without Any Motor Deficits. Am. J. Pathol. 169, 599–616 (2006).
4. D’Hooge, R. & De Deyn, P. P. Applications of the Morris water maze in the study of learning and memory. Brain Res. Rev. 36, 60–90 (2001).
5. Dere, E., Huston, J. P. & De Souza Silva, M. A. The pharmacology, neuroanatomy and neurogenetics of one-trial object recognition in rodents. Neurosci. Biobehav. Rev. 31, 673–704 (2007).
6. Lee, I. & Solivan, F. The roles of the medial prefrontal cortex and hippocampus in a spatial paired-association task. Learn. Mem. 15, 357–367 (2008).
7. Arefin, T. M. et al. Remodeling of Sensorimotor Brain Connectivity in Gpr88 -Deficient Mice. Brain Connect. 7, 526–540 (2017).
8. Harsan, L.-A. et al. Mapping remodeling of thalamocortical projections in the living reeler mouse brain by diffusion tractography. Proc. Natl. Acad. Sci. 110, E1797–E1806 (2013).
9. STOUFFER,
SAMUEL A., EDWARD A. SUCHMAN, LELAND C. DEVINNEY, SHIRLEY A. STAR, and ROBIN M.
WILLIAMS, JR. The American Soldier: Adjustment During Army Life. Vol. I. Pp.
xii, 599. STOUFFER, SAMUEL A., ARTHUR A. LUMSDAINE, MARION HARPER LUMSDAINE,
ROBIN M. WILLIAMS, JR., M. BREWSTER SMITH, IRVING L. JANIS, SHIRLEY A. STAR,
and LEONARD S. COTTRELL, JR. The American Soldier: Combat and Its Aftermath.
Vol. II. Pp. 675. Princeton: Princeton University Press, Studies in Social
Psychology in World War II, 1949.- Alfred McClung Lee, 1949. https://journals.sagepub.com/doi/abs/10.1177/000271624926500124.
10. Dutar, P., Bassant, M. H., Senut, M. C. & Lamour, Y. The septohippocampal pathway: structure and function of a central cholinergic system. Physiol. Rev. 75, 393–427 (1995).
11. Rajmohan, V. & Mohandas, E. The limbic system. Indian J. Psychiatry 49, 132–139 (2007).
12. Greicius, M. D., Srivastava, G., Reiss, A. L. & Menon, V. Default-mode network activity distinguishes Alzheimer’s disease from healthy aging: evidence from functional MRI. Proc. Natl. Acad. Sci. U. S. A. 101, 4637–4642 (2004).
13. Kantarci, K. et al. White Matter Integrity on DTI and the Pathologic Staging of Alzheimer’s Disease. Neurobiol. Aging 56, 172–179 (2017).
14. Li, X. et al. Impaired White Matter Connections of the Limbic System Networks Associated with Impaired Emotional Memory in Alzheimer’s Disease. Front. Aging Neurosci. 8, 250 (2016).
15. Chiesa, P. A. et al. A functional resting state study of basal forebrain functional connectivity in asymptomatic at-risk individuals for AD: the insight-pread study. Alzheimers Dement. J. Alzheimers Assoc. 13, P790 (2017).
Figures