1935
Functioning of the glucose transporter and glymphatic systems in the tauopathy AD mouse brain studied by onVDMP MRI and D-glucose infusion1Department of Radiology and Radiological Science, The Johns Hopkins University School of Medicine, Baltimore, MD, United States, 2F.M. Kirby Research Center for Functional Brain Imaging, Kennedy Krieger Research Institute, Baltimore, MD, United States, 3Department of Biomedical Engineering, City University of Hong Kong, Hong Kong, China, 4City University of Hong Kong, Hong Kong, China, 5Department of Pathology, The Johns Hopkins University School of Medicine, Baltimore, MD, United States, 6Department of Neuroscience, Johns Hopkins University School of Medicine, Baltimore, MD, United States
Synopsis
In this study, we used onVDMP MRI to detect glucose uptake in tauopathy Alzheimer's disease (AD) mouse brain. Compared to wild-type mice, significantly reduced glucose uptake was observed in both cerebrospinal fluid (CSF) and parenchyma of AD mouse brain. Clearance of glucose through CSF was found in wild-type mice, but not in AD mice, which implicates dysfunction of the glymphatic system in AD mouse brain. The results in this study suggest that onVDMP MRI could be a cost-effective and widely available method for evaluating the functions of glucose transporter and glymphatic system, and hence diagnosing AD.
Introduction
Glucose hypometabolism has been hypothesized to be an upstream event of AD that can be used for its early diagnosis (1-4). Currently, glucose uptake can be assessed using 2-[18F]fluoro-2-deoxy-D-glucose positron emission tomography (FDG-PET) (5) and in vivo magnetic resonance spectroscopy (MRS) (6,7). However, the limited availability of FDG-PET and low sensitivity of MRS hamper their widespread clinical application. Glucose chemical exchange saturation transfer (glucoCEST) MRI is a recently developed technique (8,9) that can detect unlabeled glucose at physiologically relevant concentrations using standard MRI scanners. Among various glucoCEST methods, on-resonance variable delay multiple pulse (onVDMP) MRI is promising due to its excellent labeling efficiency and sensitivity (10-12). In this study, we applied onVDMP MRI in a AD mice with tauopathy and to examine the impact of tau protein on the glucose uptake in parenchyma and CSF (glymphatic function) in brain.Methods
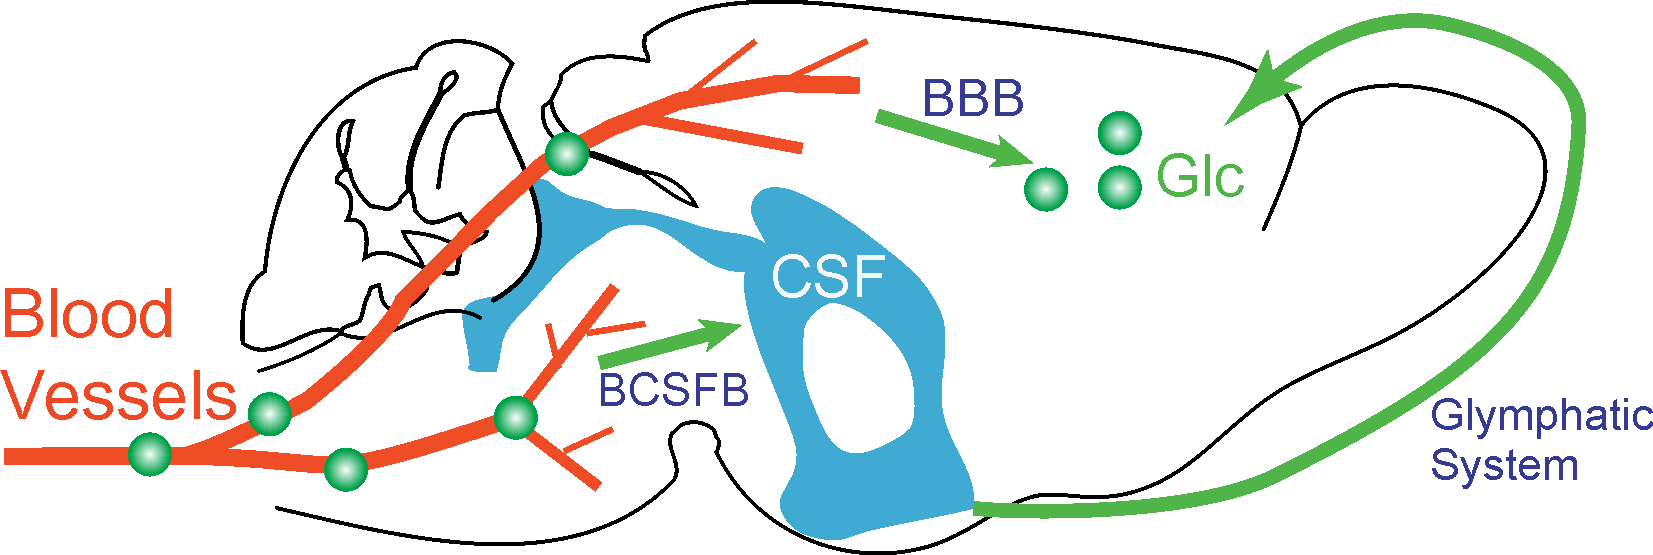
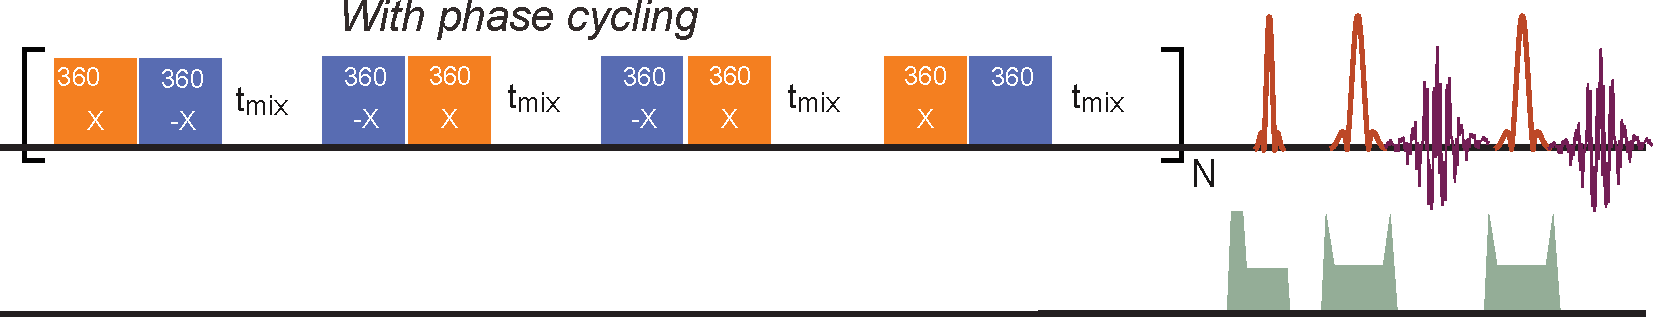
The glucose transport pathways in mouse brain are illustrated in Fig. 1. The animal study was carried out under the approval of local ACUC. Four Tau4RDK (Tau) mice (13) with an age of 7-8 months and four age-matched C57BL/6J mice were used for the AD study. MRI experiments were performed on a horizontal bore 11.7 T Bruker Biospec system. The onVDMP sequence with phase cycling scheme is shown in Fig. 2. Two independent onVDMP sequences with different saturation-module lengths (i.e. 36 ms and 300 ms) were repeated in an interleaved fashion to detect the glucose uptake in brain parenchyma and CSF, respectively. The dynamic glucose enhanced (DGE) images were acquired continuously for 27.5 min. A bolus of 0.15mL 50% w/w glucose was given at 10th min of the dynamic experiment through the tail vein. Dynamic in vivo MRS spectroscopy was performed to validate the change in glucose concentration in brain tissue after glucose infusion.Area-under-curve (AUC) was utilized to reflects glucose uptake and retention(14), and the following equations were used to fit the amplitude and lifetime of glucose uptake for MRS and DGE images, respectively:
$$\triangle DGE(t) = A_{DGE}(1-e^{-t/T_{u,DGE}}) [1]$$
$$[\triangle Glc](t) = A_{MRS}(1-e^{-t/T_{u,MRS}}) [2]$$
where$$$\triangle DGE(t)$$$ and $$$[\triangle Glc](t)$$$ are the signal difference between pre and post-glucose infusion determined by onVDMP and MRS, respectively.$$$T_{u,DGE}$$$ and $$$T_{u,MRS}$$$ are the glucose uptake lifetimes, and $$$A_{DGE}$$$ and $$$ A_{MRS}$$$ refer to the amplitudes of glucose uptake. The half-life time of glucose uptake was calculated by:$$$T_{half}=T_{u}\times0.6931$$$.
Results and Discussion
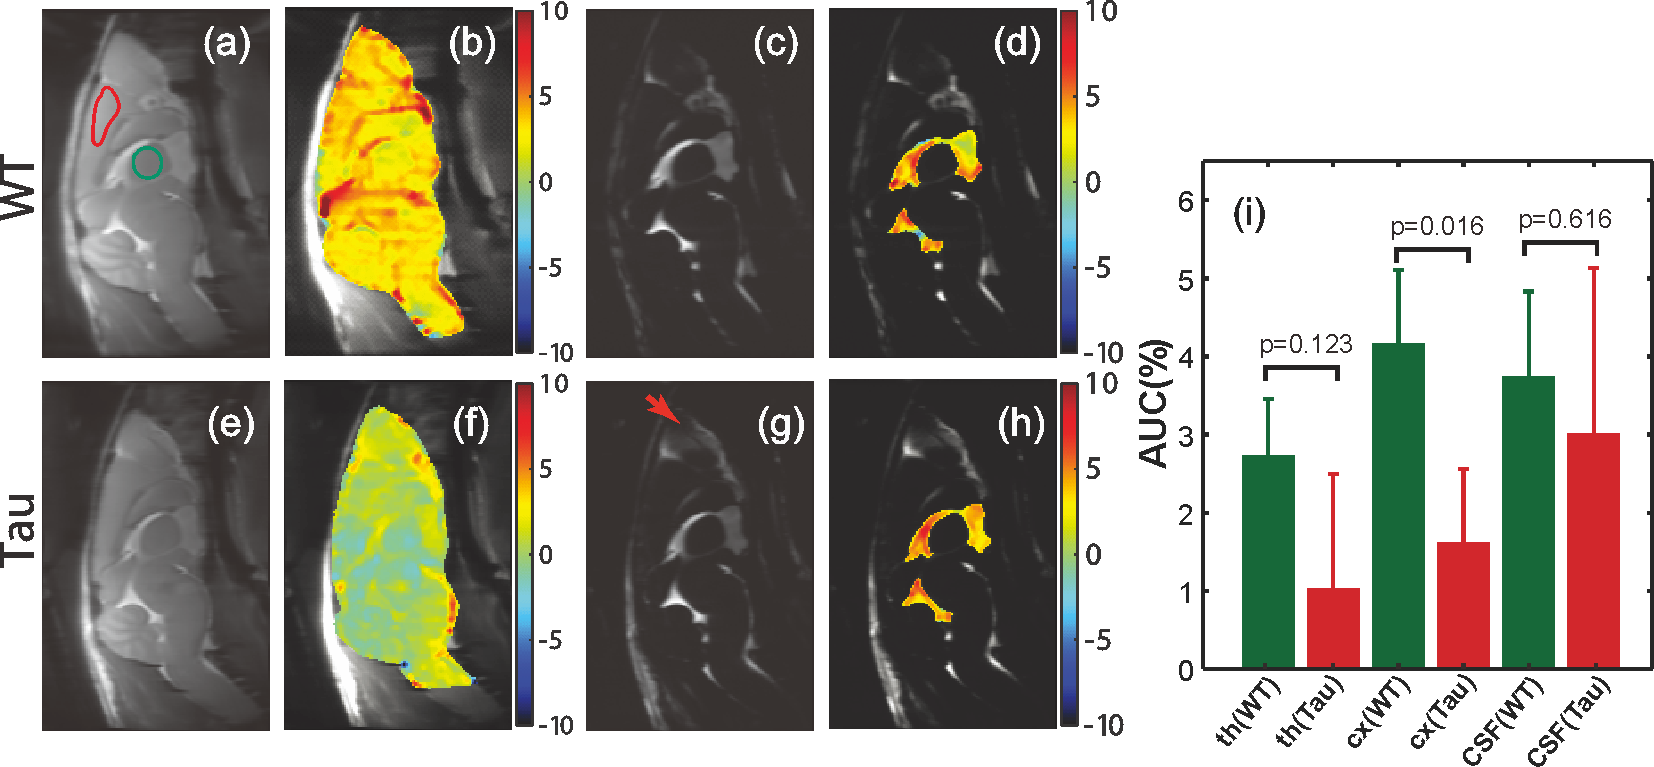
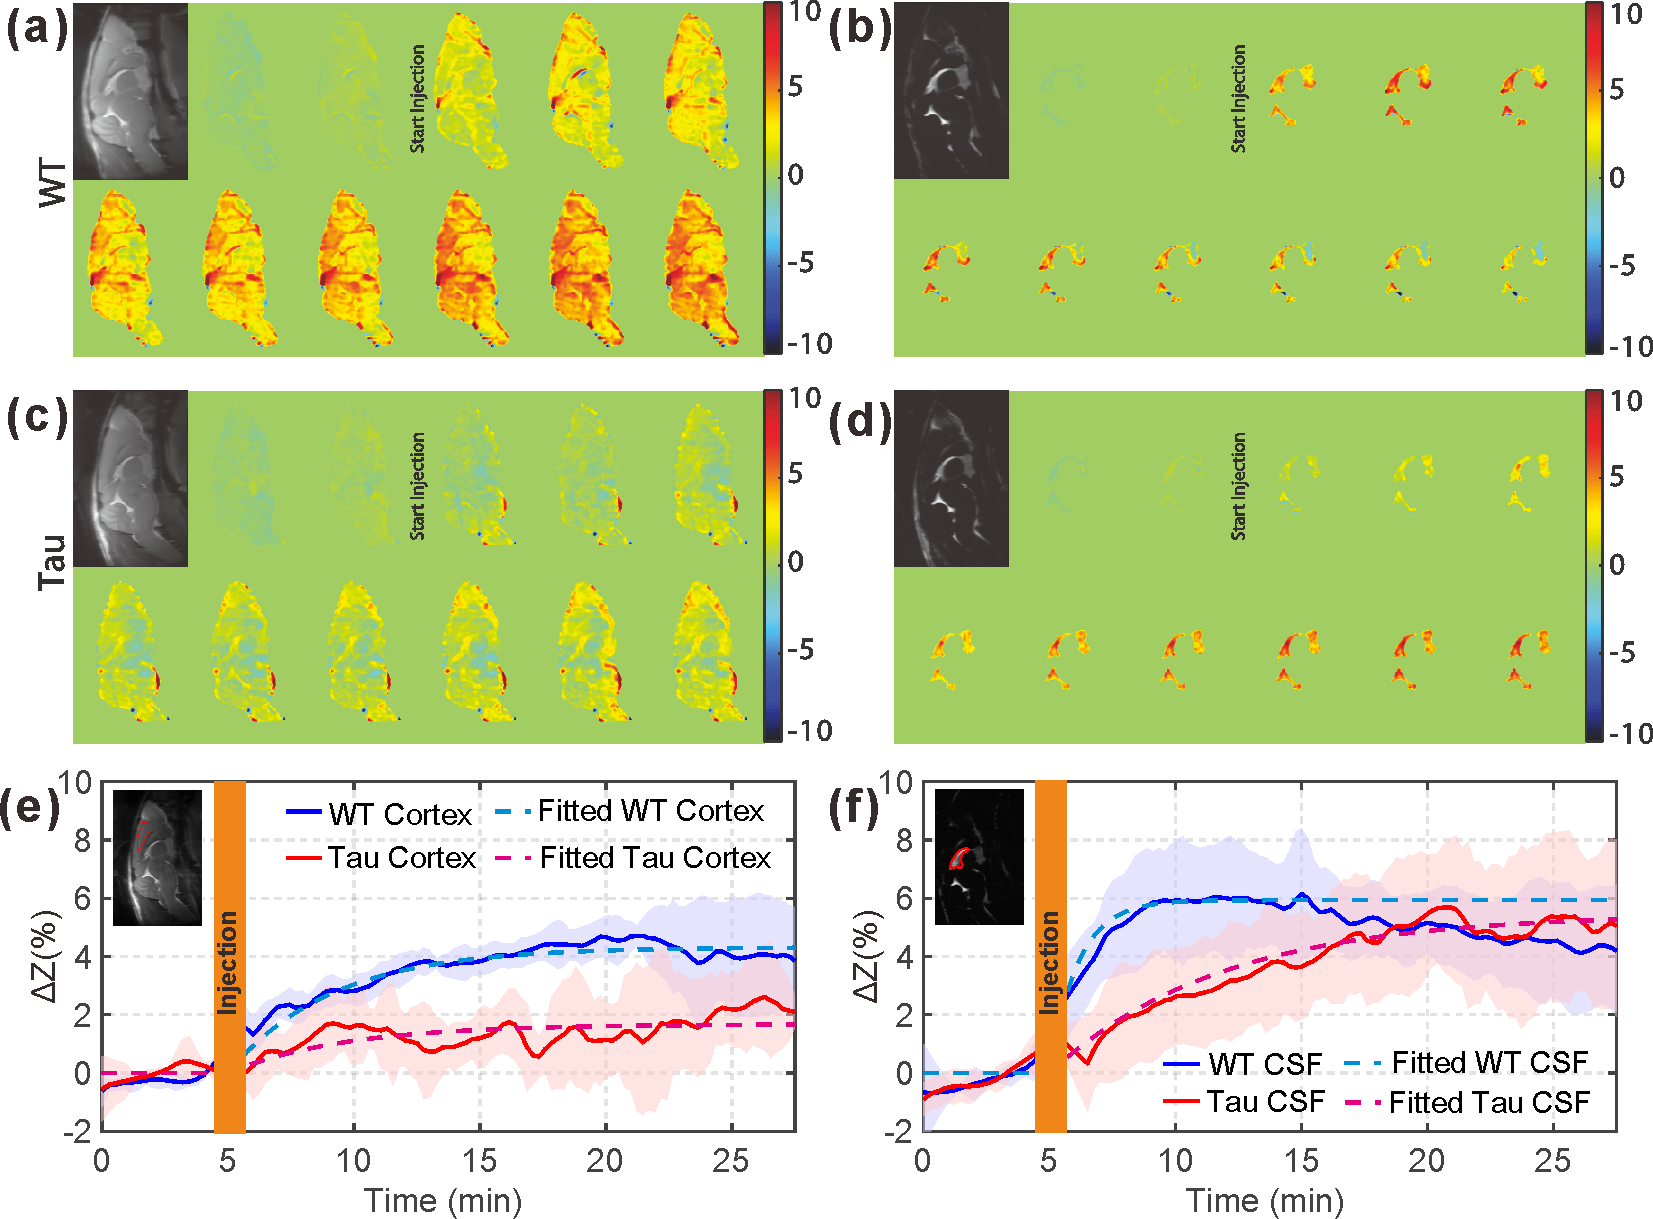
From the AUC maps of parenchyma in Figs. 3b&f, Tau mice exhibited overall lower AUC intensity compared to the WT counterpart. The average AUC value of a cortical region (cx) for Tau mice (1.6±1.3%) was significantly reduced compared to the same region in WT mice (4.3±1.3%, p = 0.016, N = 4). This is consistent with the observation by others that the glucose uptake is impaired in AD brain due to the reductions of both GLUT1 and GLUT3 expression at the BBB (15).The dynamic AUC maps were utilized to monitor the glucose uptake in brain, as shown in Fig. 4. By fitting the dynamic AUC maps using Eq. 1, the half-life time of WT parenchyma was 4.71±1.03min, which is not significantly different from that of Tau mice (5.14±0.30min, p = 0.511). The DGE signal of WT CSF built up quickly after glucose infusion and plateaued around 10 min. The half-life time for WT CSF was min. The DGE signal of CSF in tau mice kept increasing after glucose infusion and reached a plateau around 25 min with a half-life time of min, which is significantly longer than WT counterpart (p < 0.001). The buildup process of the DGE curve for CSF is again related to the glucose transport at the blood-cerebrospinal fluid barrier (BCSFB). The slower glucose uptake in AD mouse brain could be an impaired glucose transporter at the BCSFB, but that would need to be verified independently. Interestingly, after reaching a plateau, the DGE signal of WT CSF began to decay, as shown in both dynamic AUC maps and DGE curves in Fig. 4. However, this phenomenon was not observed in CSF of the tau mice. From previous studies, glucose can alternatively be redistributed to brain parenchyma through a CSF and interstitial fluid (ISF) exchanging process, i.e. the glymphatic pathway, (16,17) and the glymphatic pathway of AD brain has been reported to be dysfunctional (18). This may explain the decay of WT CSF glucose reaching a maximum around 15 minutes, while the DGE signal of Tau CSF kept increasing.
From Fig. 5, similar glucose uptake patterns and consistent glucose uptake half-life times (MRS:4.16±0.69min; onVDMP: 4.71±1.18min) were observed between the dynamic curves obtained by in vivo MRS and onVDMP, which validates that the signal change obtained by onVDMP is dominated by the glucose concentration.
Conclusion
The results in this study suggest that onVDMP MRI can be used for evaluating the functions of glucose transporter and glymphatic system, which may have potential for diagnosing AD.Acknowledgements
Funding Support: NIH: R01EB019934, R03NS109664, and DOD W81XWH-18-1-0797.References
1.Langbaum JB, Chen K, Lee W, Reschke C, Bandy D, Fleisher AS, Alexander GE, Foster NL, Weiner MW, Koeppe RA, Jagust WJ, Reiman EM, Alzheimer's Disease Neuroimaging I. Categorical and correlational analyses of baseline fluorodeoxyglucose positron emission tomography images from the Alzheimer's Disease Neuroimaging Initiative (ADNI). Neuroimage 2009;45(4):1107-1116.
2. Reiman EM, Caselli RJ, Yun LS, Chen K, Bandy D, Minoshima S, Thibodeau SN, Osborne D. Preclinical evidence of Alzheimer's disease in persons homozygous for the epsilon 4 allele for apolipoprotein E. N Engl J Med 1996;334(12):752-758.
3. Hoyer S, Nitsch R, Oesterreich K. Predominant abnormality in cerebral glucose utilization in late-onset dementia of the Alzheimer type: a cross-sectional comparison against advanced late-onset and incipient early-onset cases. J Neural Transm Park Dis Dement Sect 1991;3(1):1-14.
4. Fukuyama H, Ogawa M, Yamauchi H, Yamaguchi S, Kimura J, Yonekura Y, Konishi J. Altered cerebral energy metabolism in Alzheimer's disease: a PET study. J Nucl Med 1994;35(1):1-6.
5. Kato T, Inui Y, Nakamura A, Ito K. Brain fluorodeoxyglucose (FDG) PET in dementia. Ageing research reviews 2016;30:73-84.
6. van Zijl PC, Chesnick AS, DesPres D, Moonen CT, Ruiz-Cabello J, van Gelderen P. In vivo proton spectroscopy and spectroscopic imaging of [1-13C]-glucose and its metabolic products. Magn Reson Med 1993;30(5):544-551.
7. Xin L, Lanz B, Lei H, Gruetter R. Assessment of metabolic fluxes in the mouse brain in vivo using 1H-[13C] NMR spectroscopy at 14.1 Tesla. J Cereb Blood Flow Metab 2015;35(5):759-765.
8. Chan KW, McMahon MT, Kato Y, Liu G, Bulte JW, Bhujwalla ZM, Artemov D, Van Zijl PC. Natural D‐glucose as a biodegradable MRI contrast agent for detecting cancer. Magn Reson Med 2012;68(6):1764-1773.
9. Walker-Samuel S, Ramasawmy R, Torrealdea F, Rega M, Rajkumar V, Johnson SP, Richardson S, Gonçalves M, Parkes HG, Årstad E. In vivo imaging of glucose uptake and metabolism in tumors. Nat Med 2013;19(8):1067.
10. Xu J, Chan KW, Xu X, Yadav N, Liu G, van Zijl PC. On-resonance variable delay multipulse scheme for imaging of fast-exchanging protons and semisolid macromolecules. Magn Reson Med 2017;77(2):730-739.
11. Wu D, Xu J, Lei J, McLane M, van Zijl PC, Burd I. Dynamic glucose enhanced MRI of the placenta in a mouse model of intrauterine inflammation. Placenta 2018;69:86-91.
12. Xu X, Xu J, Chan KWY, Liu J, Liu H, Li Y, Chen L, Liu G, van Zijl PCM. GlucoCEST imaging with on-resonance variable delay multiple pulse (onVDMP) MRI. Magn Reson Med 2019;81(1):47-56.
13. Li T, Braunstein KE, Zhang J, Lau A, Sibener L, Deeble C, Wong PC. The neuritic plaque facilitates pathological conversion of tau in an Alzheimer's disease mouse model. Nat Commun 2016;7:12082.
14. Xu X, Chan KW, Knutsson L, Artemov D, Xu J, Liu G, Kato Y, Lal B, Laterra J, McMahon MT. Dynamic glucose enhanced (DGE) MRI for combined imaging of blood–brain barrier break down and increased blood volume in brain cancer. Magn Reson Med 2015;74(6):1556-1563.
15. Winkler EA, Nishida Y, Sagare AP, Rege SV, Bell RD, Perlmutter D, Sengillo JD, Hillman S, Kong P, Nelson AR, Sullivan JS, Zhao Z, Meiselman HJ, Wendy RB, Soto J, Abel ED, Makshanoff J, Zuniga E, De Vivo DC, Zlokovic BV. GLUT1 reductions exacerbate Alzheimer's disease vasculo-neuronal dysfunction and degeneration. Nat Neurosci 2015;18(4):521-530.
16. Ma Q, Ineichen BV, Detmar M, Proulx ST. Outflow of cerebrospinal fluid is predominantly through lymphatic vessels and is reduced in aged mice. Nat Commun 2017;8(1):1434.
17. Ahn JH, Cho H, Kim JH, Kim SH, Ham JS, Park I, Suh SH, Hong SP, Song JH, Hong YK, Jeong Y, Park SH, Koh GY. Meningeal lymphatic vessels at the skull base drain cerebrospinal fluid. Nature 2019;572(7767):62-66.
18. Da Mesquita S, Louveau A, Vaccari A, Smirnov I, Cornelison RC, Kingsmore KM, Contarino C, Onengut-Gumuscu S, Farber E, Raper D, Viar KE, Powell RD, Baker W, Dabhi N, Bai R, Cao R, Hu S, Rich SS, Munson JM, Lopes MB, Overall CC, Acton ST, Kipnis J. Functional aspects of meningeal lymphatics in ageing and Alzheimer's disease. Nature 2018;560(7717):185-191.
Figures