1934
Association of white matter deficits with cerebral blood flow in cerebral hypoperfusion mouse model as revealed by in-vivo multi-modal MRI1Centre for Advanced Magnetic Resonance Research, Institute of Biophysics, Chinese Academy of Sciences, Beijing, China, 2State Key Laboratory of Brain and Cognitive Science, Institute of Biophysics, Chinese Academy of Sciences, Beijing, China, 3The Innovation Center of Excellence on Brain Science, Chinese Academy of Sciences, Beijing, China, 4China National Clinical Research Center for Neurological Diseases, Beijing, China, Beijing, China, 5Brainnetome Center, Institute of Automation, Chinese Academy of Sciences, Beijing, China
Synopsis
The underlying mechanism of vascular dementia remains unclear which leads to difficulties in developing specific disease treatments. This contribution firstly developed a multi-modal MRI approach on a mouse model with unilateral carotid artery stenosis as non-invasive measures. A positive correlation was built between fractional anisotropy and cerebral blood flow under hypoperfusion conditions, which provides insights into understanding the pathological mechanism of vascular dementia.
Introduction
Cerebral hypoperfusion is thought to be the main risk factor for the development of vascular dementia [1]. The underlying mechanism of the disease pathogenesis remains unknown leading to the lack of specific disease treatments. While previous studies found reduced cerebral blood flow (CBF) through laser speckle flowmetry and white matter (WM) changes via histological staining and imaging separately [2,3], the relationship in-between has not understood yet. In this contribution, we firstly developed a multi-modal MRI approach [4,5] as non-invasive measures on unilateral carotid artery stenosis (UCAS) mice model. This mice model was chosen due to a low mortality rate and it has been demonstrated to develop moderate hypertension and hypoperfusion through implanting micro metal coils on one side of the mice brain [6]. With this procedure, we sought to understand the link between white matter changes and cerebral perfusion in the corpus callosum.Methods
Male C57BL/6J mice were used and given access to food and water ad libitum. All procedures were performed in accordance with the guidelines for animal experimentation from the institutional ethical committee. All surgery and MRI experiments were performed under anesthesia, and all efforts were made to minimize suffering. C57BL/6J male mice were assigned into 3 groups based on standard operative procedures: (1) UCAS surgery [6], (2) sham surgery and (3) no surgery/control. The micro-coils of the UCAS group were removed prior to the MRI experiments to ensure no metal artifacts in the images.All MRI was performed on a 9.4 T horizontal bore imaging system (BioSpec 94/30 USR, Bruker, Germany) equipped with a gradient system capable of a maximum gradient amplitude of 600 mT/m and a slew rate of 4570 T/m per second. Signal was detected by using a receiver only 2x2 phased array cryogenic coil. Mice were anesthetized with isoflurane (4% for induction and 1.5–1.8% for maintenance) in 1.2 L/min room air mixed with 0.1 L/min oxygen. The animal was placed in a prone position, and the head was secured with a bite bar and ear bars. Body temperature was monitored by a rectal thermometer and maintained with a warm waterbed and warm air. Heart rate and respiratory rate were continuously monitored. T2‐weighted images were acquired using rapid acquisition with relaxation enhancement (RARE) sequence with the following parameters: RARE factor, 8; repetition time (TR)/echo time (TE), 16900/34.07 ms; number of averages, 6; matrix size, 125×56×130; Isotropic resolution, 0.16 mm.
Diffusion tensor imaging (DTI) were acquired by using an echo-planar-imaging sequence with the following parameters: 32 diffusion-weighted images with 30 isotropic directions at the b value of 1000 s/mm2 and 2 images at the b value of 0 s/mm2; TR/TE, 6000/18.27 ms; number of averages, 2; matrix size, 100×50×84; Isotropic resolution, 0.2 mm.
CBF measurement of coronal slices was carried out by using a flow‐sensitive alternating inversion recovery technique. In each of the nonselective and slice‐selective experiments, 6 images with different inversion times were acquired with the following parameters: Rapid RARE factor, 32; TR/TE, 12000/85 ms; number of averages, 4; matrix size, 100×100; in‐plane spatial resolution, 200×200 μm2; slice thickness, 1.5 mm; and number of slices, 1. The following inversion time values were used: 800,1000,1200,1400,1600 and 2000 ms and relative CBF (rCBF) image was calculated from the obtained inversion images.
Statistical analysis: paired test, two-sample t-test, and regression analyses were performed using Microsoft Excel.
Results
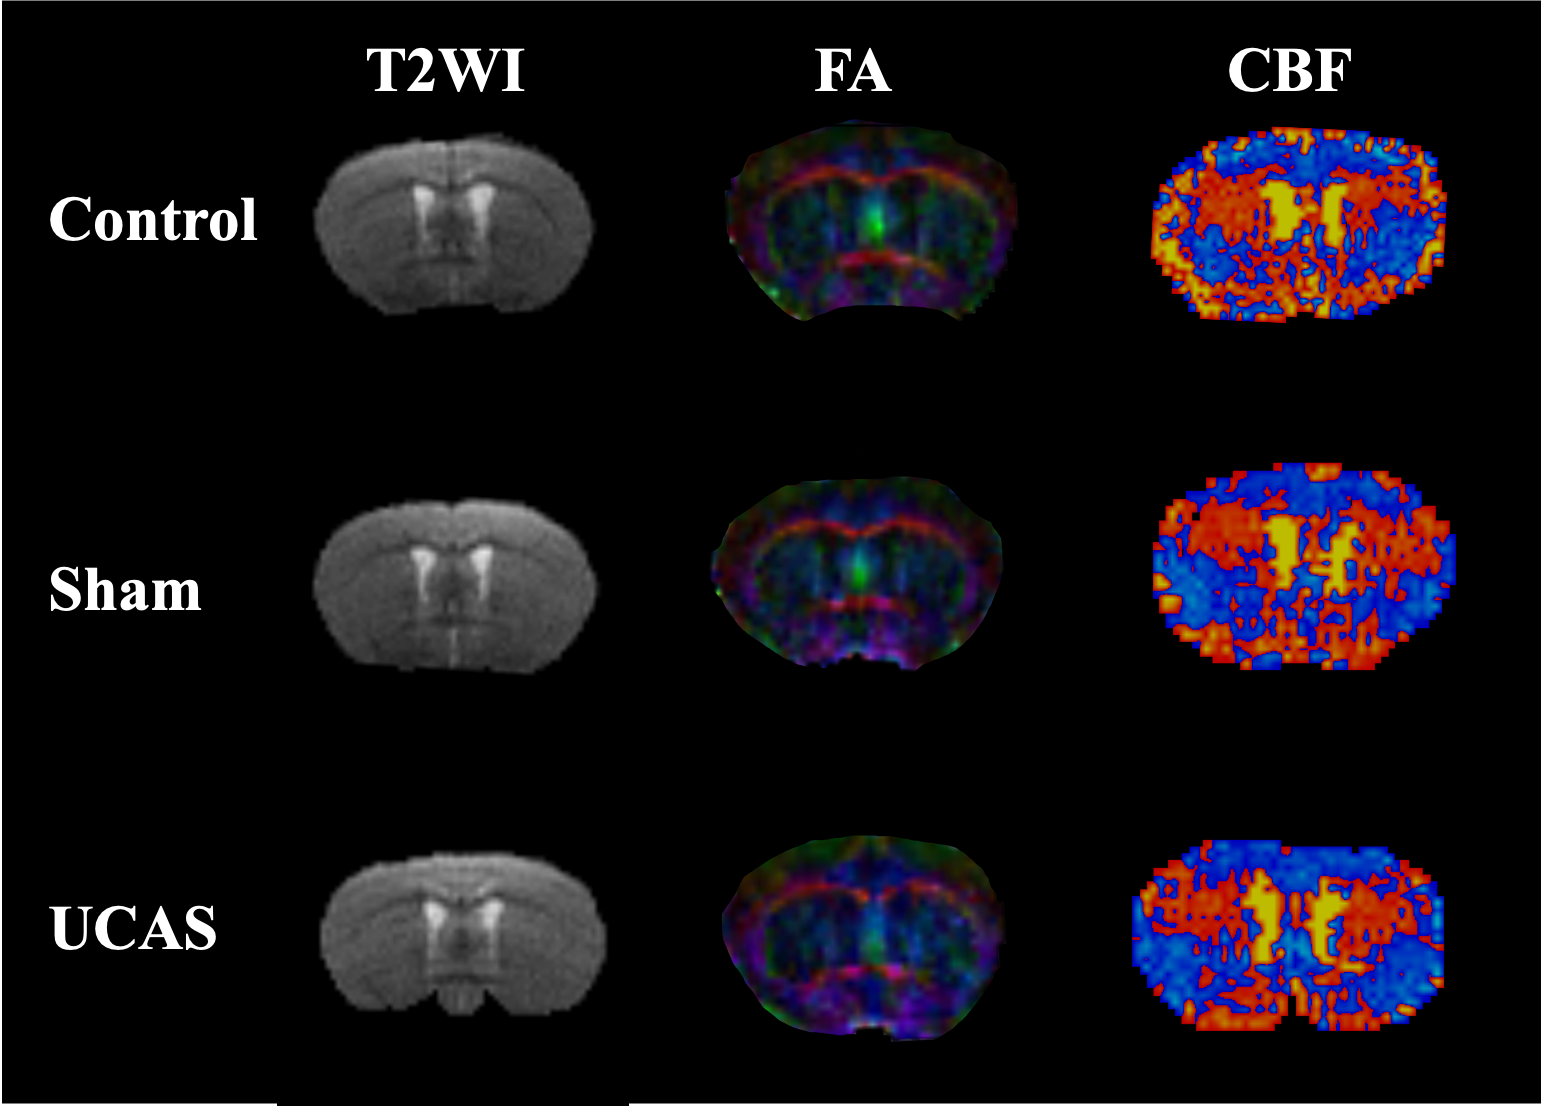
Representative T2 weighted images, FA and CBF maps of three groups at the slice (Bregma 0.02 mm) were acquired and estimated (Figure 1). Based on this slice, two ROIs covering both sides of the corpus callosum were selected for subsequent quantitative analysis. Significant decreases of FA and rCBF values are found between the ipsilateral and contralateral of the UCAS group (Figure 2). The FA and rCBF values at the ipsilateral of the UCAS group are significantly lower than other groups. No significance is seen between control and sham surgery group. Linear regression revealed a positive correlation between rCBF and FA (Figure 3).Conclusions
Cerebral blood flow and white matter damage have been linked with cerebral vascular diseases independently. However, it has not investigated yet that the relationship between the fractional anisotropy on cerebral blood flow under the same experimental conditions. We developed the multi-model MRI approach and found that in a UCAS mice model of hypoperfusion, lower FA values were associated with decreased CBF at the ipsilateral of the corpus callosum, indicating a potential pathophysiologic mechanism for impaired neuronal structure and function in hypoperfusion. This approach may help elucidate the pathological mechanism in the progress of vascular dementia and further develop specific treatments for this disease.Acknowledgements
The work was supported by Ministry of Science and Technology of China via the grant 2015CB351701, National Nature Science Foundation of China via the grant 81871021.References
[1] Venkat, P., Chopp, M. and Chen, J., 2015. Models and mechanisms of vascular dementia. Experimental neurology, 272, pp.97-108.
[2] Yata, K., Nishimura, Y., Unekawa, M., Tomita, Y., Suzuki, N., Tanaka, T., Mizoguchi, A. and Tomimoto, H., 2014. In vivo imaging of the mouse neurovascular unit under chronic cerebral hypoperfusion. Stroke, 45(12), pp.3698-3703.
[3] Yoshizaki, K., Adachi, K., Kataoka, S., Watanabe, A., Tabira, T., Takahashi, K. and Wakita, H., 2008. Chronic cerebral hypoperfusion induced by right unilateral common carotid artery occlusion causes delayed white matter lesions and cognitive impairment in adult mice. Experimental neurology, 210(2), pp.585-591.
[4] Mori, S., Itoh, R., Zhang, J., Kaufmann, W.E., Van Zijl, P.C., Solaiyappan, M. and Yarowsky, P., 2001. Diffusion tensor imaging of the developing mouse brain. Magnetic Resonance in Medicine, 46(1), pp.18-23.
[5] Leithner, C., Gertz, K., Schröck, H., Priller, J., Prass, K., Steinbrink, J., Villringer, A., Endres, M., Lindauer, U., Dirnagl, U. and Royl, G., 2008. A flow sensitive alternating inversion recovery (FAIR)-MRI protocol to measure hemispheric cerebral blood flow in a mouse stroke model. Experimental neurology, 210(1), pp.118-127.
[6] Plaschke, K., Sommer, C., Schroeck, H., et al.,2005. A mouse model of cerebral oligemia: relation to brain histopathology, cerebral blood flow, and energy state. Experimental Brain Research,162, pp. 324–331.
Figures