1933
Chemical Exchange Saturation Transfer MRI of Disease-Associated Lymph Nodes in a Mouse Model of Multiple Sclerosis1Russell H. Morgan Department of Radiology and Radiological Science, Johns Hopkins University School of Medicine, Baltimore, MD, United States, 2Institute for Cell Engineering, Imaging Section and Vascular Biology Program, Johns Hopkins University School of Medicine, Baltimore, MD, United States, 3Department of Neurology, Johns Hopkins University School of Medicine, Baltimore, MD, United States, 4Solomon H. Snyder Department of Neuroscience, Johns Hopkins University School of Medicine, Baltimore, MD, United States, 5Department of Radiology, Kennedy Krieger Institute, Baltimore, MD, United States
Synopsis
In multiple sclerosis (MS), immune cells damage the brain and spinal cord, often causing irreversible disability. Current imaging strategies visualize the resulting damage, but the heterogeneity of the damage observed complicates image interpretation. Evidence has emerged that the immunological attacks in MS are initiated in central nervous system-draining lymph nodes. Here, we demonstrate the potential of chemical exchange saturation transfer (CEST) MRI to monitor changes in these lymph nodes as disability progressed in a mouse model of experimental autoimmune encephalomyelitis.
Introduction
In multiple sclerosis (MS), immune cells target myelin antigens, resulting in damaging inflammation and ultimately, irreversible disability1. Due to the difficulty in identifying the specific autoantigen(s) inducing the disease, MS progression is primarily monitored using magnetic resonance imaging (MRI). Conventional MRI methods visualize the damage to the brain and spinal cord (e.g. lesions and atrophy) that occurs during the immunological attack. However, these MRI methods overall are considered to be unreliable predictors of immune response and disability, largely because the heterogeneity of the damage (i.e. size and location) complicates its interpretation. Inflammatory attacks in MS are initiated in central nervous system (CNS)-draining lymph nodes, where immune cells are activated and sensitized to their target antigens2,3. We investigated the utility of conventional (T2-weighted, T2-w) and molecular (continuous wave chemical exchange saturation transfer, CW CEST) MRI methods to monitor changes in these lymph nodes as disability progressed in experimental autoimmune encephalomyelitis (EAE), a mouse model of MS.Methods
Gel phantoms: Biomolecules (glucose, lactate and glutamate: 50 mM, bovine serum albumin: 5% w/v) were suspended in agarose gel (0.2% in PBS).EAE model: EAE was induced in C57Bl/6 mice (N=8) by i.p. injection of 250 ng of pertussis toxin and s.c. injection of 300 μg of MOG35-55 in IFA supplemented with 4 mg/ml tuberculin on day 0 and day 2. Mice were monitored daily and assessed for paralysis using the following clinical scoring system: 0=healthy, 1=tail paralysis, 2=mild hindlimb paralysis, 3=total hindlimb paralysis, 4=forelimb paralysis, and 5=moribund/death. Mice vaccinated without the antigen (MOG35-55) served as control (N=4).
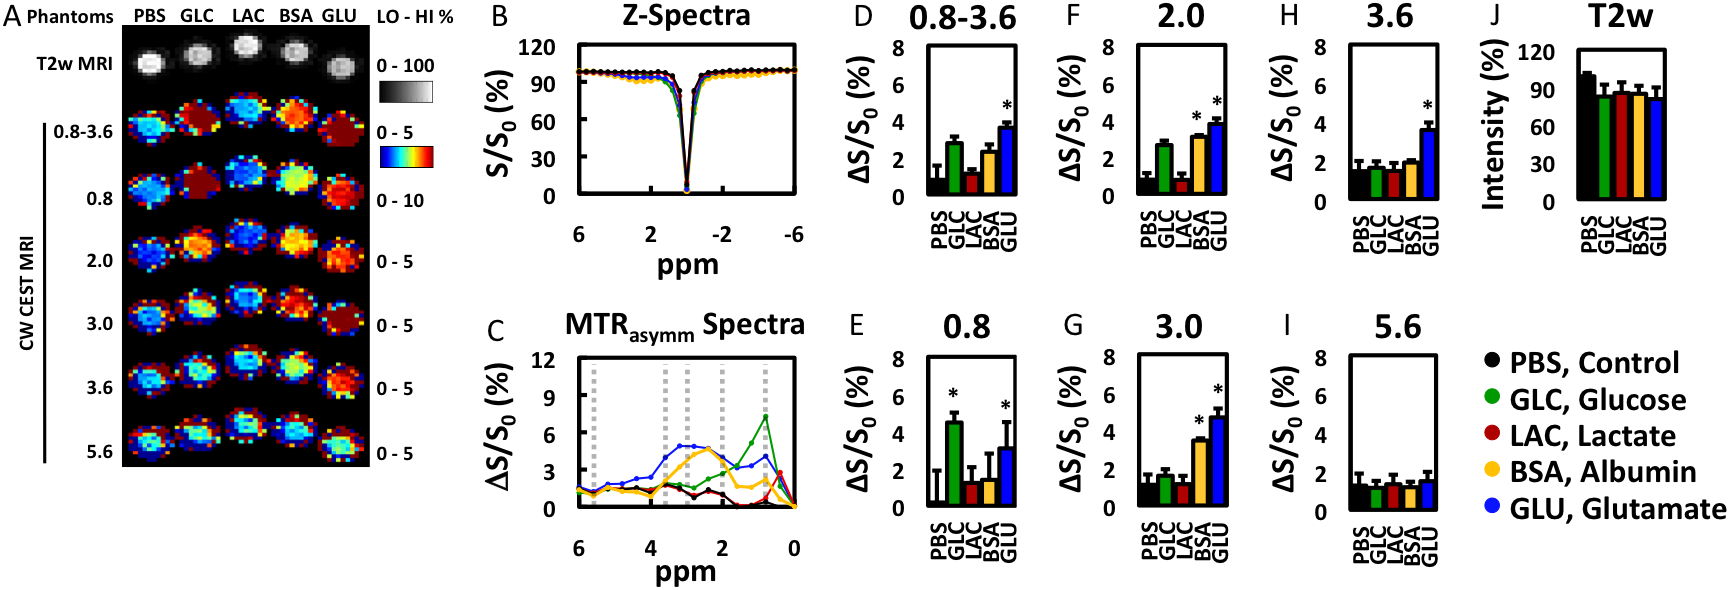
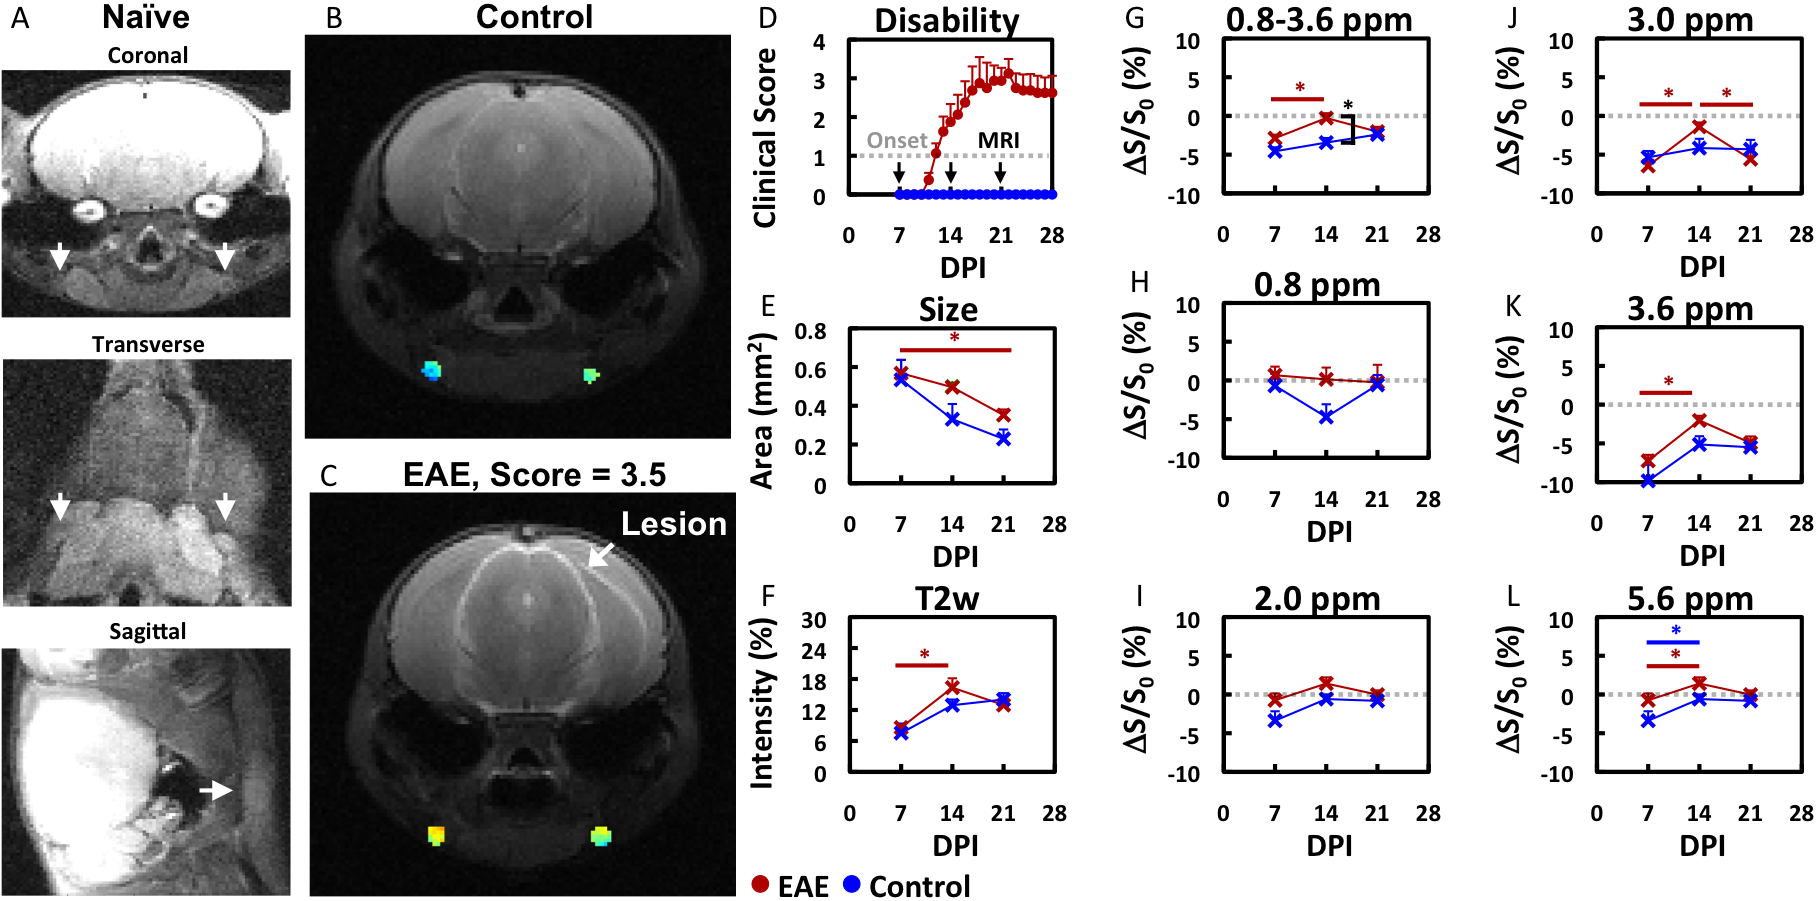
MRI: Mice were imaged 7, 14, and 21 days after disease induction using a horizontal bore Biospec 11.7T scanner with a 72-mm volume transmit coil and a 20 mm surface receiver coil. A slice thickness of 0.7 mm was used to locate superficial cervical lymph nodes and a slick thickness of 2 mm was used to measure MRI signal using the following imaging parameters. T2-w MRI: TE/TR = 20.5 ms/2 s and rare factor = 8 with a single average and repetition. CEST MRI: TE/TR = 11.15 ms/5 s, saturation time = 3 s, B1 = 1 μT and rare factor = 23 with a single average and 42 repetitions. For CEST maps, the average magnetization transfer asymmetry at several commonly-investigated frequency ranges centering at 0.8, 2.0, 3.0, and 3.6 or 0.8-3.6 ppm (±0.4 ppm) from water were used. CEST at 5.6 ppm was also quantified as a control frequency.
Statistics: Significance was defined at p<0.05 using an ANOVA with Tukey post-hoc.
Results
The ability to detect and visualize biomolecules whose regulation is known to alter in MS during an inflammatory attack (glucose4, lactate4, glutamate5,6) was first evaluated in 0.2% agarose phantoms (Figure 1). Glucose (GLC), bovine serum albumin (BSA, as a model protein), and glutamate (GLU) were detected using CEST MRI at 0.8, 2-3, and 2-3.6 ppm, respectively. Lactate was not reliably detected at these frequencies. None of these biomolecules were detected with CEST MRI at 5.6 ppm nor with T2-w MRI.We then evaluated the changes in endogenous CEST signal in disease-associated lymph nodes during an inflammatory attack in the EAE mouse model (Figure 2). At 7 days post induction (PI), paralysis and lesions could not be observed. All MRI signals were similar in EAE and control mice. At 14 days PI, paralysis was progressing in 6 out of 8 mice and grossly apparent white matter lesions were observed in 4 mice. CEST MRI signal in the 0.8-3.6 ppm (±0.4 ppm) frequency range was significantly (p<0.05) higher in EAE mice than in control mice. CEST MRI signal centered at the 3.0 ppm frequency increased significantly in EAE mice, but not control mice. At 21 days PI, the CEST signal at 3.0 ppm decreased towards control levels. All T2-w MRI signals in EAE mice were comparable to control mice. Interestingly, conventional MRI metrics (T2-w intensity, lymph node size) did not distinguish EAE mice from control mice at any time point.
Discussion and Conclusion
CEST MRI of CNS-draining lymph nodes has potential as a complementary imaging biomarker for monitoring disease progression in MS.Acknowledgements
This work was funded by the National Multiple Sclerosis Society (NMSS RG 4994-A-3, PP-1808-32367) and the TEDCO Maryland Stem Cell Research Fund (MSCRFF-3900).References
(1) Lassmann, H.; Bruck, W.; Lucchinetti, C. Trends in molecular medicine 2001, 7, 115.
(2) van Zwam, M.; Huizinga, R.; Heijmans, N.; van Meurs, M.; Wierenga-Wolf, A. F.; Melief, M.-J.; Hintzen, R. Q.; t Hart, B. A.; Amor, S.; Boven, L. A.; Laman, J. D. The Journal of Pathology 2009, 217, 543.
(3) van Zwam, M.; Huizinga, R.; Melief, M. J.; Wierenga-Wolf, A. F.; van Meurs, M.; Voerman, J. S.; Biber, K. P.; Boddeke, H. W.; Hopken, U. E.; Meisel, C.; Meisel, A.; Bechmann, I.; Hintzen, R. Q.; t Hart, B. A.; Amor, S.; Laman, J. D.; Boven, L. A. J Mol Med (Berl) 2009, 87, 273.
(4) Nijland, P. G.; Molenaar, R. J.; van der Pol, S. M.; van der Valk, P.; van Noorden, C. J.; de Vries, H. E.; van Horssen, J. Acta Neuropathol Commun 2015, 3, 79.
(5) Azevedo, C. J.; Kornak, J.; Chu, P.; Sampat, M.; Okuda, D. T.; Cree, B. A.; Nelson, S. J.; Hauser, S. L.; Pelletier, D. Ann Neurol 2014, 76, 269.
(6) Srinivasan, R.; Sailasuta, N.; Hurd, R.; Nelson, S.; Pelletier, D. Brain 2005, 128, 1016.
Figures