1932
White Matter Microstructural Changes in an Absence Epilepsy Mouse Model1Bioengineering Department, Stanford University, Stanford, CA, United States, 2Neurology Department, Stanford University, Stanford, CA, United States, 3Radiology Department, Stanford University, Stanford, CA, United States
Synopsis
A previously unexplored possibility is that maladaptive myelination may contribute to both the predisposition to seizures and cognitive impairment in diseases such as absence epilepsy. This work presents MRI white matter microstructural measurements in ex vivo mouse brains from the Scn8amed+/- model of absence epilepsy. We obtained estimates of fractional anisotropy, myelin volume fraction and g-ratio. Our results are suggestive of thicker myelin sheaths, which is consistent with g-ratio data obtained by electron microscopy. We look to expand the current analysis to perform longitudinal measurements of the evolution of this particular type of epilepsy and its interplay with aberrant myelination.
Introduction
Absence epilepsy is a common form of pediatric genetic generalized epilepsy which causes seizures that entail brief lapses in awareness1. Absence epilepsy is also associated with significant impairment of attention and learning in 30-40% of affected children. Maladaptive structural and/or functional changes in neural networks may underlie both the predisposition to seizures and cognitive impairment; however, this process remains incompletely understood. The recent discovery of activity-dependent myelin plasticity, which is required for neural network function2 suggests that aberrant neuronal activity in the form of seizures might also alter myelin. Previous works have shown that seizures promote maladaptive myelination, based on immunohistochemical quantification of oligodendrocyte precursor cells (OPCs) and electron microscopy (EM) measurements of myelin sheath thickness in rodents2. To better understand the potential interplay between myelination and seizure activity, we aim to develop a non-invasive MRI scan that enables longitudinal, whole brain in vivo assessment of myelination for a more detailed view of absence epilepsy disease progression. Towards this goal, we present here ex vivo brain MRI white matter evaluation in a murine model of absence epilepsy (Scn8amed+/-)3, and we relate these results to EM measurements in the same mouse model and also a closely related rat model (Wag/Rij)4.Methods
We acquired data on nine excised mouse brains: four wildtype (WT) and five Scn8amed+/- (denote HET) of 87 day old animals using 7T Burker small bore animal scanner (BioSpec 70/30 USR, Gradient amplitude: 440 mT/m, Slew rate: 3440 T/m/s). For all sequences, we obtained 0.7 mm sagittal slices through the corpus callosum with a field of view of 15mm x 16mm and in-plane resolution of 125um x 125um. We used the following protocols:- Magnetization Transfer (MT): 2D FLASH images with MT pulses with equivalent flip angles of 1000° and 4000° were used with seven frequency offsets of 1000, 2000, 4000, 6000, 10000, 22000 and 30000 Hz.
- T1 images: RARE sequence with six different repetition times of 600, 800, 1000, 1500, 2200 and 4000 ms.
- Diffusion: diffusion weighted EPI images encompassed into two shells with b-values of 3000 and 6000 were acquired. Each shell consisted of 36 encoding directions with 4 additional b=0 images.
Results and Discussion
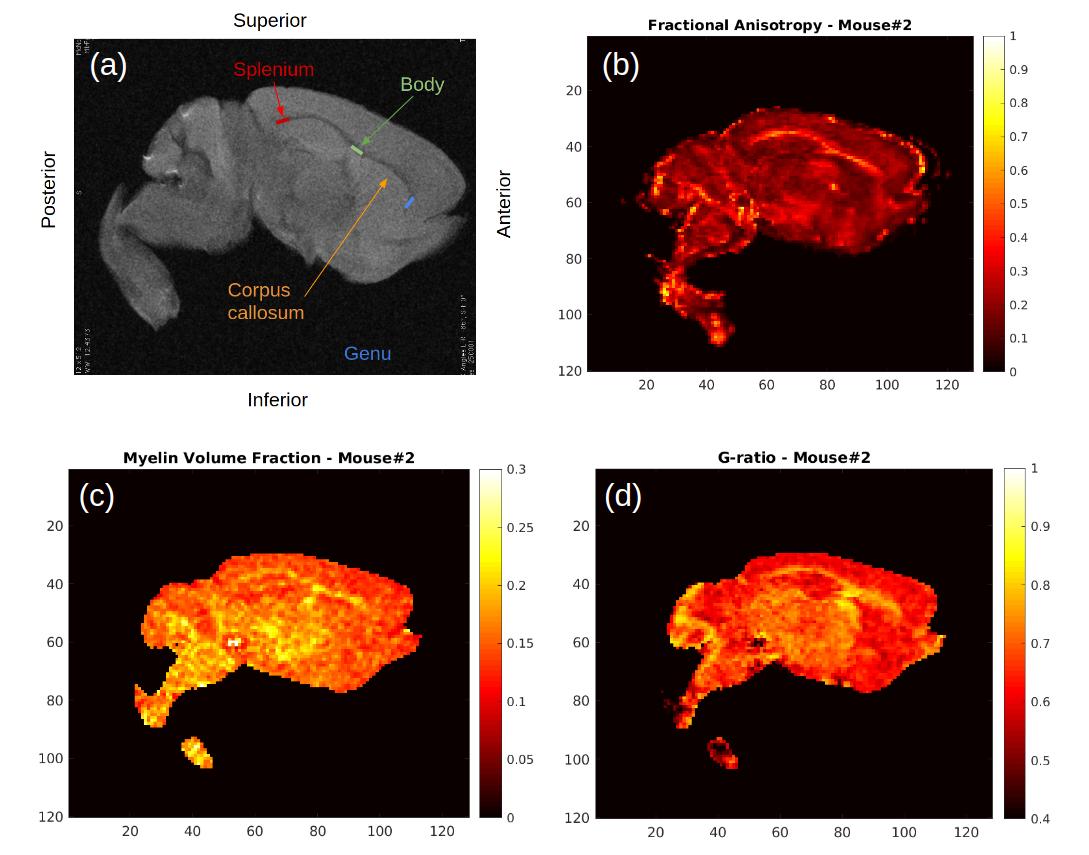
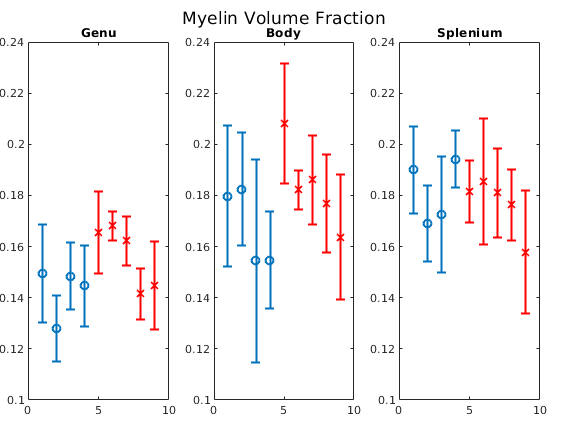
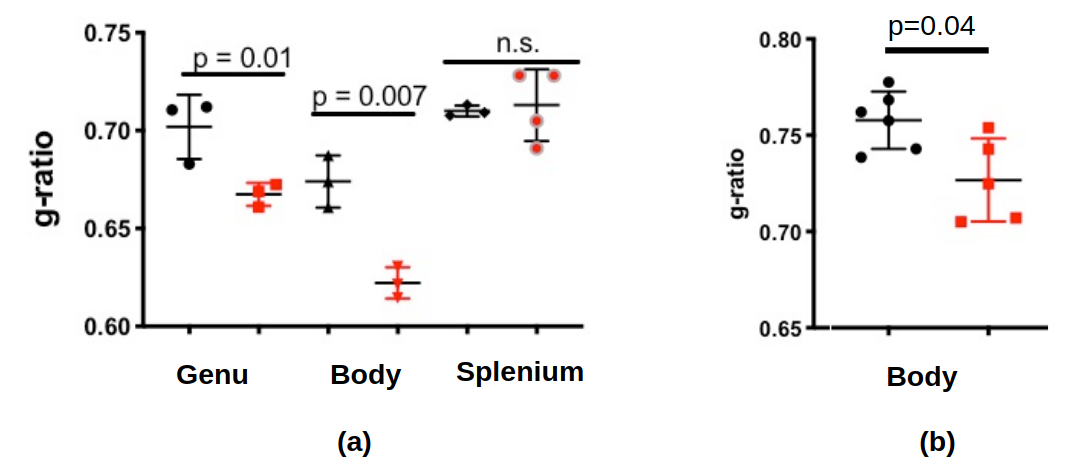
Figure 1b-1d show example FA, MVF and g-ratio maps for one of the samples. The corpus callosum can be clearly observed as it is known to show higher anisotropy and myelination. Figures 2 and 3 show the values for MVF and g-ratio between the different brains. Although we are not appropriately powered yet, the results suggest a decrease in estimated g-ratio in the genu (WT:0.75±0.04, HET:0.66±0.04) but not in the body (WT:0.79±0.03, HET:0.77±0.03) or splenium (WT:0.72±0.03, HET:0.71±0.03). EM measurements Wag/Rij rats display a decrease of g-ratio in the genu and body (WT:0.70±0.02, SZ:0.66±0.01 and WT:0.67±0.01, SZ:0.62±0.01, respectively), but not in the splenium (Figure 5). The EM data also showed that such an increase was specifically due to increased myelination, and the small increase in MVF observed in Figure 3 for the genu (WT:0.14±0.01, HET:0.16±0.01) is in agreement with these findings. EM measurements in the body of Scn8amed+/- mice also show a decrease in g-ratio (WT:0.75±0.01, HET:0.72±0.02). The estimated MVF, AVF and g-ratio measures have not yet undergone the slope calibrations recommended in previous works5,6,14. While FA also shows a decrease in the genu (WT:0.24±0.05, HET:0.19±0.05), it suffers from high variability (Fig. 4) and is not specific to myelination15. Future experiments will perform both the MRI and EM in the same brain tissue to better understand how our MRI estimates relate to EM measurements. Ultimately, the aim is to enable longitudinal, whole brain in vivo studies of myelination evolution that capture a more detailed view of absence epilepsy disease progression.Conclusion
We have presented MRI-derived microstructural metrics in control and absence epilepsy mouse models. Further directions include (i) validating the metrics against EM and (ii) translating the protocol and analysis to in vivo mice to probe longitudinal changes in myelination. These imaging tools will be used to determine network-level seizure-induced myelin abnormalities, a novel disease mechanism.Acknowledgements
This work has been funded by NIH: R01 NS095985, R01 MH111444 grants, the Charles A. Dana Foundation, NIMH R21 MH116484 grant, and Wu Tsai Neuroscience Institute at Stanford University.
References
- Kessler, Sudha Kilaru, and Emily McGinnis. "A Practical Guide to Treatment of Childhood Absence Epilepsy." Pediatric Drugs 21.1 (2019): 15-24.
- Gibson, Erin M., et al. "Neuronal activity promotes oligodendrogenesis and adaptive myelination in the mammalian brain." Science 344.6183 (2014): 1252304.
- Makinson, Christopher D., et al. "Regulation of thalamic and cortical network synchrony by Scn8a." Neuron 93.5 (2017): 1165-1179.
- Sarkisova, Karine, and Gilles van Luijtelaar. "The WAG/Rij strain: a genetic animal model of absence epilepsy with comorbidity of depressiony." Progress in Neuro-Psychopharmacology and Biological Psychiatry 35.4 (2011): 854-876.
- West, Kathryn L., et al. "Myelin volume fraction imaging with MRI." Neuroimage 182 (2018): 511-521.
- West, Kathryn L., et al. "Experimental studies of g-ratio MRI in ex vivo mouse brain." NeuroImage 167 (2018): 366-371.
- Thiessen, Jonathan D., et al. "Quantitative MRI and ultrastructural examination of the cuprizone mouse model of demyelination." NMR in Biomedicine 26.11 (2013): 1562-1581
- Sled, John G., and G. Bruce Pike. "Quantitative imaging of magnetization transfer exchange and relaxation properties in vivo using MRI." Magnetic Resonance in Medicine: An Official Journal of the International Society for Magnetic Resonance in Medicine 46.5 (2001): 923-931.
- Cabana, J.-F., Gu, Y., Boudreau, M., Levesque, I. R., Atchia, Y., Sled, J. G., Narayanan, S., Arnold, D. L., Pike, G. B., Cohen-Adad, J., Duval, T., Vuong, M.-T. and Stikov, N. (2016), Quantitative magnetization transfer imaging made easy with qMTLab: Software for data simulation, analysis, and visualization. Concepts Magn. Reson.
- Zhang, Hui, et al. "NODDI: practical in vivo neurite orientation dispersion and density imaging of the human brain." Neuroimage 61.4 (2012): 1000-1016.
- Daducci, Alessandro, et al. "Accelerated microstructure imaging via convex optimization (AMICO) from diffusion MRI data." Neuroimage 105 (2015): 32-44.
- Jenkinson, Mark, et al. "Fsl." Neuroimage 62.2 (2012): 782-790.
- Ourselin, Sébastien, Radu Stefanescu, and Xavier Pennec. "Robust registration of multi-modal images: towards real-time clinical applications." International Conference on Medical Image Computing and Computer-Assisted Intervention. Springer, Berlin, Heidelberg, 2002.
- Stikov, Nikola, et al. "In vivo histology of the myelin g-ratio with magnetic resonance imaging." Neuroimage 118 (2015): 397-405.
- Aung, Wint Yan, Soe Mar, and Tammie LS Benzinger. "Diffusion tensor MRI as a biomarker in axonal and myelin damage." Imaging in medicine 5.5 (2013): 427.
Figures