1927
Highly specific and direct assessment of microscopic anisotropy following traumatic brain injury using diffusion correlation imaging (DCI)1National Institutes of Health, Bethesda, MD, United States, 2Uniformed Service University of the Health Sciences, Bethesda, MD, United States, 3The University of Arizona, Tucson, AZ, United States
Synopsis
Diffusion MRI techniques that extend beyond diffusion tensor imaging (DTI) – including double diffusion encoding (DDE) – could provide more specific tools to probe abnormalities in disease or injury states. Here, DDE is applied to reveal the diffusion correlation spectrum on a voxelwise basis, which allows to directly assess the microscopic anisotropy in healthy and injured ferret spinal cords.
Introduction
Diffusion MRI (dMRI) can reveal nervous system pathology in the absence of other MRI signal changes by its sensitivity to the microscale tissue environment, although first-order models such as diffusion tensor imaging (DTI)1 often cannot provide specific information about the origin and biological basis of cellular changes. While conventional dMRI describes water mobility in tissue along different directions, Diffusion-Diffusion Correlation SpectroscopY (DDCOSY) is an MR method that provides correlations between water mobility along different directions.2,3 DDCOSY can directly quantify microscopic anisotropy, making it a potentially powerful method to explore white matter (WM) injuries. Here we use the marginal distributions constrained optimization (MADCO)4 framework to obtain voxelwise DDCOSY images, which we call Diffusion Correlation Imaging (DCI), on healthy and injured ferret spinal cord specimens.Methods
Perfusion fixed spinal cords were obtained from a collection of specimens taken as part of a larger study of closed head injury (CHI) in ferrets. Two cervical cord sections were selected, one from an uninjured control and the other 1 week following CHI, which resulted in focal corticospinal tract (CST) hemorrhage. Wallerian degeneration was expected along the CST, but not along other pathways. The two specimens were inserted into the same NMR tube, and data were collected using a 10mm coil with a 7 T Bruker MRI scanner. DCI data were collected using the double diffusion encoding (DDE) sequence.2 The diffusion gradients were applied in parallel (z) and perpendicular (x) to the spinal cord axis of symmetry. The MADCO framework4 was used with a total of 66 b-values acquisitions, and $$$b_{max}$$$=36,000 s/mm2, with a voxel size of a 100 µm3, and a repetition time of 800 ms.Results and Discussion
Axial and longitudinal transmission electron microscopy images of control and injured CST regions are shown in Fig. 1. Local swelling, sometimes referred to as beading, of axons in the TBI spinal cord is evident in both image planes, as indicated by the red arrows.Conventional MRI techniques did not provide compelling evidence for the presence of axonal injury, as can be seen in Fig. 2. No apparent abnormalities were observed on the T2-weighted (T2W), radial diffusivity (RD), or fractional anisotropy (FA) images. A moderate reduction in axial diffusivity (AD) was observed at the lateral CST of the TBI sample, but also in regions of the control sample.
Using DCI, distributions of axial and radial diffusivities and their correlation are obtained instead of single, average diffusion coefficients. Representative diffusion correlation spectra from single voxels within the (1) gray matter (GM), (2) normal white matter (WM) and (3) the TBI tract are shown in Fig. 3 (voxel location indicated on the proton density images). The red diagonal line indicates (microscopic) diffusion isotropy, i.e., when Dx=Dz. Spectral components that are far from the diagonal line represent water pools with microscopic anisotropy, and vice versa. As expected, in both control and TBI samples DDCOSY of GM contained mainly microscopically isotropic components. Conversely, DDCOSY of WM contained two microscopically anisotropic components along with a microscopically isotropic component. The spectra from these normal regions in both control and TBI were similar, which strengthens the validity of this comparative study. Lastly, DDCOSY from the TBI tract voxel in the control sample was very similar to the normal WM spectrum. However, in the TBI sample case, some of the microscopically anisotropic components have shifted towards the diagonal line and became isotropic. The increased microscopic isotropy of injured axons is a direct measurement of the axonal beading that has occurred (Fig. 1).
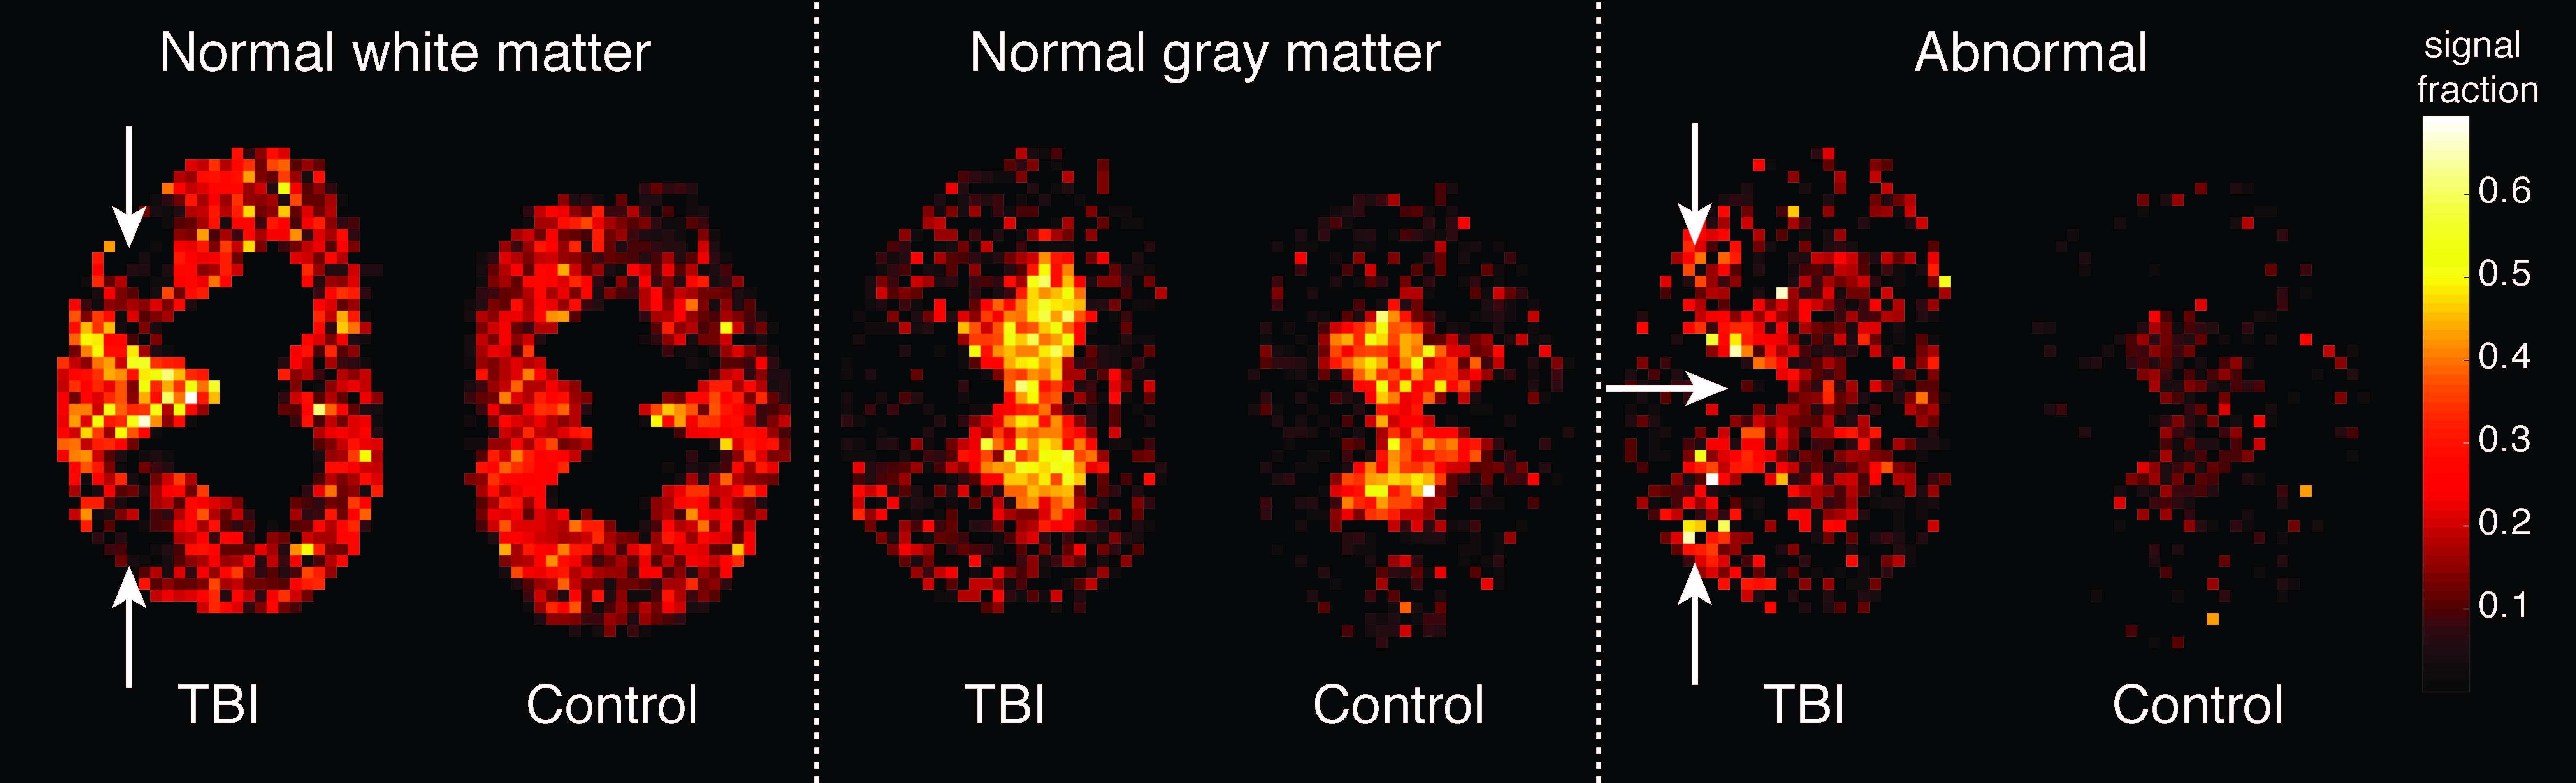
Voxelwise diffusion correlation spectra (DCS) can be used to generate images of specific diffusion components based on their mobility in the radial and axial directions. In Fig. 4, normal WM and GM components were identified based on the above DCS signature, which was then used to generate the corresponding quantitative images. A complete absence of signal intensity in the normal WM image was observed at the lateral CST of the TBI sample (white arrows). Based on the unique DCS signature of the injured regions, an abnormal component was identified and was used to generate a quantitative population fraction image. Significant abnormal hyperintensities of the CST were observed only in the TBI sample. In addition, abnormal hyperintensities were observed at the somatic and visceral sensory nuclei of the TBI sample.
Conclusion
In this first implementation and application of DCI it was shown to provide additional information beyond DTI in the axial direction so that injured WM could be quantitatively distinguished from GM. The ability of DCI to reveal distinct populations of axons at the site of injury, and in addition, to localize cellular alterations in the GM, suggests potential specificity for beading and demonstrates the ability of this approach to probe changes that may not be accessible with other techniques.Conventional T2W MRI was shown to be insensitive to this degree of Wallerian degeneration. Some DTI metrics, most notably the AD, exhibited only a moderate degree of sensitivity to injury, however, the changes were non-specific. DCI generated tissue-specific images revealed the exact region of injury, along with evidence of accompanying cellular changes in GM.
Acknowledgements
This work was supported by funds provided by the Intramural Research Program of the Eunice Kennedy Shriver National Institute of Child Health and Human Development (grant number ZIAHD000266) and the Center for Neuroregenerative Medicine (CNRM) under the auspices of the Henry Jackson Foundation (HJF).References
- Basser, P. J., Mattiello, J., and LeBihan D. MR diffusion tensor spectroscopy and imaging. Biophys. J. 66, 259–267 (1994).
- Callaghan, P. T. & Furó I. Diffusion-diffusion correlation and exchange as a signature for local order and dynamics. J. Chem. Phys. 120, 4032 (2004).
- Zong, F., Ancelet, L. R., Hermans, I. F., and Galvosas, P. Determining mean fractional anisotropy using DDCOSY: preliminary results in biological tissues. Magn. Reson. Chem. 55, 498–507 (2017).
- Benjamini, D. & Basser, P. J. Use of marginal distributions constrained optimization (MADCO) for accelerated 2D MRI relaxometry and diffusometry. J. Magn. Reson. 271, 40–45 (2016).
Figures
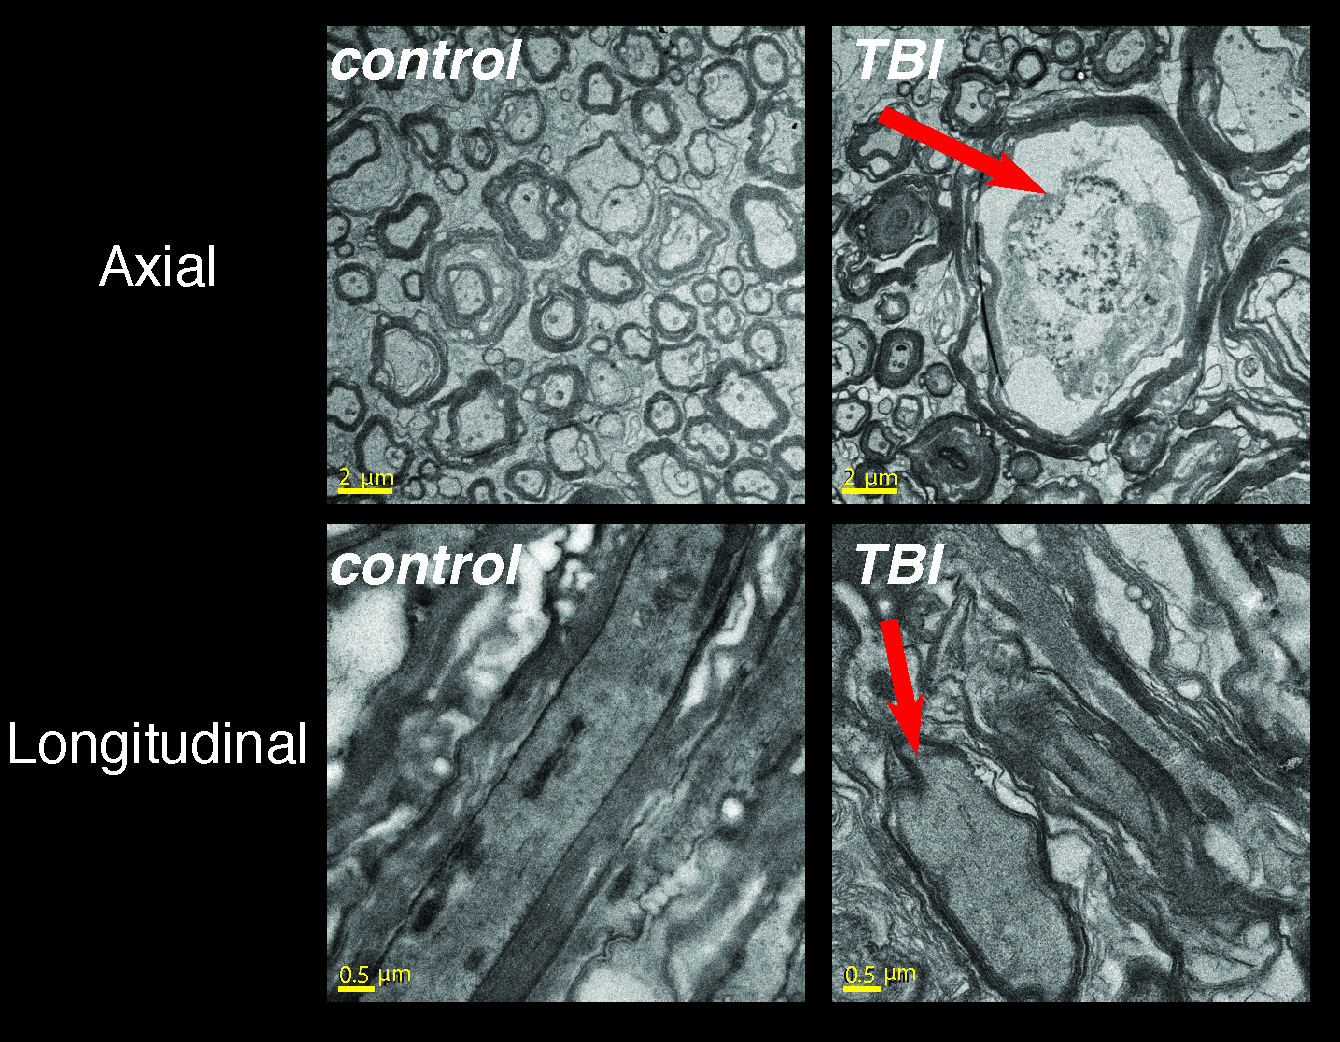
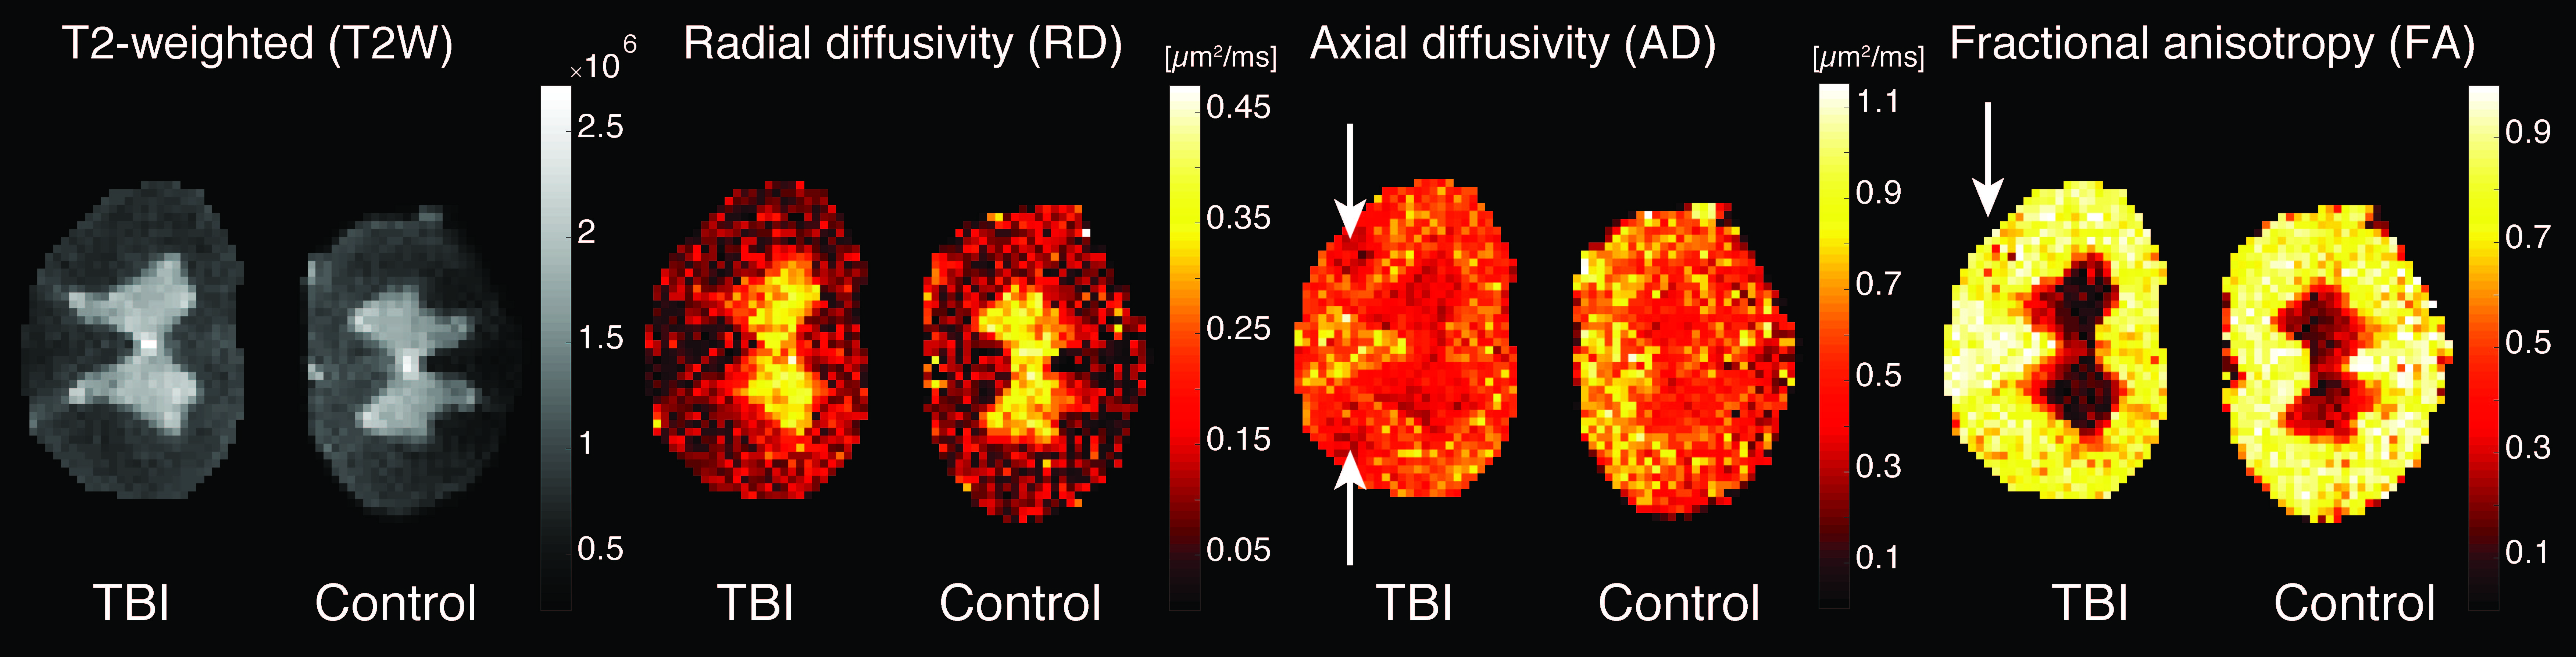
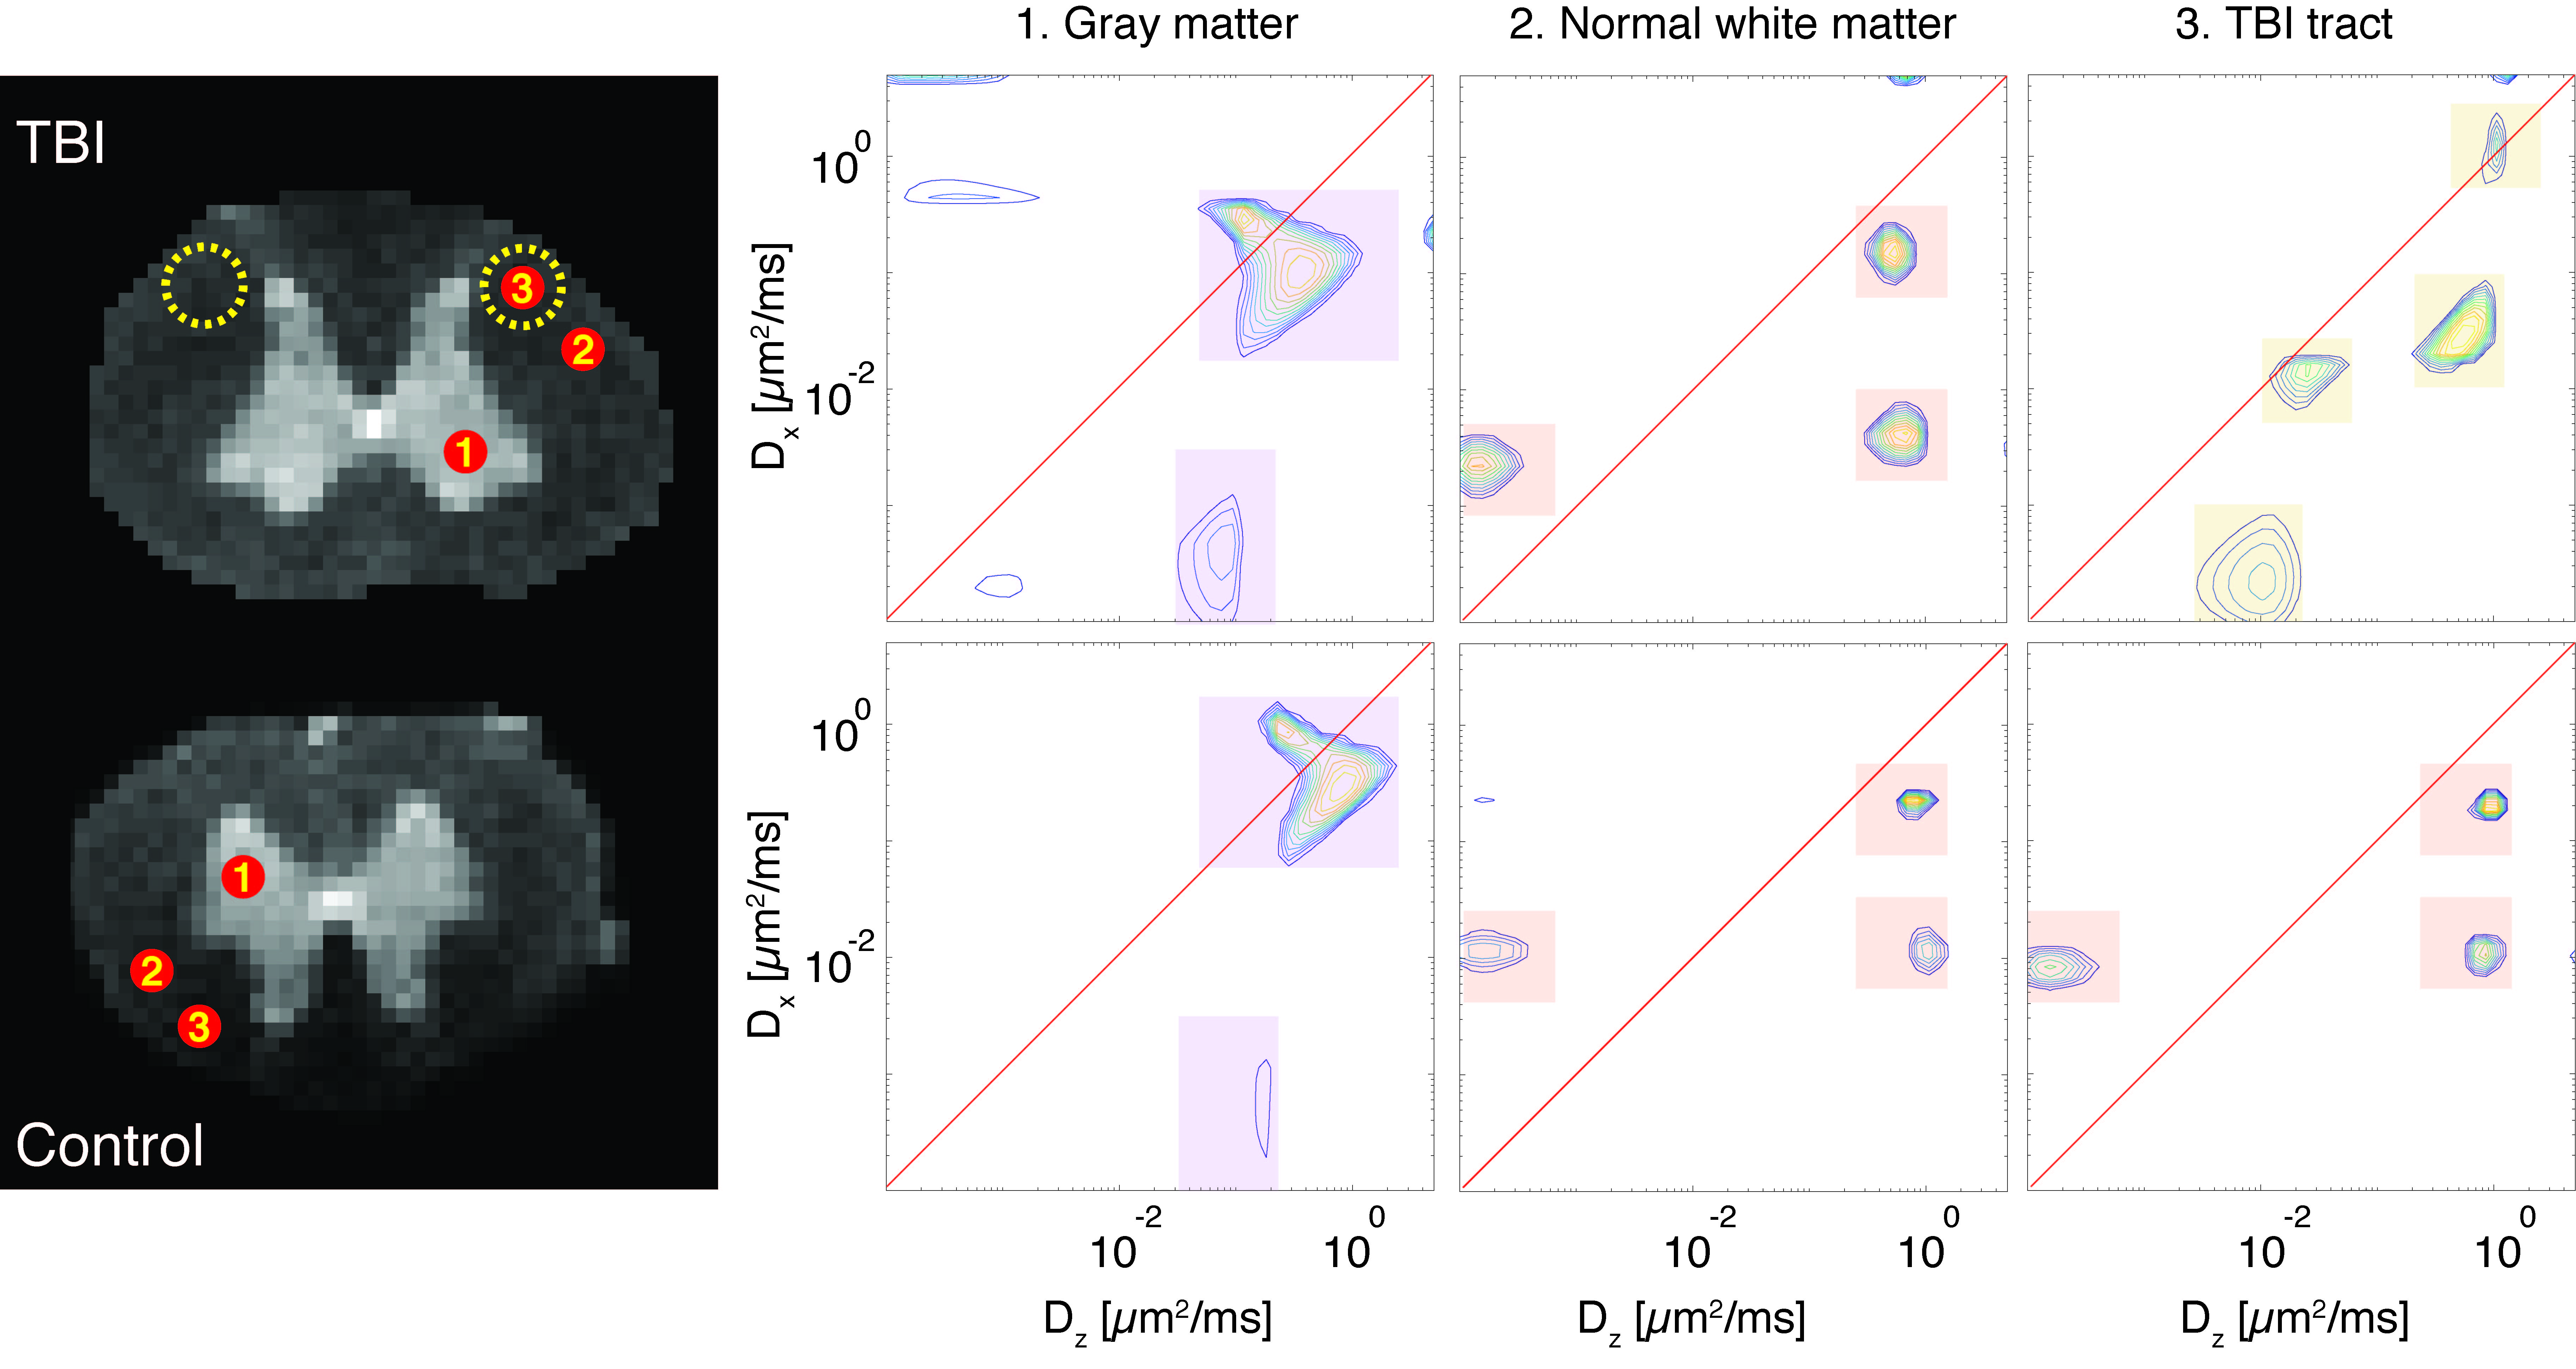
Figure 3. Diffusion correlation spectra from single voxels. Three voxels, (1) GM, (2) normal WM, and (3) injury tract, from each sample, TBI (top) and control (bottom), are shown. Note the similarity of the spectra derived from normal WM and GM between the control and TBI, pointing to strong consistency of the method. By contrast, the injured tract exhibited a different spectral signature, pointing to a more microscopically isotropic structure.