1925
Changes in Quantitative Magnetization Transfer MR in the Mouse Brain After Transient Cerebral Ischemia1Institute for Biomedical Engineering, ETH Zurich, Zurich, Switzerland, 2ETH Zurich, Zurich, Switzerland
Synopsis
Quantitative analysis of magnetization transfer (qMT) based on a two-pool model was employed to characterized changes in the mouse brain following a transient middle cerebral artery occlusion (tMCAO) model of cerebral ischemia.The changes in qMT were compared to the standard MR metrics of an ischemic lesion (T1, T2, ADC, FLAIR) to examine the possible overlap of mechanisms affecting these magnetic resonance imaging contrasts. Notable changes of all MR metrics were found in the brain of the tMCAO group while only the qMT analysis revealed significant alterations in the sham-operated animals.
Introduction
Quantitative MT (qMT) is a sensitive measure of a macromolecular content of tissue1,2. It enables measuring the physicochemical characteristics of the macromolecular proton pools including semi-solid proton fraction, relaxation times of the semi-solid/free water pool and the corresponding exchange rate between them. These characteristics were previously employed to assess changes of brain tissue in Alzheimer's disease3,4, multiple sclerosis5 or cancer6,7, pointing to a potentially increased qMT sensitivity towards macromolecular changes in the tissue, not accessible with standard MR contrasts. In this study, qMT analysis along with a standard MR protocol for characterization of ischemic lesions were employed to reveal similarities and differences in changes of MR contrasts after 24 h and 48 h post tMCAO.Methods
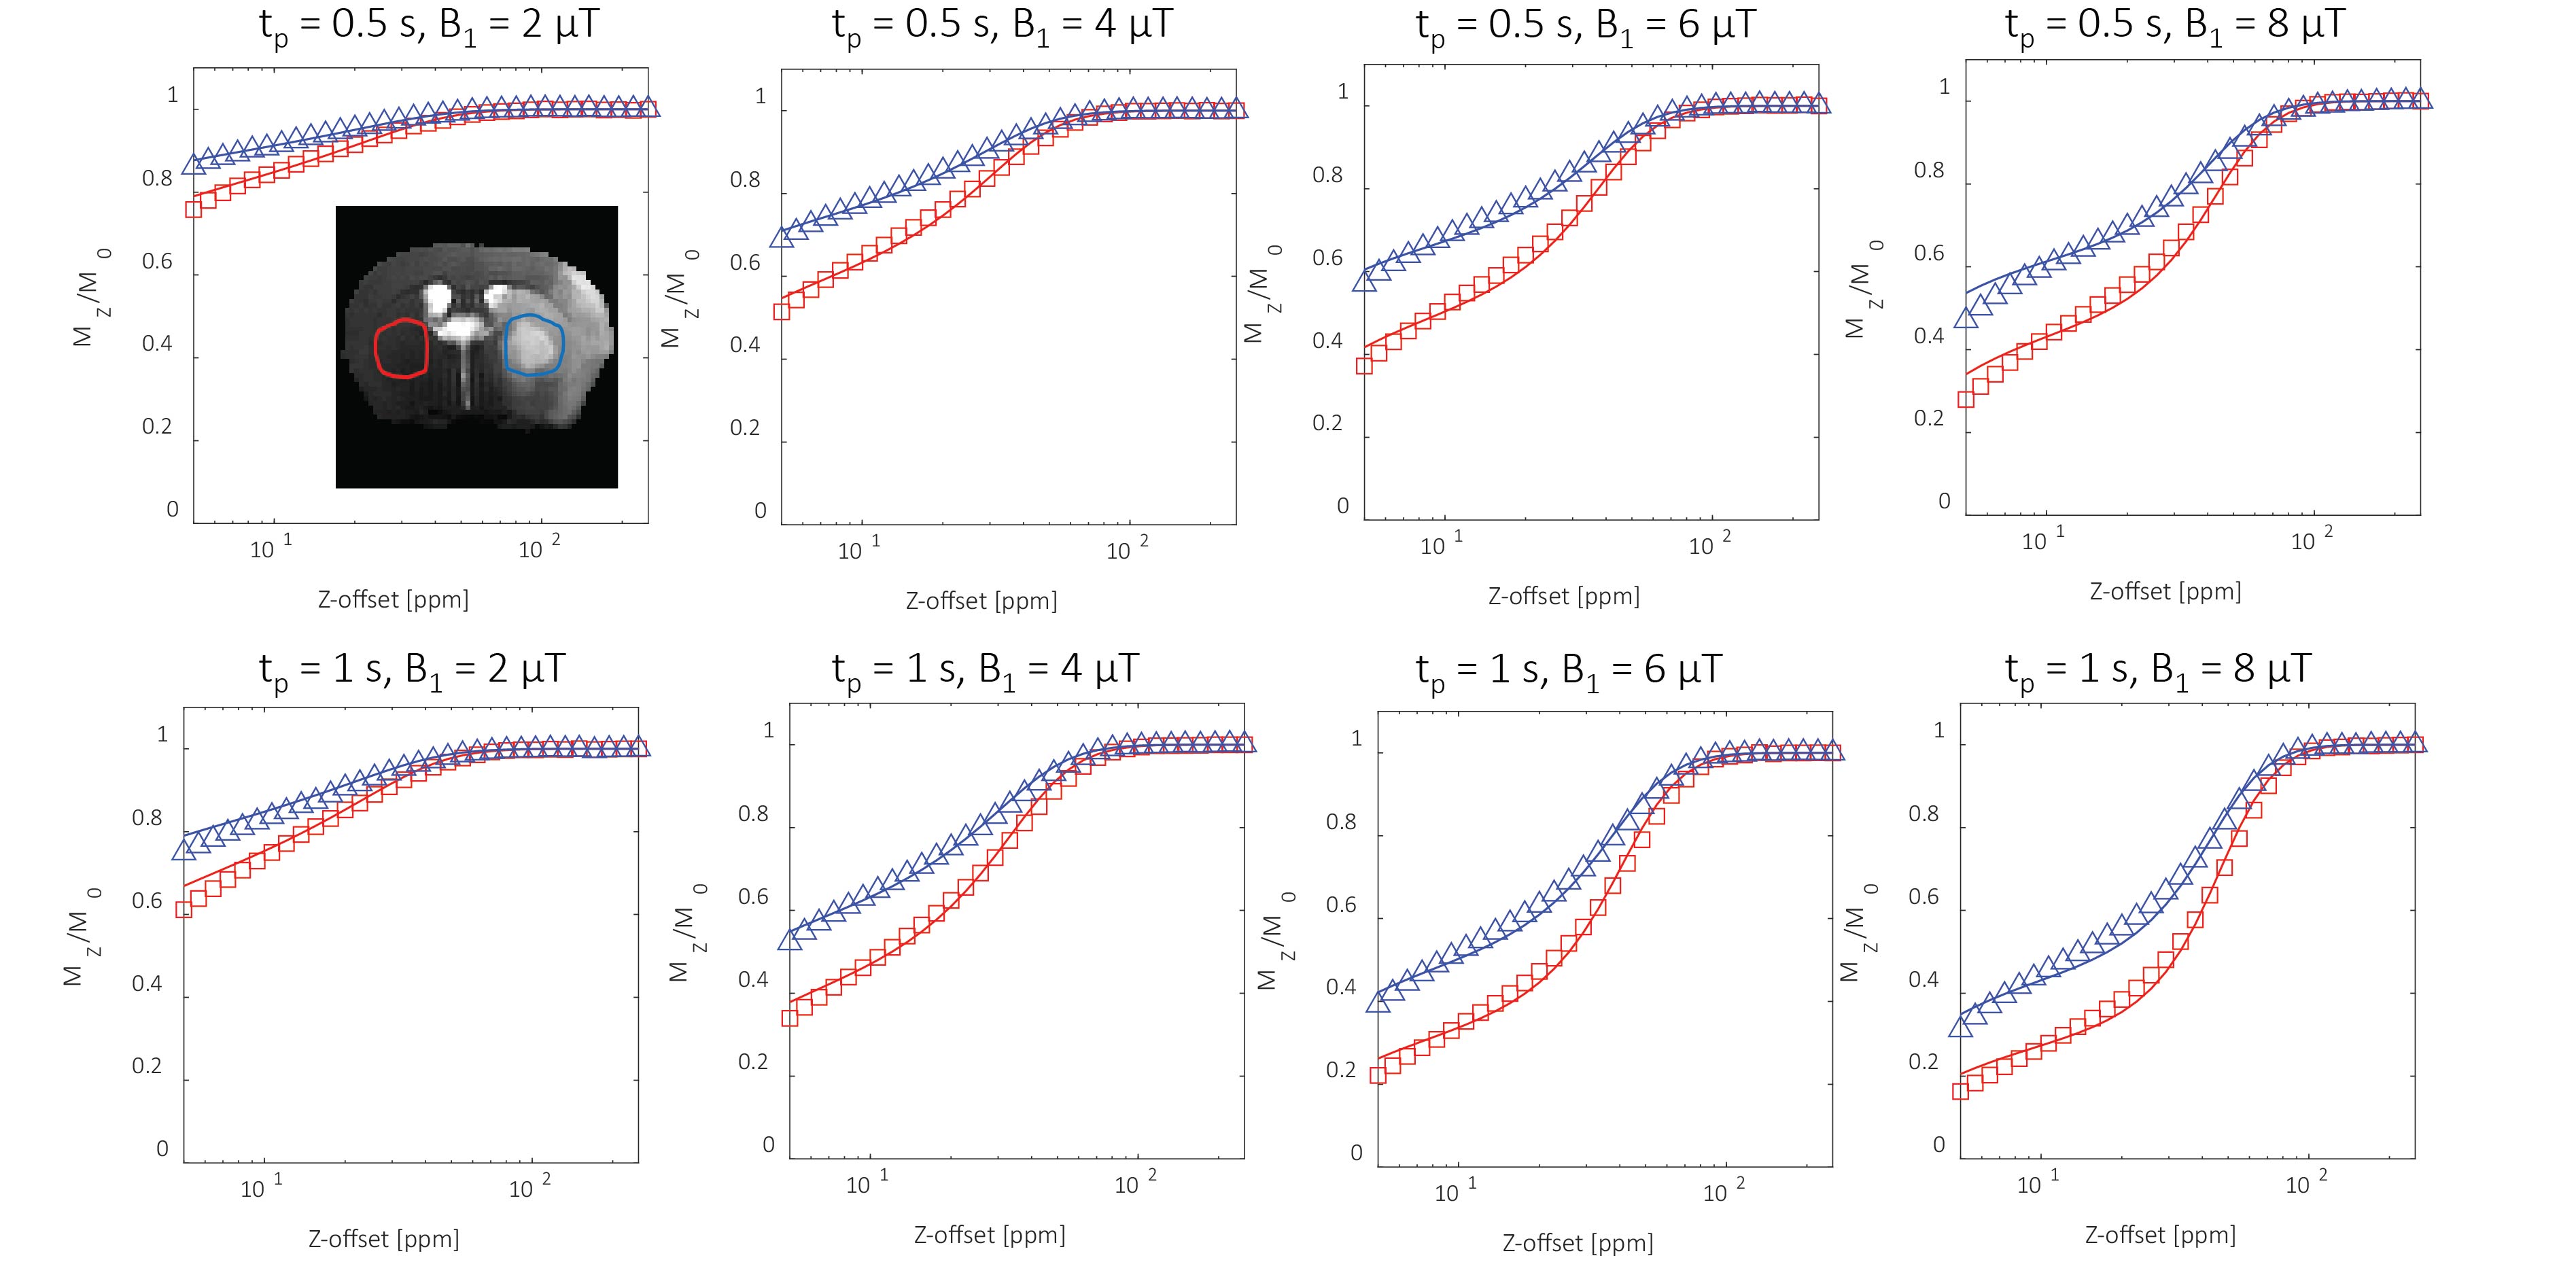
Animal handling: All animal experiments were performed with adherence to the Swiss Federal Act on Animal Protection and were approved by the Cantonal Veterinary Office Zurich. A total of 17 male C57/BL6 mice were studied, weight range 20–25 g, age range 8–10 weeks. The surgical procedure was carried out as previously described8–10. The middle cerebral artery was occluded for 60 min. tMCAO/sham-operated animals were assessed with MRI at 24h and 48h after reperfusion.Data acquisition: All MR data were recorded with a 9.4 T small animal MRI scanner (Bruker BioSpec, Ettlingen, Germany), equipped with a cryogenically cooled 2x2 phased array. The standard MR protocol to characterize ischemic lesion was employed as described earlier10 and encompassed acquisition of T1, T2 and ADC maps. For the acquisition of qMT maps, the following acquisition parameters were used: FOV: 20x20 mm2, matrix: 128x128, TE/TR: 3.3/5000 ms, RARE factor: 32, MT module: 32 irradiation offsets between 5-250 ppm spaced logarithmically, saturation power: 2,4,6,8μT, saturation duration: 500,1000ms.
Data analysis: All data were reconstructed in ParaVision 6.0.1. (Bruker, Ettlingen, Germany) and analyzed in MatLab 20018b (Mathworks, Natick, MA). The relaxation/ADC maps were fitted using a mono-exponential function. MT data were analyzed using a two-pool tissue model consisting of the free water pool (A) and the semi-solid macromolecular pools (B). The qMT fitting was performed in transient state using the Bloch-McConnel equations11,12:
$$\left\{ \begin{array}{ll}\frac{dM_{X,A}}{dt} = -\frac{M_{X,A}}{T_{2,A}}-2\pi\Delta M_{Y,A}\\\frac{dM_{Y,A}}{dt} = -\frac{M_{Y,A}}{T_{2,A}}-2\pi\Delta M_{X,A}-\omega_{1}M_{Z,A}\\\frac{dM_{Z,A}}{dt} = R_{A}(M_{0,A}-M_{Z,A})-RM_{0,B}M_{Z,A}+RM_{0,A}M_{Z,B}+\omega_{1}M_{Y,A}\\\frac{dM_{Z,B}}{dt} = R_{B}(M_{0,B}-M_{Z,B})-RM_{0,A}M_{Z,B}+RM_{0,B}M_{Z,A}+R_{RF,B}M_{Z,B}\end{array} \right.$$
with four free parameters: R – exchange constant between the two pools, T2,B – traverse relaxation of the semi-solid pool, RM0,B/RA – amount of magnetization transfer and 1/RAT2,A – saturation due to the direct effect. A super Lorentzian line shape was used for the absorption rate constant RRF,B of the semi-solid pool11,12:
$$
R_{RF,B} = \pi\omega_{1}\int_{0}^{\frac{\pi}{2}}\sin\theta\sqrt{\frac{2}{\pi}}\frac{T_{2,B}}{|3\cos^{2}\theta-1|}\exp[-2(\frac{2\pi T_{2,B}}{|3\cos^{2}\theta-1|})^{2}]d\theta
$$
The qMT model was solved with matrix exponentials and fitted with “fminsearch” function in MatLab using all eight MT curves simultaneously.
Results
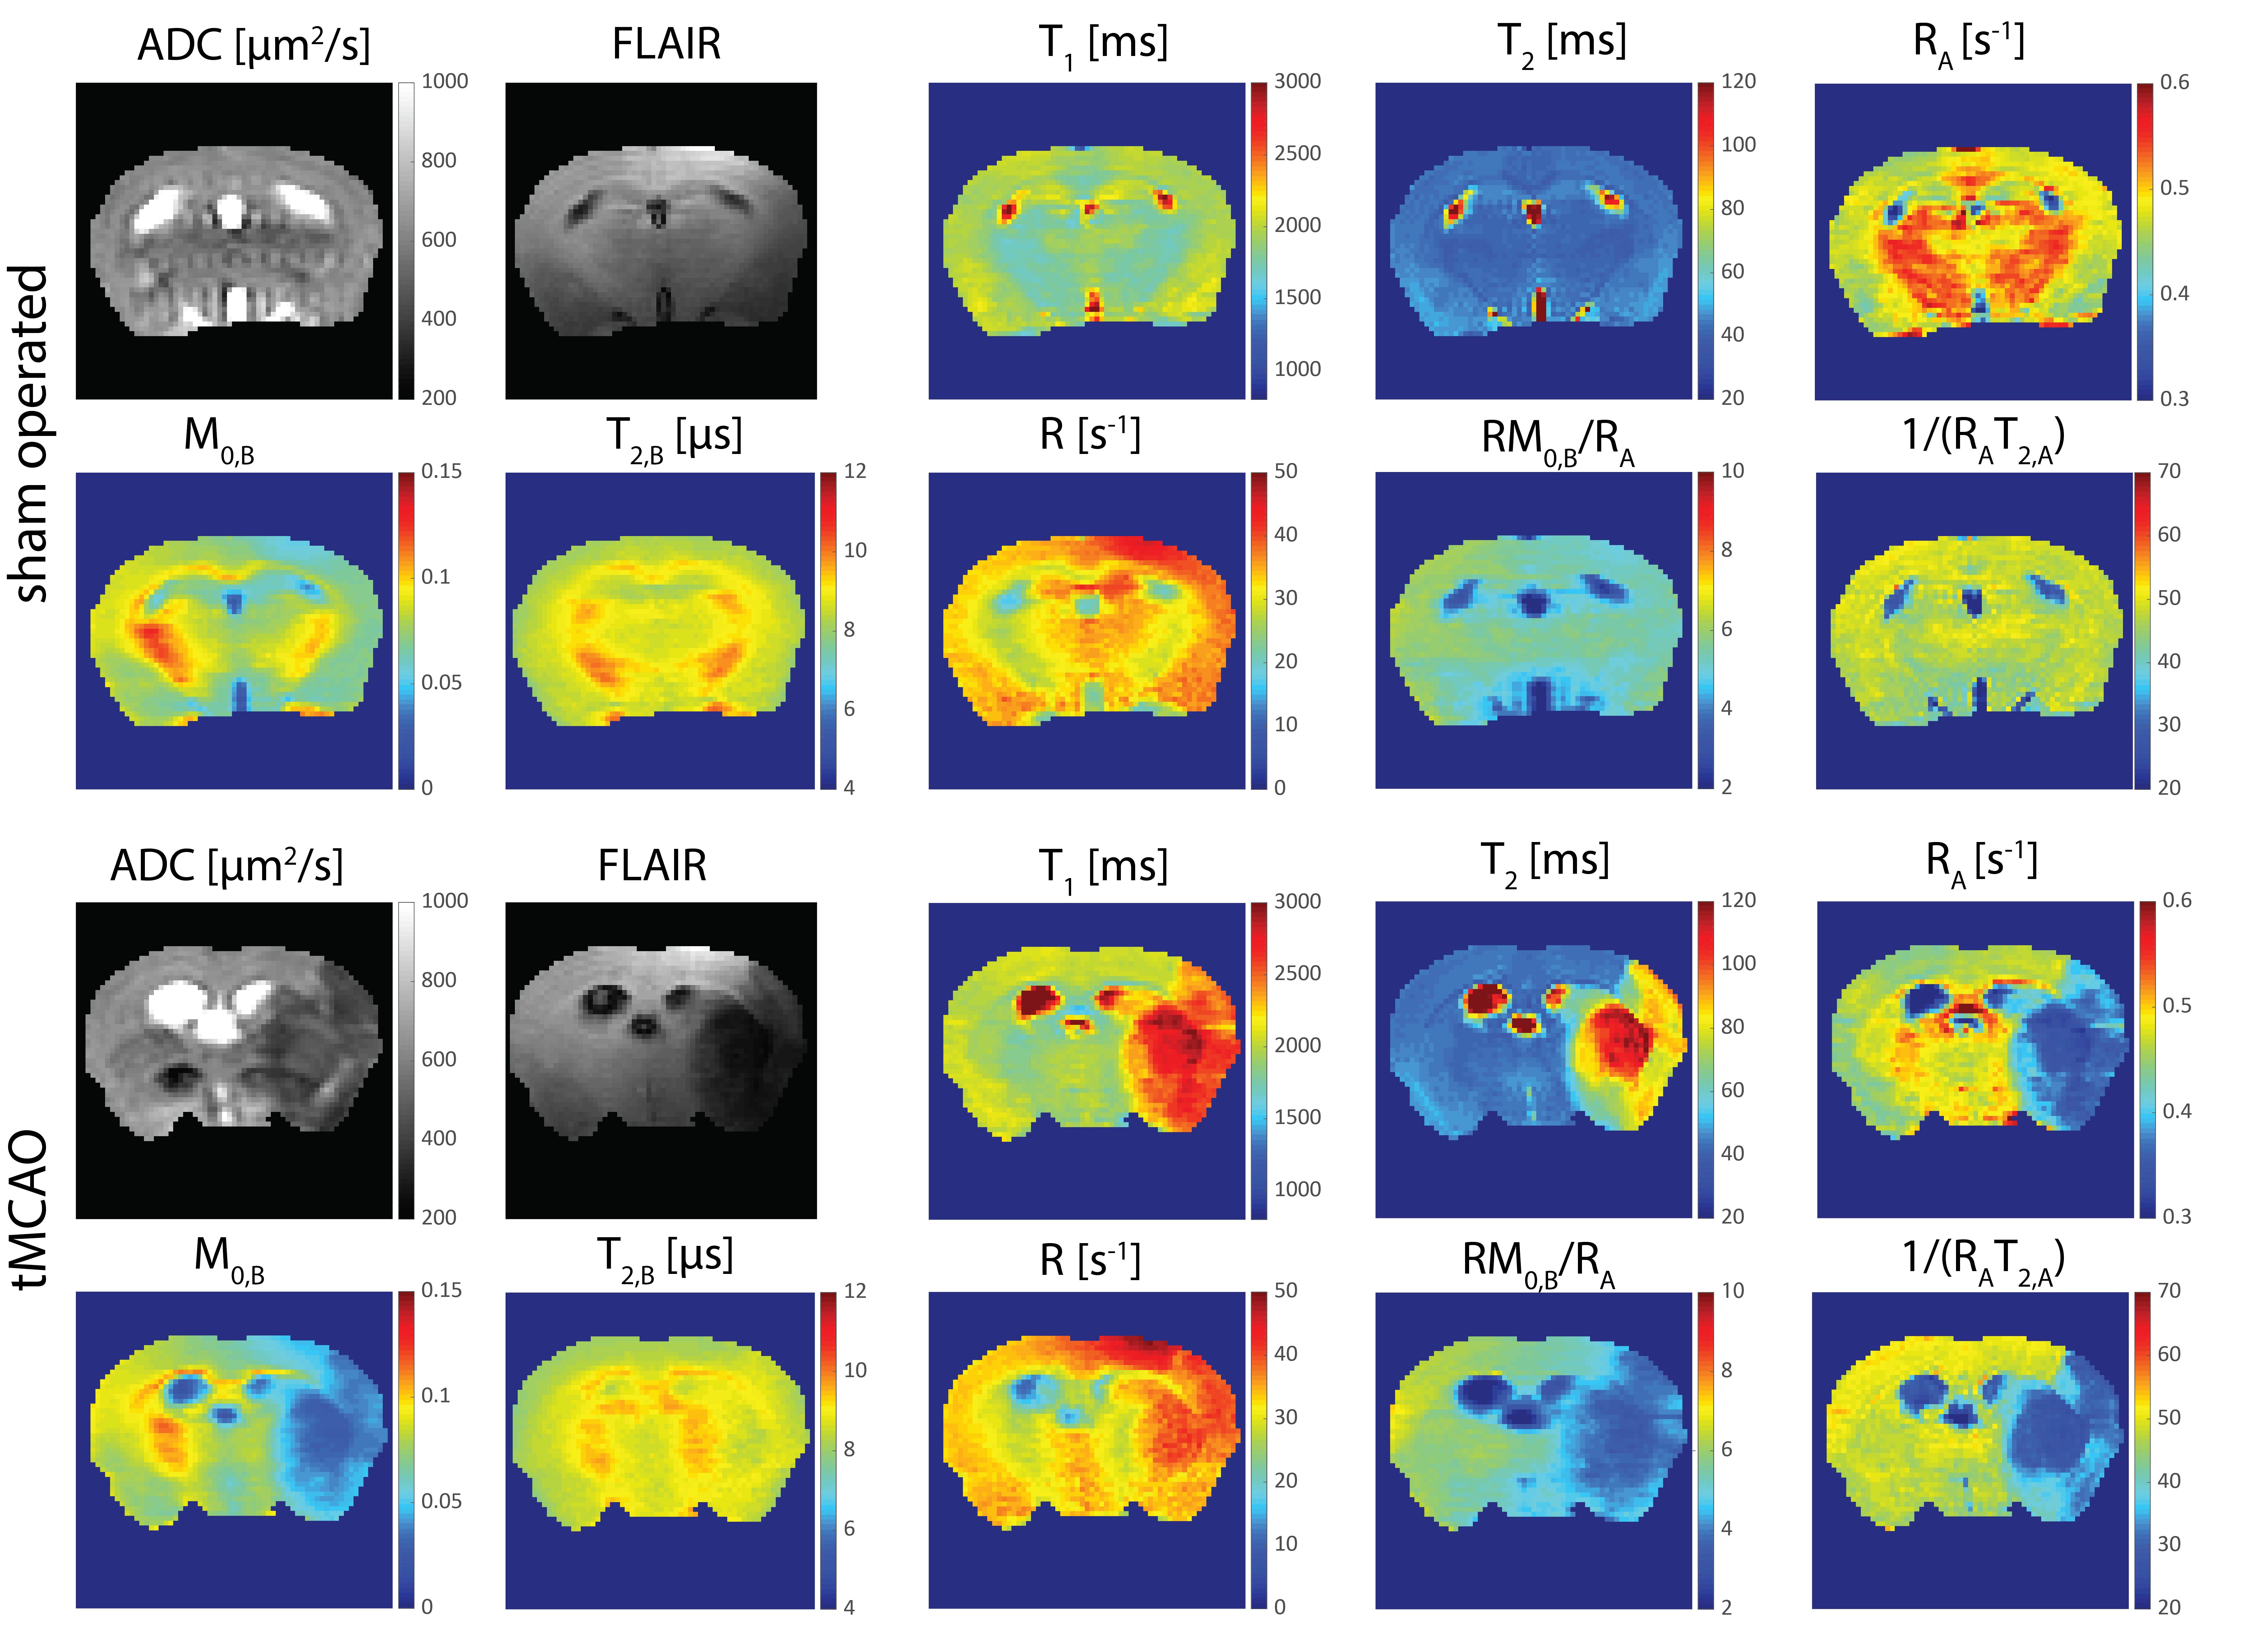
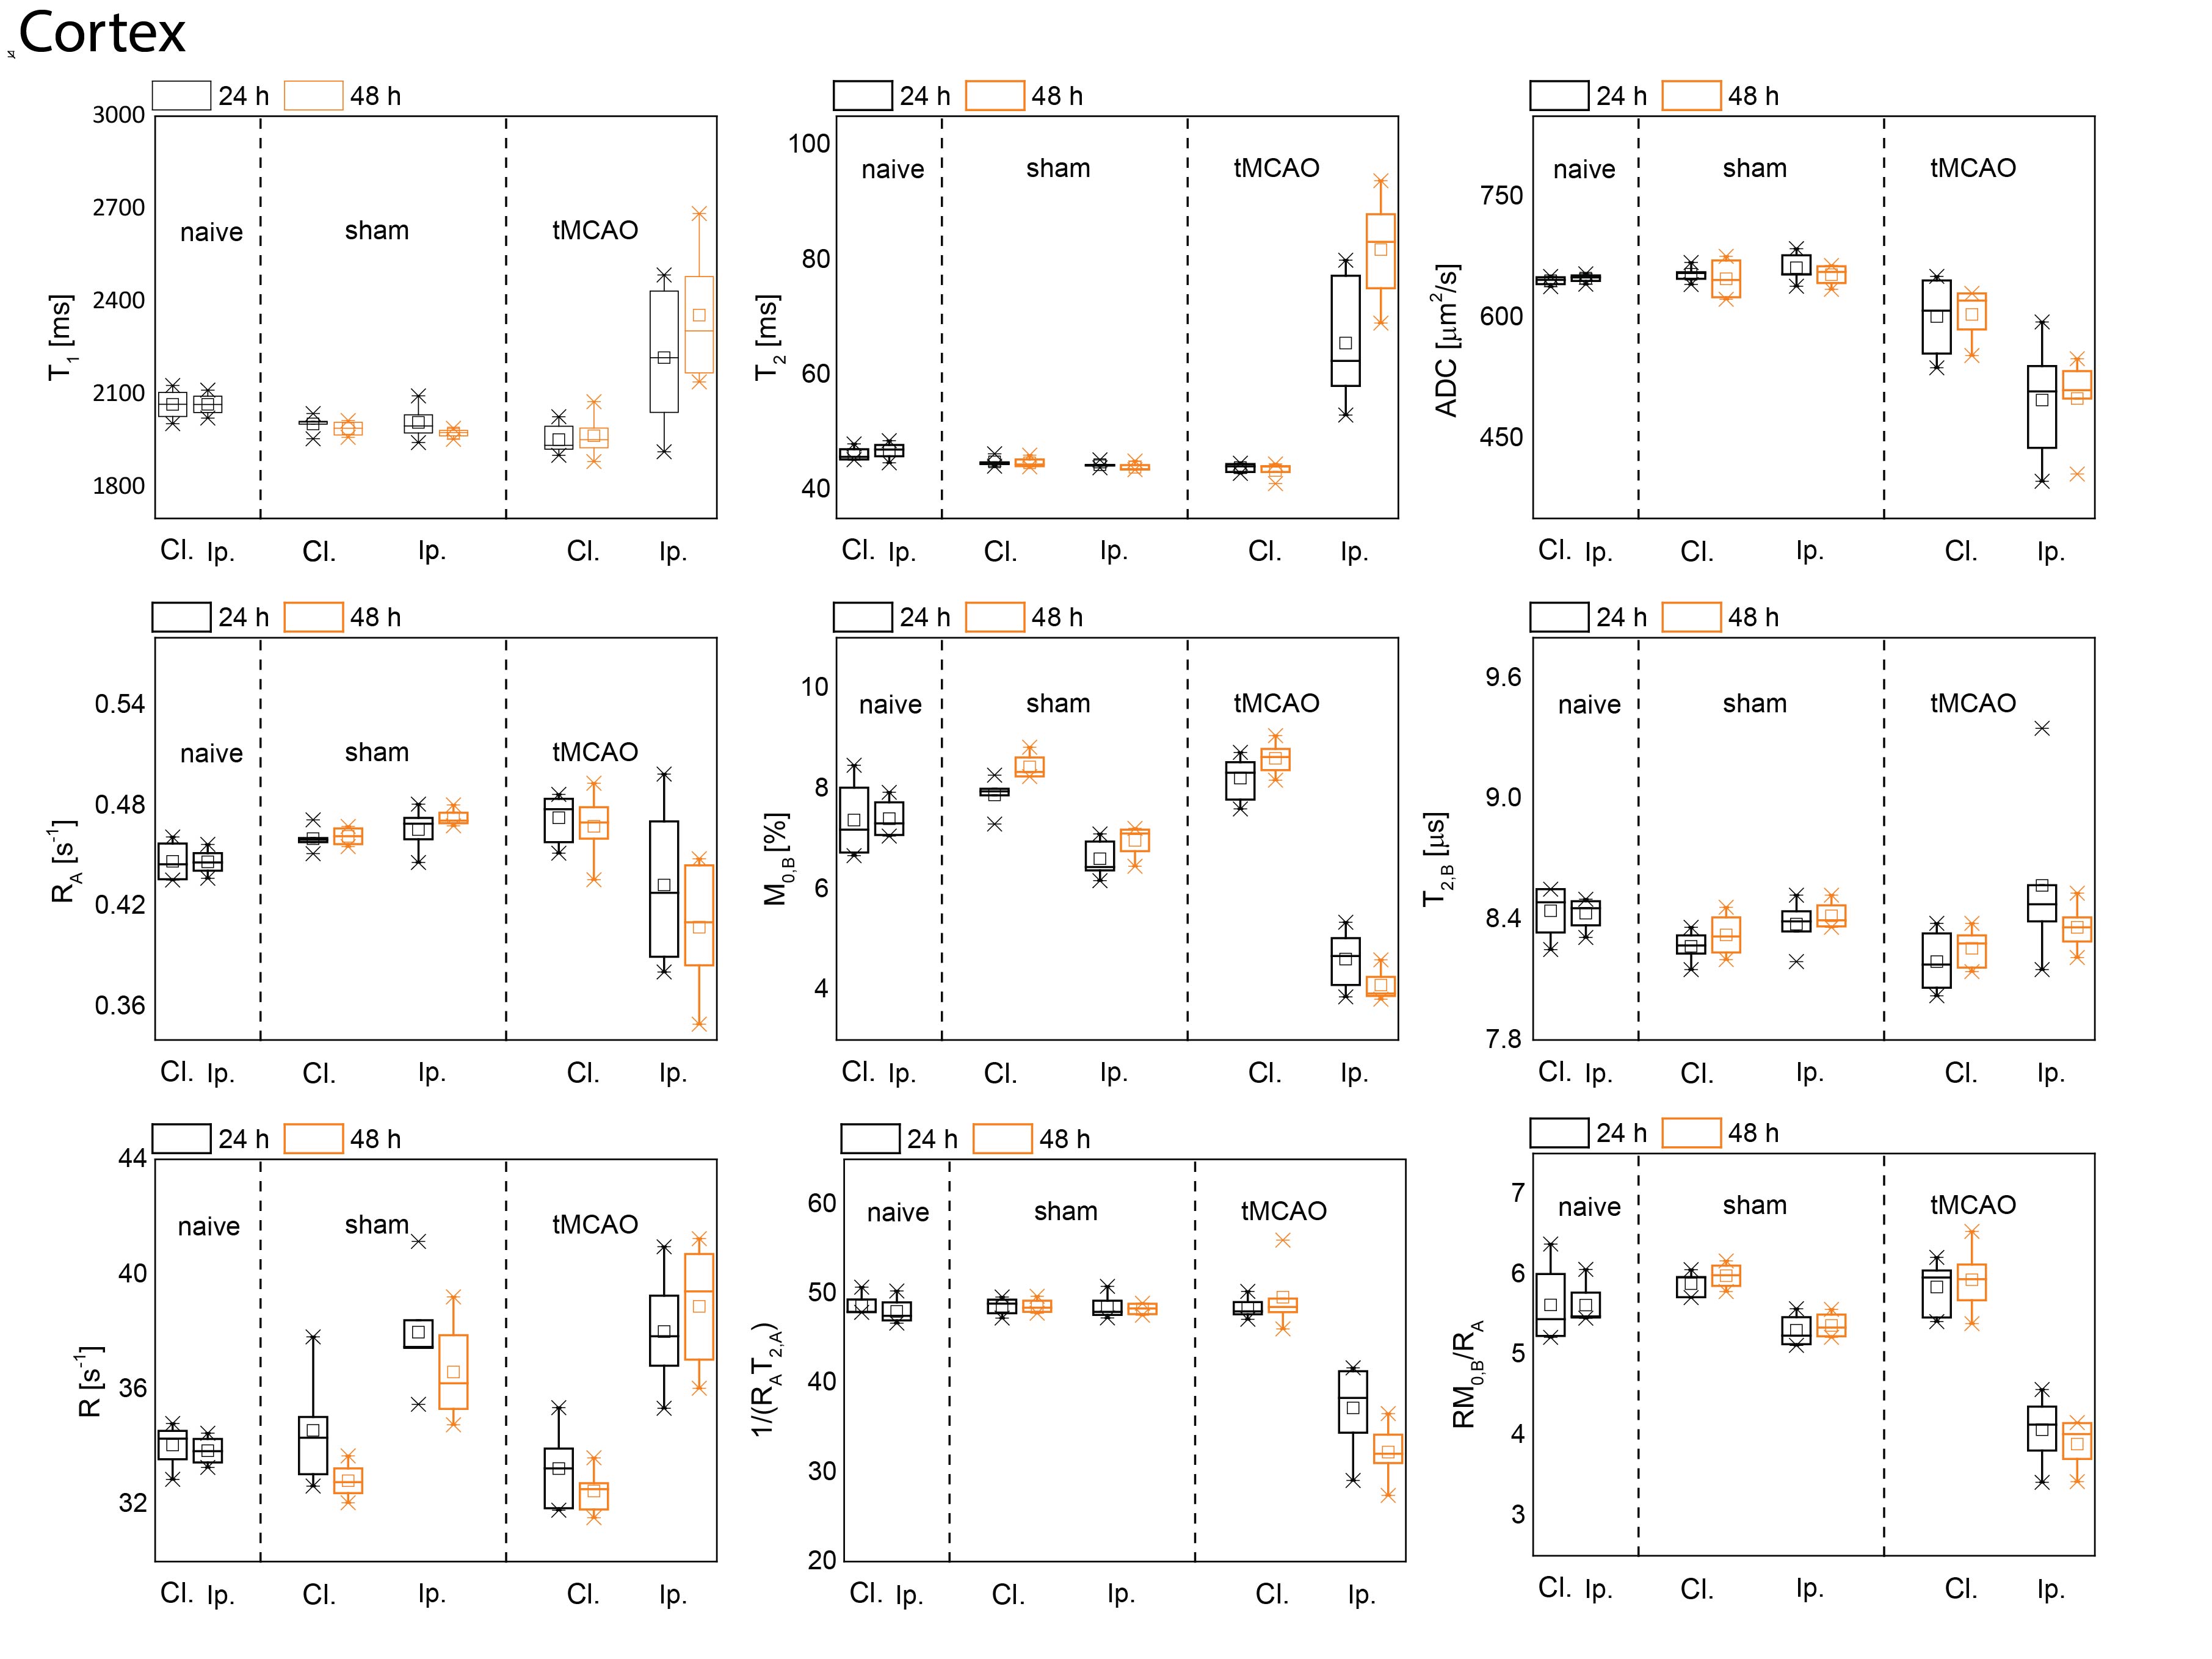
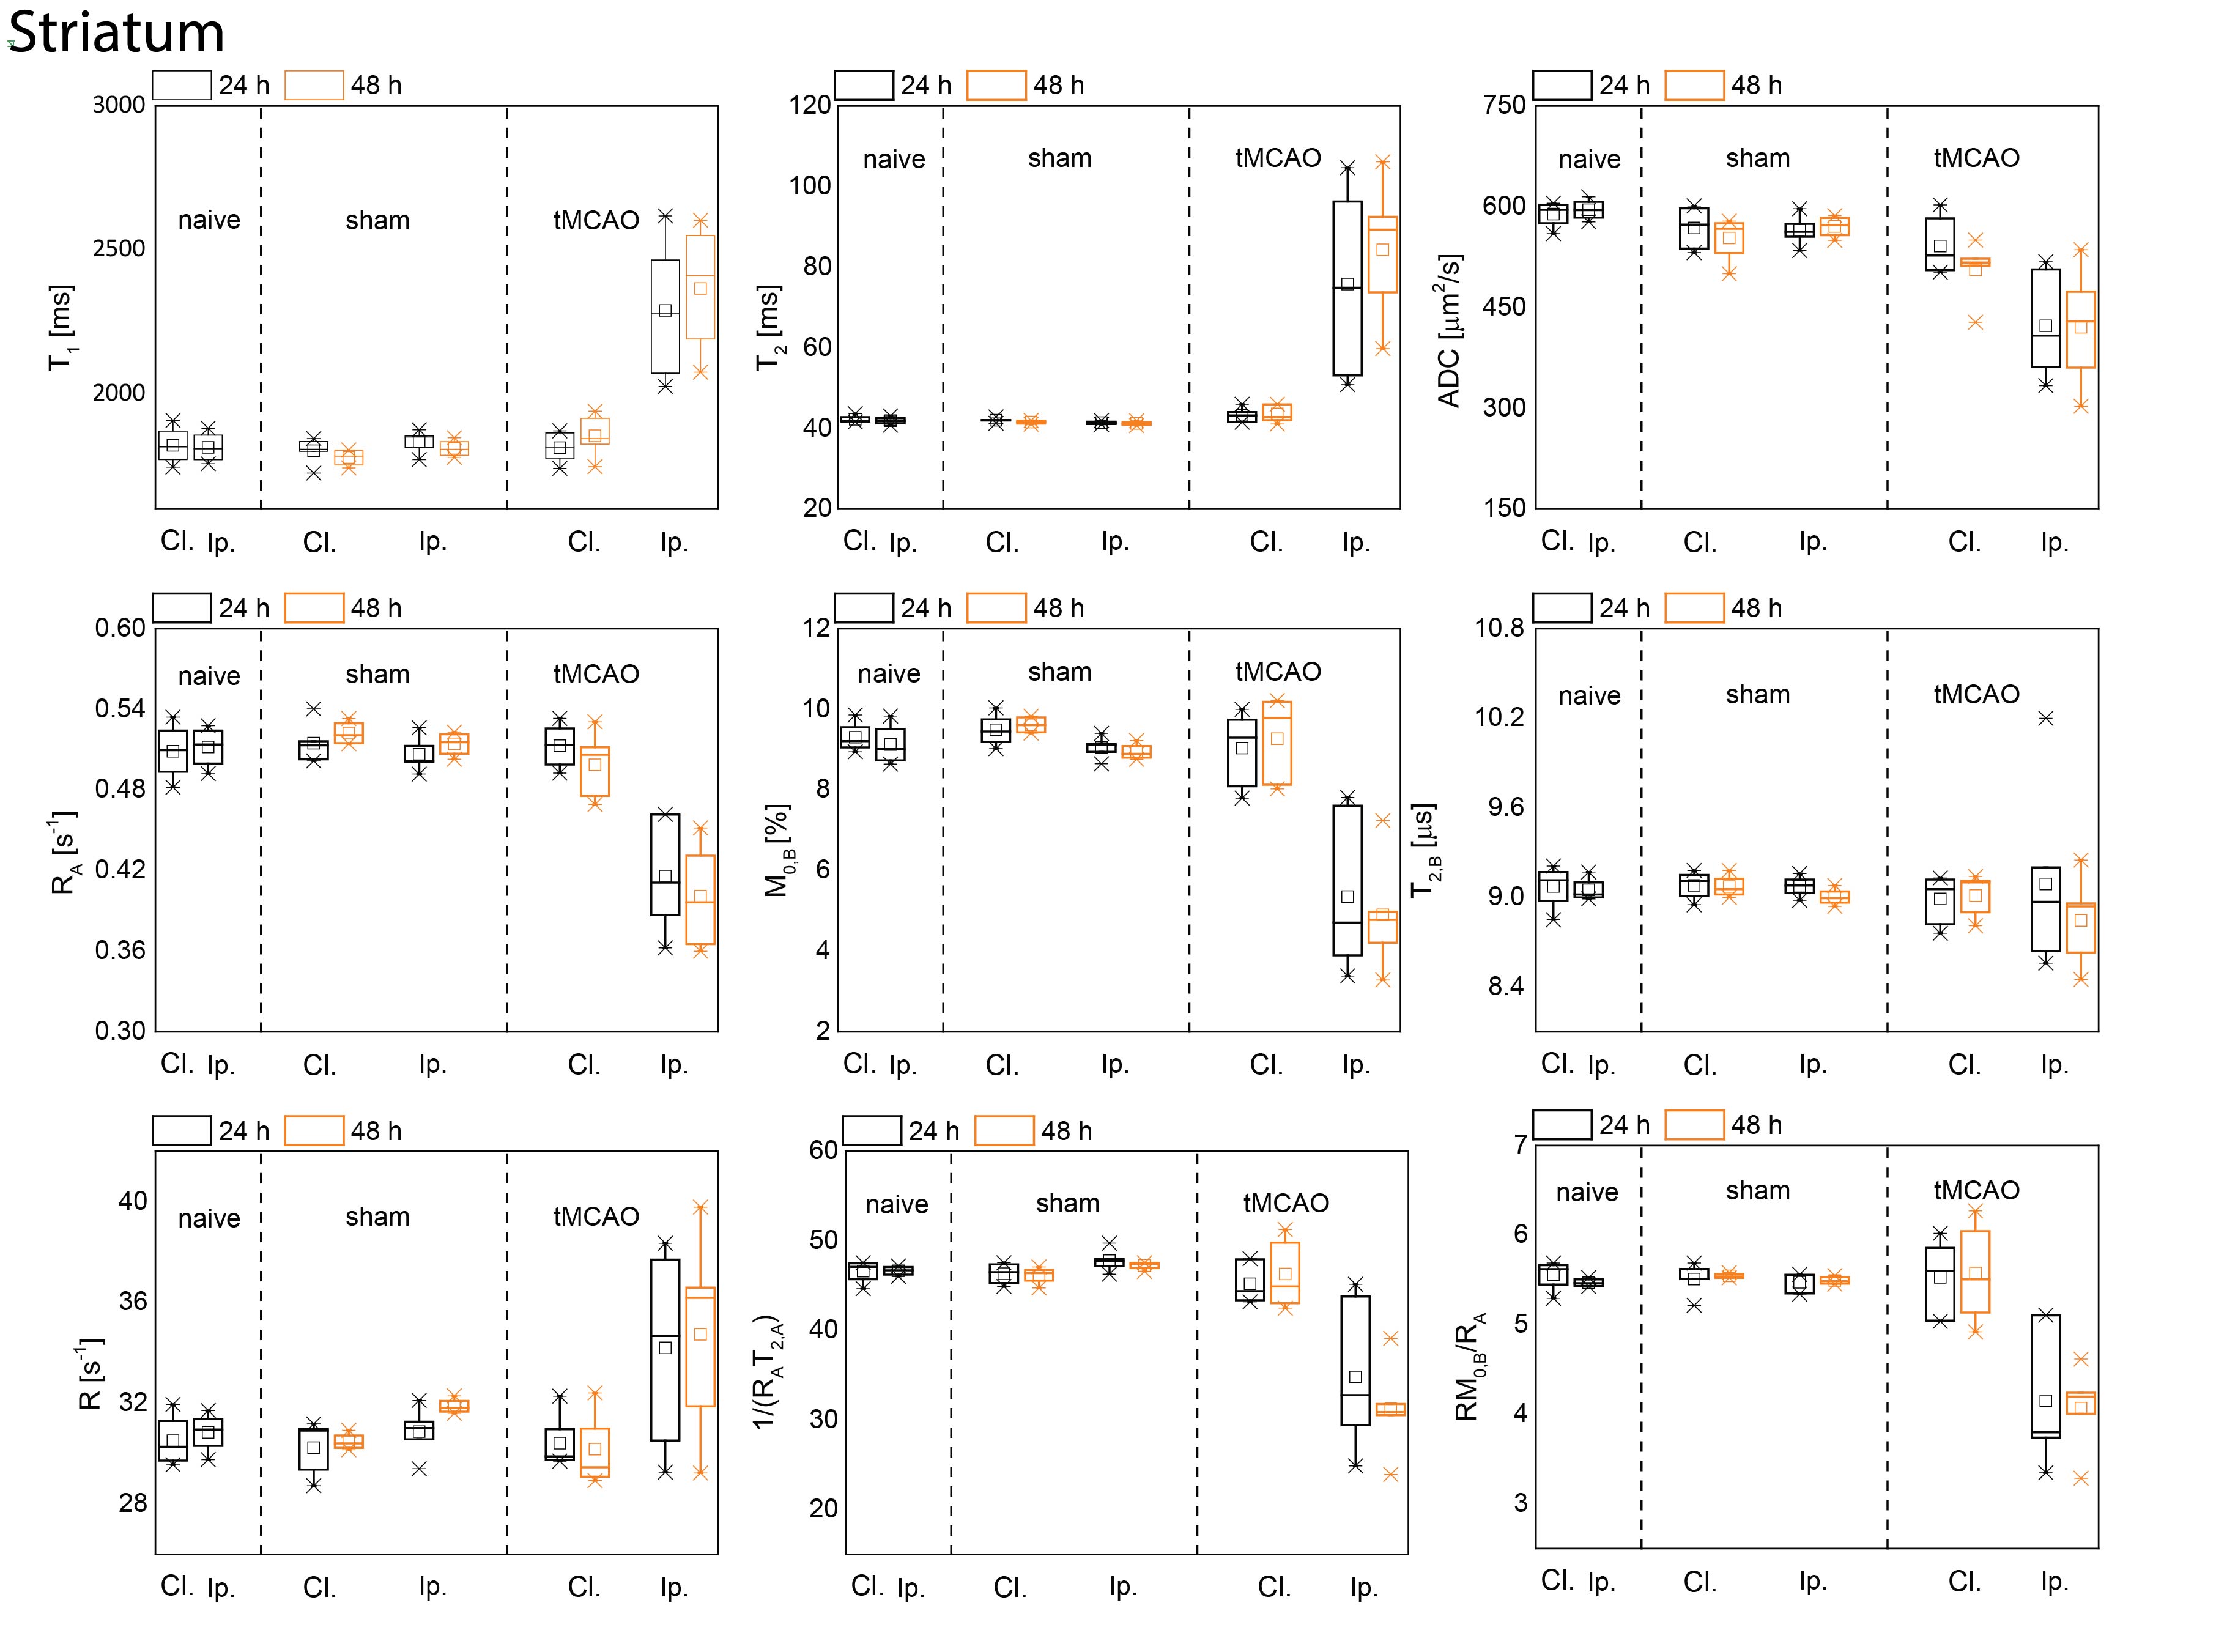
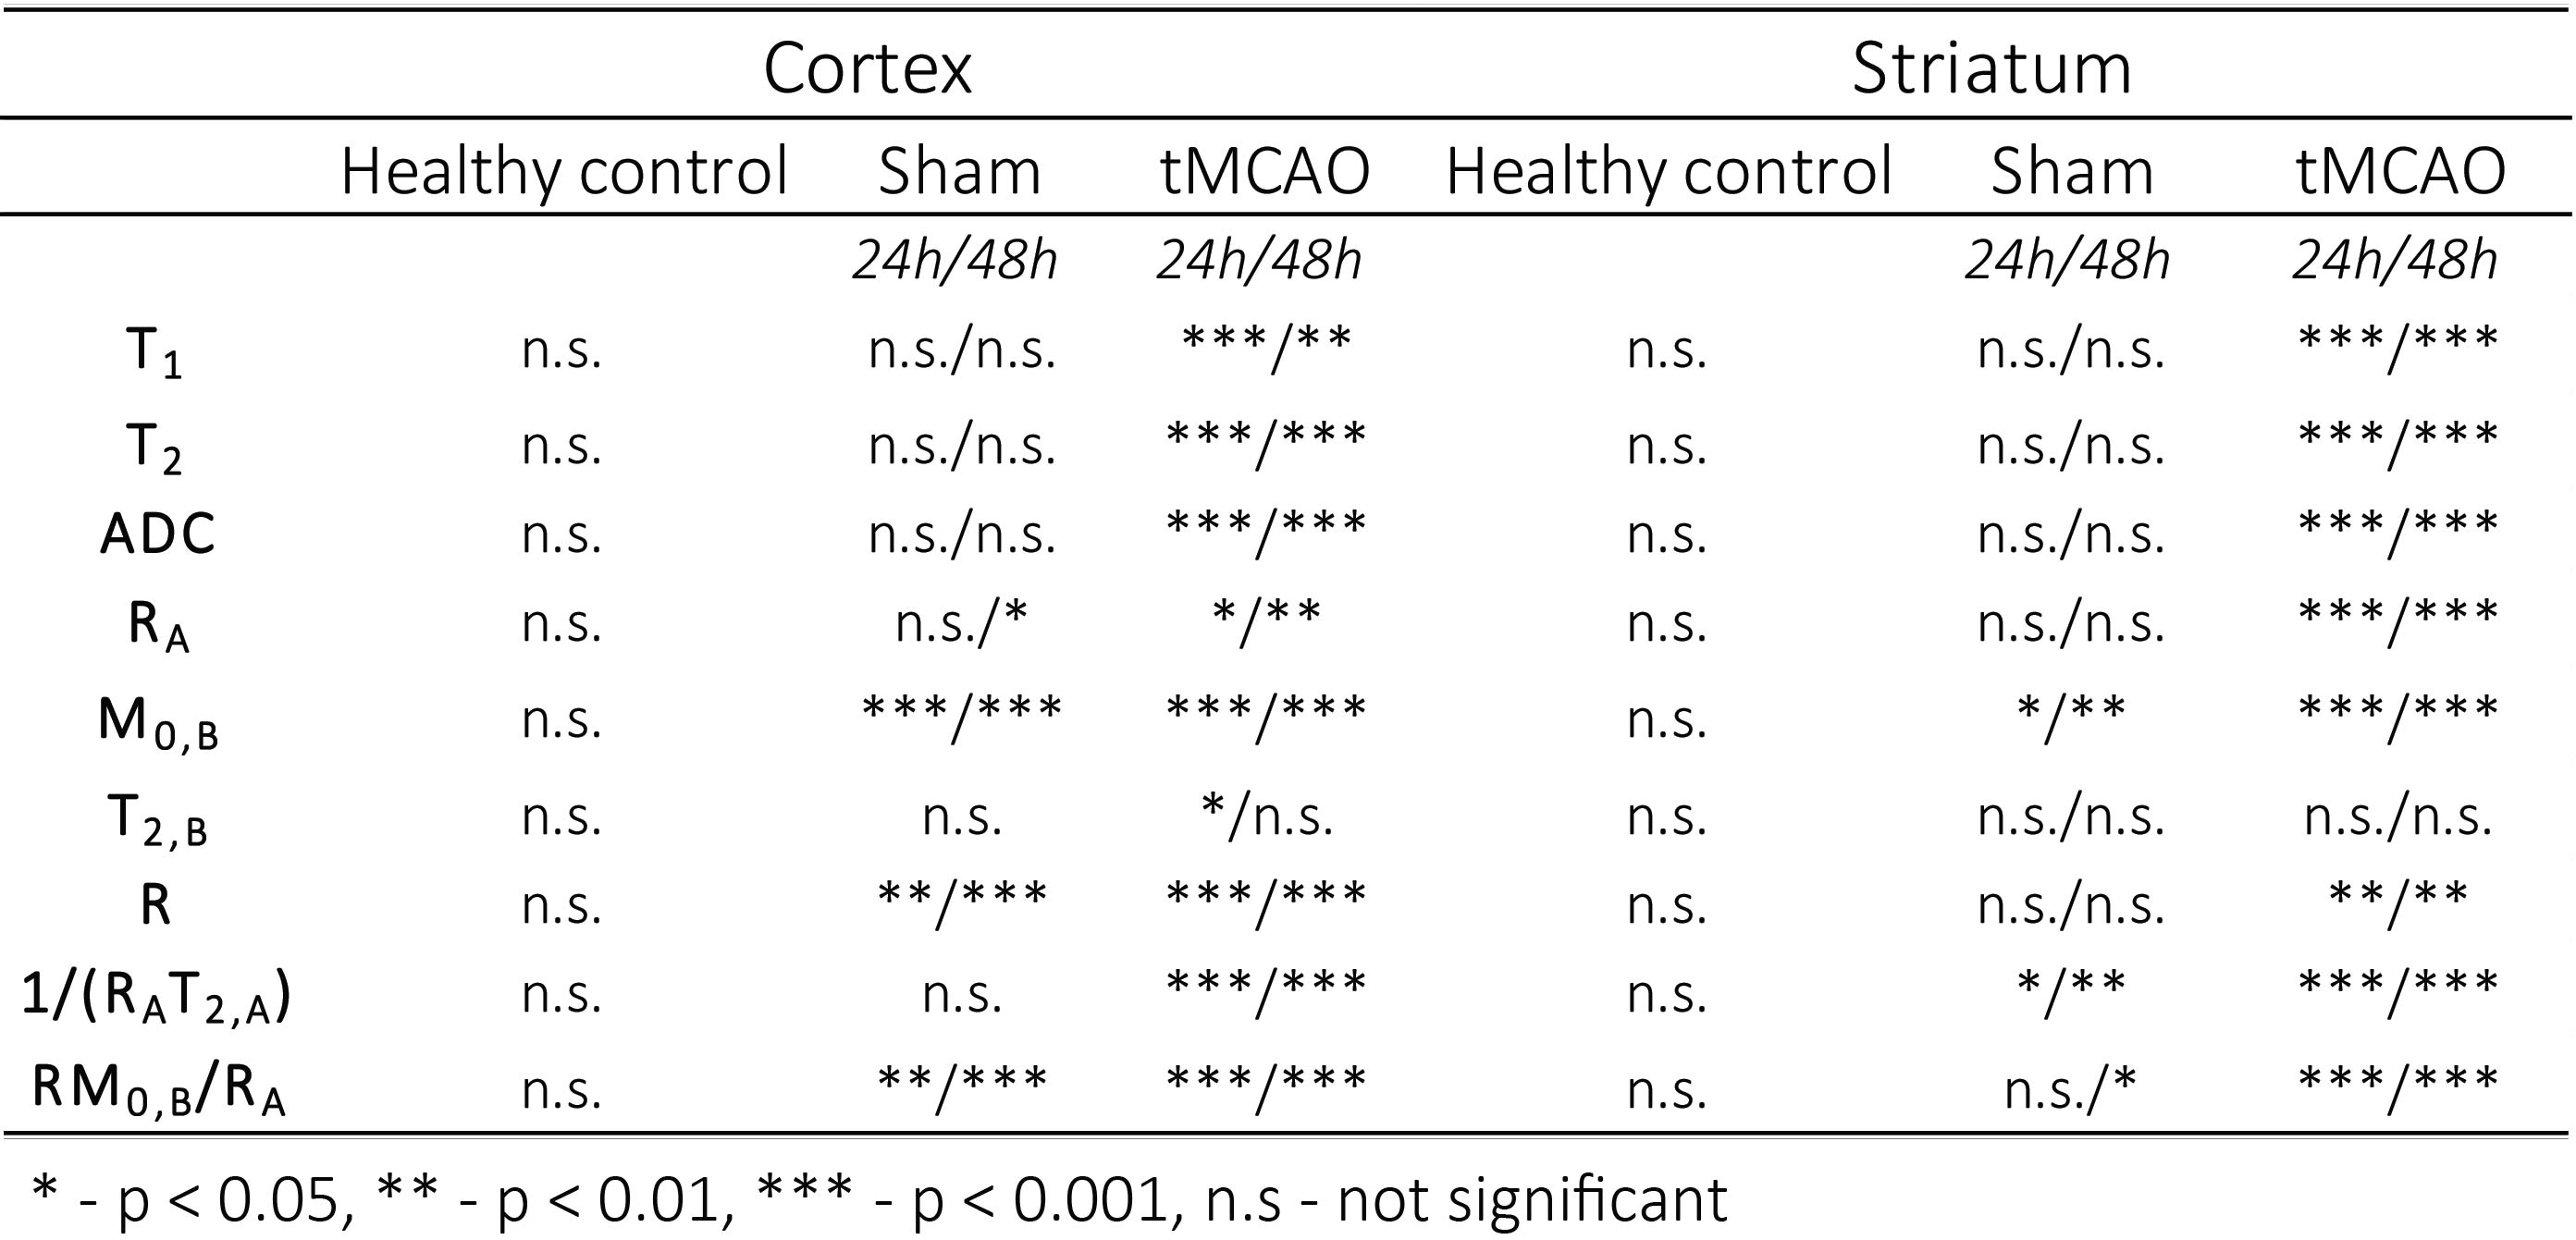
Examples of MT curves recorded in the contralateral and ipsilateral side at 24h post tMCAO are shown in Fig.1. Significantly lower saturation levels are observed in the lesion side as compared to the contralateral side. These changes were further characterized by employing a two-pool exchange model. The examples of parametric maps of qMT and standard MR metrics are shown in Fig.2. The longitudinal changes in qMT and other MR metrics assessed at 24 and 48h post-reperfusion are compared using box plots, shown in Fig.3 for the cortex and in Fig.4 for the striatum. Significant changes (see Tab.1) of all MR contrast were found in tMCAO group, reflecting post-ischemia tissue remodeling.Discussion
Characteristic feature of T2 hyperintensities and reduced ADC values confirmed development of an ischemic lesion. Those changes correlate well with the changes in qMT maps. In particular, reduced fraction of semi-solid pool and increased exchange rate indicates breakdown of macromolecules, possibly evoked by edema and tissue necrosis as shown previously13–15. Moreover, statistically significant changes between brain sides were found also in sham-operated animals, which could not be detected with standard MR metrics (T1/T2/ADC). Similar to tMCAO group decreased fraction of semi-solid pool and increased exchange rates were observed. This was accompanied by an increase in the relaxation rate of the free water pool 48h post-surgery and could be likely linked to hypoperfusion and activation of lymphatic system.Acknowledgements
This project has received funding from the European Union’s Horizon 2020 research and innovation program under grant agreement No 820374.References
1. Henkelman RM, Stanisz GJ, Graham SJ. Magnetization transfer in MRI : a review. NMR Biomed. 2001;14:57-64. doi:10.1002/nbm.683
2. Natt O, Watanabe T, Boretius S, Frahm J, Michaelis T. Magnetization transfer MRI of mouse brain reveals areas of high neural density. Magn Reson Imaging. 2003;21:1113-1120. doi:10.1016/j.mri.2003.08.012
3. Whittaker HT, Zhu S, Di DL, et al. T1,diffusion tensor, and quantitative magnetization transfer imaging of the hippocampus in an Alzheimer’s disease mouse model. Magn Reson Imaging. 2018;50(February):26-37. doi:10.1016/j.mri.2018.03.010
4. Stockton KC, Frost C, Siddique MM, Macmanus DG, Rossor MN. Magnetization Transfer Ratio in Alzheimer Disease : Comparison with Volumetric. Am J Neuroradiol. 2007;28:956-970.
5. Levesque IR, Giacomini PS, Narayanan S, et al. Quantitative Magnetization Transfer and Myelin Water Imaging of the Evolution of Acute Multiple Sclerosis Lesions. Magn Reson. 2010;63:633-640. doi:10.1002/mrm.22244
6. Bailey C, Desmond KL, Czarnota GJ, Stanisz GJ. Quantitative Magnetization Transfer Studies of Apoptotic Cell Death. Magn Reson. 2011;66:264-269. doi:10.1002/mrm.22820
7. Mehrabian H, Myrehaug S, Soliman H, Sahgal A. Quantitative Magnetization Transfer in Monitoring Glioblastoma ( GBM ) Response to Therapy. Sci Rep. 2018;(November 2017):1-11. doi:10.1038/s41598-018-20624-6
8. Vaas M, Enzmann G, Perinat T, et al. Non-invasive near-infrared fluorescence imaging of the neutrophil response in a mouse model of transient cerebral ischaemia. J Cereb Blood Flow Metab. 2017;37(8):2833-2847. doi:10.1177/0271678X16676825
9. Vaas M, Ni R, Rudin M, Kipar A, Klohs J. Extracerebral tissue damage in the intraluminal filament mouse model of middle cerebral artery occlusion. Front Neurol. 2017;8(MAR):1-6. doi:10.3389/fneur.2017.00085
10. Vaas M, Deistung A, Reichenbach JR, Keller A, Kipar A, Klohs J. Vascular and Tissue Changes of Magnetic Susceptibility in the Mouse Brain After Transient Cerebral Ischemia. Transl Stroke Res. 2018;9(4):426-435. doi:10.1007/s12975-017-0591-x
11. Henkelman RM, Huang X, Xiang Q, Stanisz GJ, Swanson SD, Bronskill MJ. Quantitative Interpretation of Magnetization Transfer.
12. Morrison C, Stniasz G, Henkelman RM. Modeling Magnetization Transfer for Biological-like System Usinf a Semi-solid Pool with a Super-Lorentzian Lineshape and Dipolar Reserviour. J Magn Reson Ser B. 1995;108:103-113.
13. Ordidge RJ, Helpern JA, Knight RA, Qing Z, Welch KMA. Investigation of cerebral ischemia using magnetization transfer contrast (MTC) MR imaging. Magn Reson Imaging. 1991;9(6):895-902. doi:10.1016/0730-725X(91)90533-R
14. Jiang Q, Ewing JR, Zhang ZG, et al. Magnetization Transfer MRI : Application to Treatment of Middle Cerebral Artery Occlusion in Rat. J Magn Reson Imaging. 2001;13:178-184.
15. Heidi IM, Kettunen MI, Gröhn OHJ, Kauppinen RA. Quantitative T1p and Magnetization Transfer Magnetic Resonance Imaging of Acute Cerebral Ischemia in the Rat. J Cereb Blood Flow Metab. 2002;22:547-558.
Figures